GBPAUD SHORT Market structure bearish on HTFs 3
Entry at Daily AOi
Weekly Rejection at AOi
Previous Weekly Structure Point
Daily Rejection at AOi
Previous Daily Structure Point
Daily Head and Shoulder Pattern, Retest of the neckline
Around Psychological Level 2.01500
H4 Candlestick rejection
Rejection from Previous structure
TP: WHO KNOWS!
Entry 105%
REMEMBER : Trading is a Game Of Probability
: Manage Your Risk
: Be Patient
: Every Moment Is Unique
: Rinse, Wash, Repeat!
: Christ is King.
Support and Resistance

USDJPY LONG Market structure bullish on HTFs 3
Entry at Both Weekly And Daily AOi
Weekly Rejection at AOi
Daily Rejection at AOi
Previous Daily Structure Point
Around Psychological Level 154.500
H4 Candlestick rejection
TP: WHO KNOWS!
Entry 95%
REMEMBER : Trading is a Game Of Probability
: Manage Your Risk
: Be Patient
: Every Moment Is Unique
: Rinse, Wash, Repeat!
: Christ is King.

NZDCAD SHORT Market structure bearish at HTFs 3
Entry at both Weekly And Daily AOi
Weekly Rejection at AOi
Previous Weekly Structure Point
Daily Rejection at AOi
Daily EMA retest
Around Psychological Level 0.80000
Touching EMA H4
H4 Candlestick rejection
TP: WHO KNOWS!
Entry 115%
REMEMBER : Trading is a Game Of Probability
: Manage Your Risk
: Be Patient
: Every Moment Is Unique
: Rinse, Wash, Repeat!
: Christ is King.

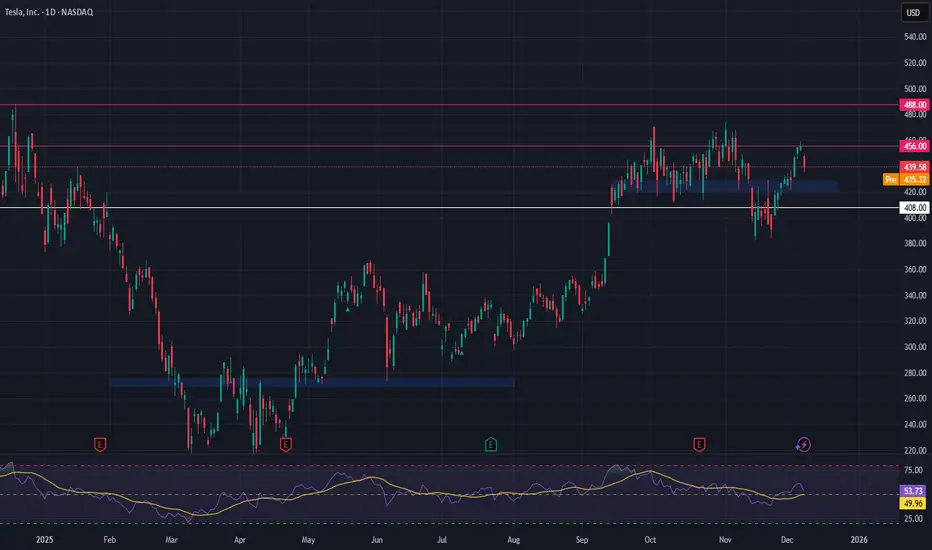
Tesla Rejected at Key Breakout — Bullish Structure Still Intact NASDAQ:TSLA just got rejected at a major breakout level, but the bigger picture remains bullish. Price action shows a healthy uptrend with momentum building, suggesting this could just be a pause before continuation. As volume trends higher on dips, it hints that buyers are still active—just waiting for cleaner levels.
📅 With the FOMC coming up, expect potential de-risking or volatility across markets. That could drag TSLA lower short term, but it also opens the door for a cleaner entry near strong support. Watching the $421–$428 range for signs of a bounce or consolidation.
🔽 Trade Plan
Entry Zone: $421 – $428
Take Profit 1: $456
Take Profit 2: $488
Stop Loss: $408
USD Poised for Breakout Ahead of High-Stakes Fed DecisionThe range broke lower into the December open with the index plunging 1.6% before rebounding off Fibonacci support to register a weekly close-low last week at 98.99. The focus now shifts to the Fed rate decision tomorrow with the monthly opening-range taking shape just above support- decision time for the US Dollar.
Initial weekly support rests with the 38.2% retracement of the advance off the yearly low at 98.80. A break / weekly close below this threshold would threaten another bout of accelerated losses with the next major technical consideration seen at the 2025 low-week close (LWC) and the 61.8% retracement at 97.65/81- look for a larger reaction there IF reached. Subsequent support rests with the 2021 swing high at 96.94 and the 2025 swing low at 96.22.
Key resistance remains unchanged at the 100.15/42- a region defined by the 2024 swing low, the November high-week close, the July high, and the 2024 LWC. A topside breach / weekly close above this threshold is needed to mark resumption of the September uptrend with subsequent resistance objectives eyed at the 52-week moving average (currently ~101.20) and the 38.2% retracement of the yearly range at 101.55.
Bottom line: The U.S. Dollar is trading just above confluent support with the monthly opening-range in focus heading into major event risk. Look for the breakout to offer guidance in the days ahead. From a trading standpoint, losses would need to be limited to 98.80 for the September uptrend to remain viable with a weekly close above 100.42 ultimately needed to fuel the next leg of the advance.
-MB

EURUSD Pullback analysis chart.EUR/USD – Structure & Trend Summary
EUR/USD is moving inside a descending channel, respecting both the upper trendline (lower highs) and the lower trendline (lower lows). Price continues to react from the channel boundaries, confirming a bearish market structure.
Recent price action shows:
Rejections from the upper trendline, forming repeated HH (lower high attempts) but failing to break the bearish channel.
Strong bearish impulses from each lower high, creating symmetrical downward legs.
Support touches on the lower trendline, followed by corrective pullbacks.
The latest swing has again rejected the upper channel line and is showing momentum toward the downside.
Bias: Bearish
Expectation: If structure continues to hold, EUR/USD may extend toward the lower trendline once again, aligning with previous –0.37% measured moves.
Key Notes:
Channel resistance remains strong.
Market respecting HH → HL swings but still failing to break bullish structure.
As long as price stays below the trendline, bearish continuation remains likely.
What you think about EURUSD, write your feedback in comment section.

GOLD (XAU/USD): Consolidation ContinuesGold is currently consolidating within a horizontal parallel channel.
We spotted a notable bullish reaction to its support:
the price formed a small double bottom pattern and subsequently started to rise, violating its neckline with a bullish imbalance.
It is highly probable that the price will reach the 4220 level soon.

Big Week for USD: USDJPY Approaches Major Sell Zone!Hey Traders,
In today's trading session we are monitoring USDJPY for a selling opportunity around the 155.750 zone. USDJPY is trading in a downtrend and is currently in a correction phase, approaching the trend area at 155.750, which acts as a key support-turned-resistance level.
On the fundamental side, recent U.S. data continues to support a weaker Dollar as markets increasingly price in a 25bps cut heading into the FOMC. With traders front-running the event, USD momentum remains fragile. If the market over-prices the move ahead of Wednesday, be cautious of the classic "buy the rumor, sell the fact" dynamic.
This broader Dollar softening environment supports further downside in USDJPY as long as the pair remains below the trend structure.
Trade safe,
Joe.

XAUUSD Set for Surge? Safe-Haven Demand and Fed Cut Bets AlignHey Traders,
In today’s session we are monitoring XAUUSD for a potential buying opportunity around the 4,200 zone. Gold remains in a strong uptrend, and the current correction is bringing price back toward the key 4,200 support–resistance area, which could offer a favorable entry.
Fundamentally, GOLD should continue to benefit from the ongoing weakening of the U.S. Dollar, driven by expectations of a 25bps rate cut. As we head into Wednesday’s FOMC, markets are likely to keep front-running the event, which typically pressures the dollar lower.
Just be cautious—if we see too much front-running, the classic “buy the rumor, sell the fact” reaction could hit once the decision is officially announced.
Additionally, rising geopolitical tensions between Venezuela and the United States are increasing safe-haven demand, which further supports upside for Gold.
Trade safe,
Joe.

Gold prices fell as expected, a bearish outlook.Gold Price Trend Analysis: Gold traded in a range on the previous day, closing with a bearish candlestick with upper and lower shadows. Overall, gold continues to fluctuate without a clear directional trend. The market is awaiting the Fed's interest rate decision, and it seems we need to wait for the data to determine the direction. Yesterday's rebound encountered resistance near 4220 and fell as expected. Gold is currently maintaining a slightly weaker, range-bound trend on the daily chart. Short-term moving averages are starting to turn downwards, and the price center is gradually shifting lower, suggesting further downside potential. Short-term support is expected around 4165-4150.
Gold Technical Analysis: On the 4-hour chart, the price broke below the short-term support zone, and the candlestick pattern is gradually coming under pressure from the short-term moving averages, maintaining a slightly weak and volatile trend. In the short term, attention should be paid to a second downward move after a slight rebound. The 4-hour chart shows divergence, with the price falling back after failing to break through the 4220 level yesterday. Recently, it has been maintaining a range of 4170-4220, but the highs of this week's rebounds have been gradually decreasing, indicating that the bulls' upward momentum is weak, unlike the previous surge. Currently, it is still maintaining a volatile trend. On the hourly chart, after continuous fluctuations, the technical pattern shows signs of gradual repair. Short-term moving averages are starting to turn upwards, suggesting potential for a short-term rebound. Pay attention to the short-term rebound and repair. Currently, the support level for gold remains at 4165-4150, while the short-term resistance level is around 4210-4220. If it continues to be pressured in the 4210-4220 area, shorting on rallies is still an option. If support is found at 4165-4150, a short-term rebound is possible. In summary, today's trading strategy for gold is to primarily sell on rallies and secondarily buy on dips. The key short-term resistance level to watch is around 4210-4220, and the key short-term support level is around 4165-4150. Please follow the trend closely.

retracement ?? GBPJPYImpatience often leads to impulsive decisions and mistakes. Patient traders, however, wait for the right opportunities and allow their investments to mature, often reaping significant rewards.

Banknifty Banknifty levels are based on volume profile
1. Gapup 59700 long
2. 59700-59450 trade breakout
3. Gapdown 59450 short

Nifty Nifty levels are based on volume profile
1. Gapup 26050 long
2. 26050-25920 trade breakout
3. Gapdown 25920 short

USDCHF 4HA structured approach to market analysis combining Fibonacci retracement levels with key Support & Resistance zones.
Price action is monitored to identify reaction points, liquidity zones, and potential reversal or continuation setups.
The analysis focuses on high-probability confluence areas where Fibonacci ratios align with historical structure levels, helping traders spot optimal entry points, stop-loss zones, and profit-taking targets.

UBER Investment ThesisUBER is shifting from a ride hailing and food delivery platform into something that looks more like core logistics infrastructure and that evolution is becoming a bigger part of my bull thesis.
The stock is trading around $91, up solidly over the past year, and the chart shows a clear uptrend. Right now price is consolidating just below the prior 52-week highs, which feels more like a healthy pause than a top, especially when you look at the revenue acceleration and margin expansion underneath.
The big fundamental piece to keep an eye on is Uber Direct. This is Uber's white-label last-mile network for retailers, where the company essentially rents out its driver and courier infrastructure to e-commerce and retail players who then use it under their own brand. Think of it like Amazon's AWS moment. Uber captures full logistics revenue without the usual customer acquisition costs or marketplace risk because the retailer is already bringing the demand. This infrastructure-style revenue sits on top of the existing Mobility and Delivery volumes, so as the network scales, incremental margins should expand. That margin expansion feeds through to earnings and, over time, should support a higher multiple.
From a trading perspective, this setup argues for buying dips within the trend as long as price holds above key support levels like recent swing lows and major moving averages, and as long as earnings revisions stay positive. If execution stays on track, upside over the next 12 to 24 months could come from continued double-digit revenue growth, rising EBITDA margins, and optionality around autonomous vehicles and new logistics partnerships. In that scenario, the stock could move toward the $120 to $125 area.
On the risk side, watch for any break for supports around $80, especially if it coincides with negative news on regulation, autonomous vehicle partnerships or a slowdown in logistics growth. If that happens, it makes sense to tighten stops or step aside until the fundamental story and the price action line back up.

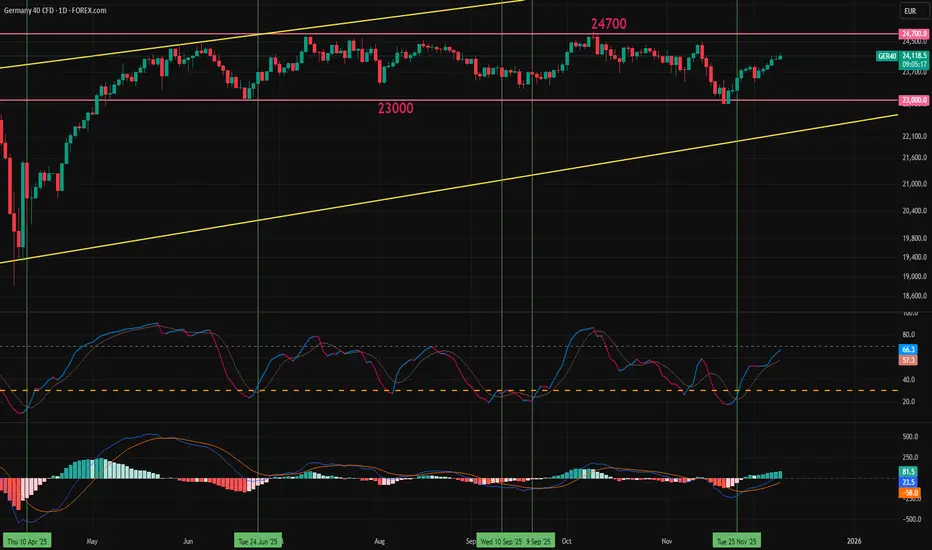
DAX Stuck in Sideways Grind, Year-End-Boost or Continued RangingThe DAX index has been moving sideways since May without any signs of a trend change. Weak German economic data, a struggling auto industry, ongoing Ukraine risks, and de-globalization moves from the US all limit the upside potential. However, with the new year approaching, incoming portfolio adjustments could provide a conservative boost to the index.
From the year start to the March top, the DAX rose more than 18% in a three-month period. After a big selloff and sharp recovery due to the April tariff announcement from Trump, returns from the start of the year reached over 23% by May. During this five-month period, the DAX positively diverged from the S&P 500, reaching above two standard deviations from the five-year average. Since then, the S&P 500 has continued to clinch gains while the DAX has been moving sideways in a 1,700-point-wide channel.
Germany's deep slump is expected to end in 2026, increasing GDP growth from 0.3% to 1% (market consensus). German CPI is expected to stay close to the 2% target like the rest of the EU, and lower ECB rates might give a conservative boost to investments. The changes are positive but not a significant boost for the DAX.
Now that the DAX/S&P 500 ratio has returned to its average, the correlation between the US stock market and the DAX might increase again. Currently, the relative momentum index (RMI) has generated a buy signal, similar to the MACD. Crossovers below “30” on the RMI and below “0” on the MACD usually provide decent bullish signals. However, the main focus will remain on the 24,700 resistance. Unless it is broken to the upside, the sideways move can be expected to continue.
Higher PMI, factory orders, and industrial production data have already shown a positive impact on the index, and post-COVID seasonality for December is historically bullish in December. The question is whether that will be enough to trigger a breakout.
GOLD – Liquidity Build-Up Ahead of Fed DecisionGOLD – Technical Overview
Gold is entering a high-tension phase as markets position ahead of the upcoming interest-rate decision by the
With a 25 bps cut nearly guaranteed, traders are shifting focus away from the decision itself and toward how the market reacts to it, especially in the hours surrounding the announcement.
Unlike earlier this year, the market is showing signs of pre-event positioning, where price stalls inside a broad range while liquidity builds on both sides. This type of structure often precedes a sharp directional break, but not before a sweep of the weaker stop-zones.
Additional pressure is coming from renewed tariff threats by
Donald Trump, which have weakened the
US Dollar Index and created a supportive backdrop for gold.
Market participants are also preparing for the delayed JOLTS job-openings report, which historically triggers a spike in intraday volatility. In previous cycles, gold has tended to dip into deeper support before recovering during the first 24–48 hours after a rate cut.
Overall, the current structure suggests a market that is coiling, waiting for enough liquidity to be collected before the next major move.
Technical Outlook – Liquidity Concept Added
Gold is now approaching 4198, a key intraday liquidity zone.
A 15min or 1H close below 4198 will unlock the bearish continuation toward
→ 4181 (liquidity pool)
→ 4152 (deep liquidity + strong demand zone)
These levels align with typical pre-FOMC liquidity grabs.
While above 4198, gold will consolidate between 4198 and 4218 until the next break.
A break and 1H close above 4218 will activate bullish momentum toward: 4237
→ Higher extensions if volatility expands post-data.
Pivot Line: 4204
Support: 4198 · 4181 · 4152
Resistance: 4218 · 4237

S&P 500 BUY | LONG TERMGreetings,
Looking for a reversal to sell and buy in long term.
Cheers,
Dikorocz

Sensex 10/12/2025 support resistance levels tomorrow 𝐒𝐞𝐧𝐬𝐞𝐱 10/12/2025 𝐬𝐮𝐩𝐩𝐨𝐫𝐭 𝐫𝐞𝐬𝐢𝐬𝐭𝐚𝐧𝐜𝐞 𝐥𝐞𝐯𝐞𝐥𝐬 𝐭𝐨𝐦𝐨𝐫𝐫𝐨𝐰
𝐓𝐫𝐞𝐚𝐝 𝐰𝐢𝐭𝐡 𝐬𝐭𝐨𝐩𝐥𝐨𝐬𝐬 🎯

Nifty50 10/12/2025 support resistance levels tomorrow 𝐍𝐢𝐟𝐭𝐲50 10/12/2025 𝐬𝐮𝐩𝐩𝐨𝐫𝐭 𝐫𝐞𝐬𝐢𝐬𝐭𝐚𝐧𝐜𝐞 𝐥𝐞𝐯𝐞𝐥𝐬 𝐭𝐨𝐦𝐨𝐫𝐫𝐨𝐰
𝐓𝐫𝐞𝐚𝐝 𝐰𝐢𝐭𝐡 𝐬𝐭𝐨𝐩𝐥𝐨𝐬𝐬 🎯

ENJ Sell/Short Signal (15M)It seems the market is waiting for the FED news on October 10.
That’s why market volatility has decreased, and we are forced to trade on lower timeframes.
The stop loss, entry zone, and targets are marked on the chart.
If you enter this position earlier, the risk-to-reward ratio will be lost. If price returns to the entry zone, we can enter the trade. Please note that if the final target is hit and then price comes back to the entry zone, we will not enter again.
Do not enter the position without capital management and stop setting
Comment if you have any questions
thank you

GOLD ANALYSIS | LOOKING FOR A BUY TO SELL ACTION🤑🤑🤑
Hello Hello,
Looking forward for a buy and a sell afterwards to a bigger buy later. Hopefully by this time we'll get the bag!
yours truly,
dikorocz😬

Mother line provides support to falling Nifty. Mother line or 50 EMA has provided today incredible support to Nifty which rose 111 points from low of the day to close at 25839. Still the Nifty closed 120 points below previous close. Now of the Mother line support is held we can see comeback of Nifty and rally can restart from there on. For the rally to restart we need a closing above 25930. The next resistance if we get a closing above 25930 will be 26062. Further resistance can be at 26194, 26352 and finally the channel top is near 26596. Supports for Nifty will be at 25728 (Mother Line support), Mid-Channel support is near 25608, 25338 is the final support. If this support is broken the father line support is at 24917.
Disclaimer: The above information is provided for educational purpose, analysis and paper trading only. Please don't treat this as a buy or sell recommendation for the stock or index. The Techno-Funda analysis is based on data that is more than 3 months old. Supports and Resistances are determined by historic past peaks and Valley in the chart. Many other indicators and patterns like EMA, RSI, MACD, Volumes, Fibonacci, parallel channel etc. use historic data which is 3 months or older cyclical points. There is no guarantee they will work in future as markets are highly volatile and swings in prices are also due to macro and micro factors based on actions taken by the company as well as region and global events. Equity investment is subject to risks. I or my clients or family members might have positions in the stocks that we mention in our educational posts. We will not be responsible for any Profit or loss that may occur due to any financial decision taken based on any data provided in this message. Do consult your investment advisor before taking any financial decisions. Stop losses should be an important part of any investment in equity.
