Trade idea on XauusdUpdate on how our IF ELSE condition played out with the zones we called out earlier.
Our initial POI was around
4000.00
4004.46
But in a fast moving market,price continues from the nearest available zone which was the reason for our ELSE condition at 3975.00 zone
That was the rationale behind the short idea, we just continued the trend from that zone and we got nice pips.
This can be repeated over and over again with ease.
The name of my Model, i call it the GJS
Believers geng
Support and Resistance

EURCHF: Bullish Move After Trap 🇪🇺🇨🇭
It looks like we have a confirmed liquidity grab on EURCHF.
A bearish violation of the underlined support looks false
after a consequent formation of a bullish imbalance candle.
The price may rise now to 0.9262 level.
❤️Please, support my work with like, thank you!❤️
I am part of Trade Nation's Influencer program and receive a monthly fee for using their TradingView charts in my analysis.

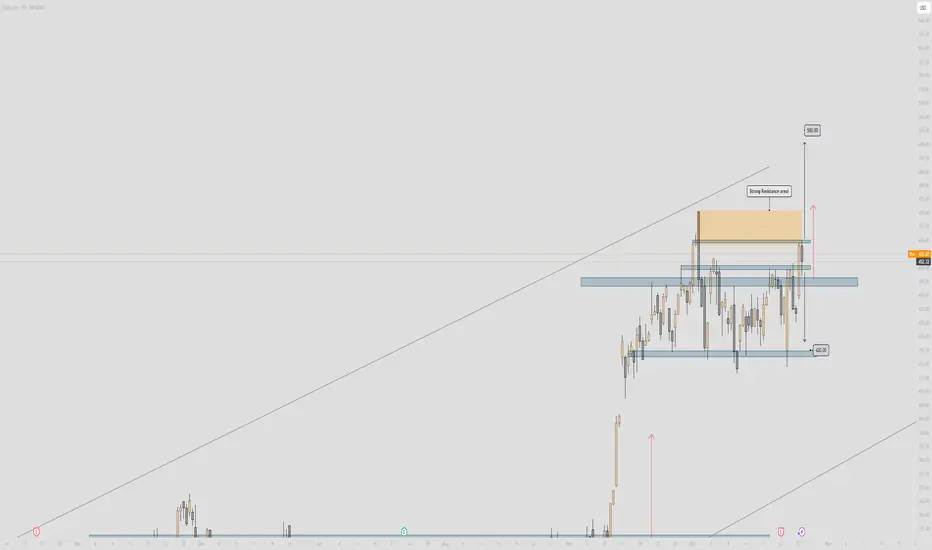
TSLA - Important!🔥 Tesla Analysis (Daily Structure) 🔥
Alright, let’s break this one down 👇
🧱 Structure Overview
Tesla’s price is currently hovering around $452, sitting right below a major resistance zone between $455 – $470 (highlighted in orange). This area has acted as a strong ceiling multiple times — every approach has been met with rejection pressure.
Below, the support floor sits clean around $420 – $425, which has been holding the range low for a while. We’re essentially trapped in a sideways consolidation box — a range between that $420 low and the $470 resistance cap.
🧭 Bias
Current structure = Neutral to Bearish
Price just wicked into resistance, showing signs of rejection. Unless we see strong follow-through above $470 with clean volume, this is likely a reaction zone for shorts.
💡 Key Zones
Resistance (Sell Zone): $455 – $470
Strong supply — expect sellers to defend this area.
Support (Buy Zone): $420 – $425
Range demand base — liquidity resting below.
🎯 Scenarios
Bearish Setup (Higher Probability for Now)
If Tesla fails to break and close above $470, look for a move back down to $420 — possibly a liquidity grab under the range. Confirmation would be bearish engulfing or a strong rejection candle from resistance.
Bullish Setup (Breakout Play)
If price cleanly closes above $470 and retests it as support, we could open the door toward $500 (measured move target). That’d be a breakout from the range and continuation of the larger bullish channel.
⚖️ Risk Management
Bears: Stop above $475 – $480
Bulls: Stop below $445 if entering after breakout retest
Keep R:R ≥ 1:2
🧠 Summary
Tesla’s in a tight range — smart money likely accumulating or distributing near these highs. Watch for rejection signs around $470 for short plays, or confirmation above it for the next leg to $500.
This is the make-or-break zone — the next move will define Tesla’s mid-term direction. ⚡️
(Apex Critical Metals Corp. | TSX: APXC) — Swing Trade 💰 APXC — Swing Trade Breakdown
(Apex Critical Metals Corp. | TSX: APXC)
🏢 Company Snapshot
Apex Critical Metals is a Canadian exploration company focused on rare earth elements (REE) and niobium, with projects in carbonatite and alkaline rock settings across Canada and the U.S. Recent acquisitions and exploration updates have sparked momentum as traders rotate into the critical minerals theme.
📊 Fundamentals
APXC is a pre-revenue explorer, so profitability metrics don’t apply. The company carries minimal debt, limited tangible book value, and negative free cash flow as it funds exploration. Market cap sits around CA$150–200 million. Like most juniors, it’s high-risk/high-reward — leverage is low, but dilution risk is high.
Summary: Early-stage speculative profile — clean balance sheet, no earnings, no dividend, pure exploration exposure.
📈 Trends & Catalysts
• Revenue Growth: N/A — still in exploration phase.
• EPS Trend: Negative — consistent losses, normal for juniors.
• Cash Flow: Declining; ongoing exploration expenses.
• Balance Sheet: Low debt, modest cash reserves — likely needs future financing.
• Catalysts:
– Upcoming exploration results and permit updates.
– Continued REE/niobium hype amid North American supply chain focus.
– Potential JV or strategic investment announcements.
• Risks: Dilution through equity raises, exploration risk, and volatile rare-earth pricing cycles.
🪙 Industry Overview
The rare-earth exploration space has been hot, with select juniors up hundreds of percent YTD. After a steep run, the group saw a 10% weekly pullback on profit-taking but remains up ~60% month-over-month and up 500%+ over 12 months. Sentiment is speculative but still constructive while commodity demand themes stay in focus.
📐 Technicals
• Current Price: CA$3.29
• 50-SMA: ≈ CA$2.50
• 200-SMA: ≈ CA$1.20
• RSI(2): 44.8 — neutral, post-pullback.
• Pattern: Breakout → consolidation; momentum cooling after a strong vertical run.
• Support: CA$2.80 – 3.00 (prior breakout area)
• Resistance: CA$4.50 – 5.00 (swing high zone)
• Volume: Well above historical averages — clear sign of accumulation earlier this month.
🎯 Trade Plan
Watching for an entry between CA$2.90–3.30, ideally on a low-volume pullback or consolidation near support.
Stop: CA$2.50–2.70 (below structural support).
Target: CA$4.50 (first major resistance).
R/R: ~2.5× potential if the setup holds.
Alternate setup — momentum continuation: a breakout above CA$4.00 on volume could confirm another leg higher.
🧠 My Take
APXC remains a high-beta, news-driven play tied to the critical minerals narrative. Technicals show a healthy consolidation after a massive speculative run, offering a possible second-leg swing if REE sentiment stays positive. I’m bullish for a short-term trade off support but keeping stops tight — failure to hold CA$2.80–3.00 would invalidate the setup and suggest momentum has dried up.

ETH Daily Technical Overview — Cycle & Box AnalysisCycle Structure:
HWC (Higher Wave Cycle – Long-Term): Bullish 🔼
MWC (Middle Wave Cycle – Mid-Term): Range 🔁
LWC (Lower Wave Cycle – Short-Term): Bearish 🔽
Market Context:
The first step is to assess the market from a cycle and wave perspective 🧐. Recent sharp down moves are ignored as they are emotional reactions.
The current support is a box 📦 that has been tested for around 35 days with four significant touches. My bias is long here 🚀.
Long Setup:
Weakness in the short-term MWC 🔁 could trigger a bullish move if 4232 resistance is broken and confirmed ✅.
The next resistance at 4757 🚧 could turn all cycles bullish 🔼🔼🔼 if broken, offering strong upside potential 📈.
Short Consideration:
The market is unpredictable ⚠️, so short scenarios should be considered too.
Until price reaches 3708 ⬇️, I won’t consider shorts ❌.
Shorts require more structure and confirmation.
Remember, downside moves are still possible ⚡, so risk management is key 🛡️.
📌 Signature:
If you want a specific coin analyzed, drop a comment 💬👇 and I’ll cover it.
⚠️ Without proper risk management, you're just a ticking time bomb 💣

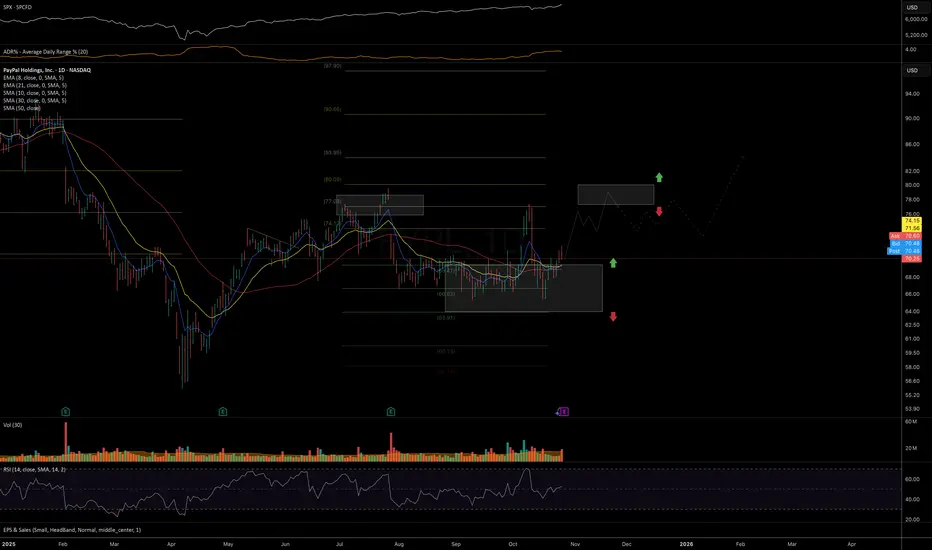
PYPL potential start of a new uptrendPrice may have completed its correction from the July highs and started the first wave of a new uptrend.
As long as the price continues to trade above 65, I expect upside momentum to persist toward the 80 resistance level, likely followed by a period of consolidation and base-building before a more sustainable breakout attempt in the coming months.
Chart:
Previously:
On mid-term resistance (Jul 24):
Chart:
www.tradingview.com
and (Jul 30):
Chart:
www.tradingview.com
On potential bottom (Sep 18):
Chart:
www.tradingview.com
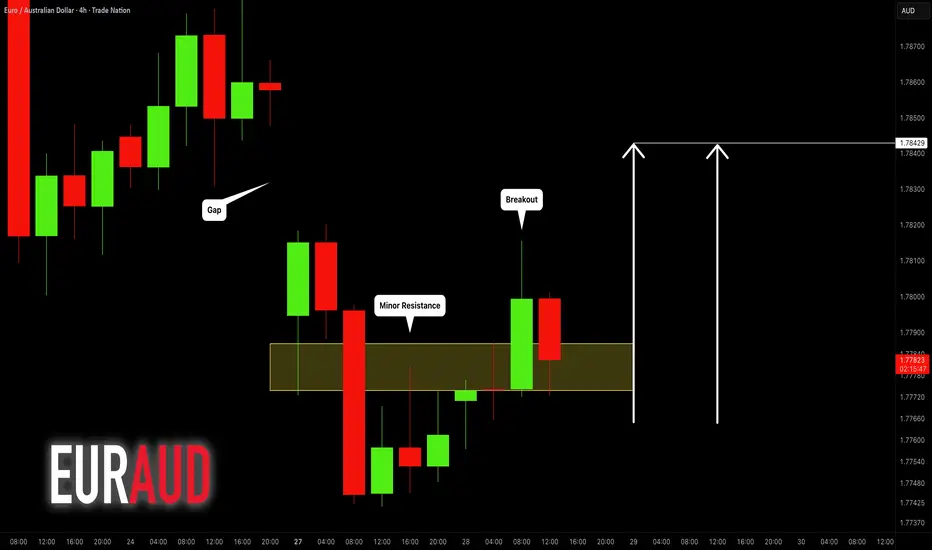
EURAUD: Time to Grow? 🇪🇺🇦🇺
EURAUD is going to fill a gap down opening soon.
I see a strong bullish confirmation with a breakout
of an intraday resistance on a 4H time frame.
Expect a rise at least to 1.482 level.
❤️Please, support my work with like, thank you!❤️
I am part of Trade Nation's Influencer program and receive a monthly fee for using their TradingView charts in my analysis.
USNAS100 | Retest Phase Before Next Bullish LegUSNAS100 – MARKET OVERVIEW | Bullish Bias With Possible Retest 🇺🇸
The NASDAQ 100 recorded a new all-time high, maintaining strong bullish pressure, especially while trading above 25,890.
Currently, the price appears to be entering a short-term retest phase toward 25,700 before resuming its upward momentum.
A confirmed 1H candle close above 25,890 will reinforce the bullish continuation, targeting 26,040 → 26,200.
However, if the index trades below 25,890, a technical correction toward 25,700 is likely.
To confirm a bearish trend, the price must stabilize below 25,660, opening the path toward 25,340.
Key Technical Levels
Pivot Line: 25,890
Support: 25,700 · 25,340
Resistance: 26,040 · 26,200
Outlook:
NASDAQ remains bullish above 25,890, but expect short-term volatility near record highs.
A daily close above 26,040 would signal renewed strength, while sustained trading below 25,660 could trigger a deeper correction phase.

NZDCAD SHORT Price action on this pair is signalling something!!!
Market structure bearish on HTFs DW
Entry at both Weekly and Daily
Weekly Rejection at AOi
Previous Weekly Rejection at AOi
Daily Rejection at AOi
Daily Rejection at AOi
Around Psychological Level 0.80500
Touching EMA H4
H4 Candlestick rejection
TP: WHO KNOWS!
Entry 100%
#early entry to be considered if price opens bullish on Monday and signals bearish sentiment
REMEMBER : Trading is a Game Of Probability
: Manage Your Risk
: Be Patient
: Every Moment Is Unique
: Rinse, Wash, Repeat!
: Christ is King.

THE KOG REPORTTHE KOG REPORT:
In last week’s KOG Report we said we would be looking at two levels as potential for the long trades and target for the short trades. We ideally wanted price to push upside and complete the long target before turning and then completing the short target. During the early part of the week, we activated short and gave caution on longs only to see the aggressive decline which hit our short target and completed our bias level and red box targets for the week.
All in all, a decent week in Camelot with Excalibur guiding and the EA hitting another full house of completed targets on Gold.
So, what can we expect in the week ahead?
We're pondering on this bearish move and it’s giving us hints of a swing low so for that reason we’ve given the red box bias level at 4095 which will need to break for us to see a continuation of the move. Above there, we have immediate support at 4104 which if held can give us another bounce in the early sessions giving us a move upside into the 4140-50 regions initially.
Above that level there is a level sticking out sitting at 4173 with the extension level 4192 which if targeted is the level to keep an eye on for us. A break above there and it’s likely we will attempt to swing high from a lot higher up which we will need to navigate level to level. But a RIP there would be ideal if it happens with a clean reversal.
On the flip, we do want to see lower pricing on gold as we feel it’s not only needed, but it will give buyers better opportunities to get in for better positioning to carry trades upside into the higher target levels we have active. As we approach the end of the month, it's going to be another whipsaw and we would hope to complete the move, or, we'll most likely see some sideways accumulation leading into the next week.
KOG’s bias for the week:
Bullish above 4095 with the ideal target 4274
Bearish below 4095 with the ideal target 4025
RED BOX TARGETS:
Break above 4115 for 4123, 4125 and 4140 in extension of the move
Break below 4095 for 4080, 4065 and 4050 in extension of the move
Please do support us by hitting the like button, leaving a comment, and giving us a follow. We’ve been doing this for a long time now providing traders with in-depth free analysis on Gold, so your likes and comments are very much appreciated.
As always, trade safe.
KOG

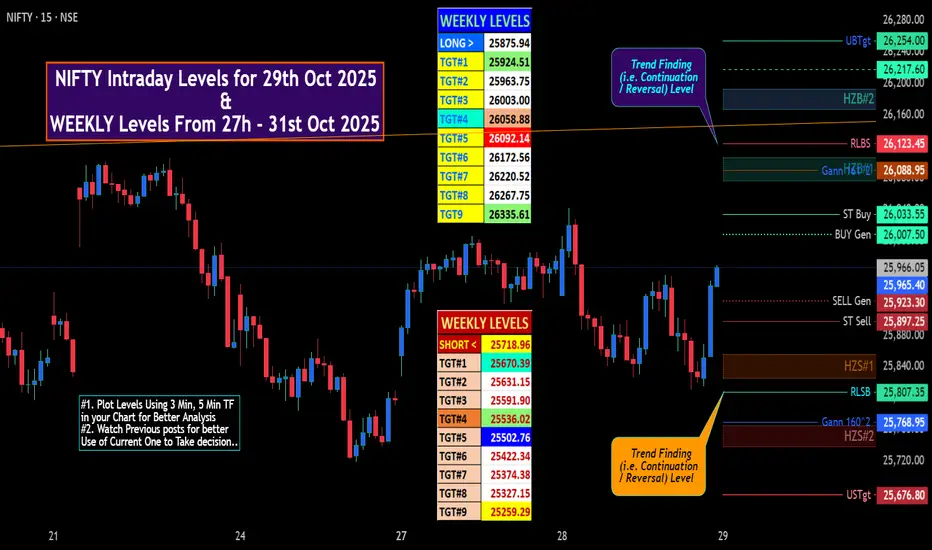
NIFTY IntraSwing Levels for 29th Oct 2025🚀 "WEEKLY Levels" mentioned in BOX format.
🌡️Plot Levels Using 3 Min, 5 Min Time frame in your Chart for Better Analysis
L#1: If the candle crossed & stays above the “Buy Gen”, it is treated / considered as Bullish bias.
L#2: Possibility / Probability of REVERSAL near RLBS & UBTgt
L#3: If the candle stays above “Sell Gen” but below “Buy Gen”, it is treated / considered as Sidewise. Aggressive Traders can take Long position near “Sell Gen” either retesting or crossed from Below & vice-versa i.e. can take Short position near “Buy Gen” either retesting or crossed downward from Above.
L#4: If the candle crossed & stays below the “Sell Gen”, it is treated / considered a Bearish bias.
L#5: Possibility / Probability of REVERSAL near RLSB & USTgt
HZB (Buy side) & HZS (Sell side) => Hurdle Zone,
*** Specialty of “HZB#1, HZB#2 HZS#1 & HZS#2” is Sidewise (behaviour in Nature)
Rest Plotted and Mentioned on Chart
Color code Used:
Green =. Positive bias.
Red =. Negative bias.
RED in Between Green means Trend Finder / Momentum Change
/ CYCLE Change and Vice Versa.
Notice One thing: HOW LEVELS are Working.
Use any Momentum Indicator / Oscillator or as you "USED to" to Take entry.
⚠️ DISCLAIMER:
The information, views, and ideas shared here are purely for educational and informational purposes only. They are not intended as investment advice or a recommendation to buy, sell, or hold any financial instruments. I am not a SEBI-registered financial adviser.
Trading and investing in the stock market involves risk, and you should do your own research and analysis. You are solely responsible for any decisions made based on this research.
"As HARD EARNED MONEY IS YOUR's, So DECISION SHOULD HAVE TO BE YOUR's".
Do comment if Helpful .
In depth Analysis will be added later (If time Permits)
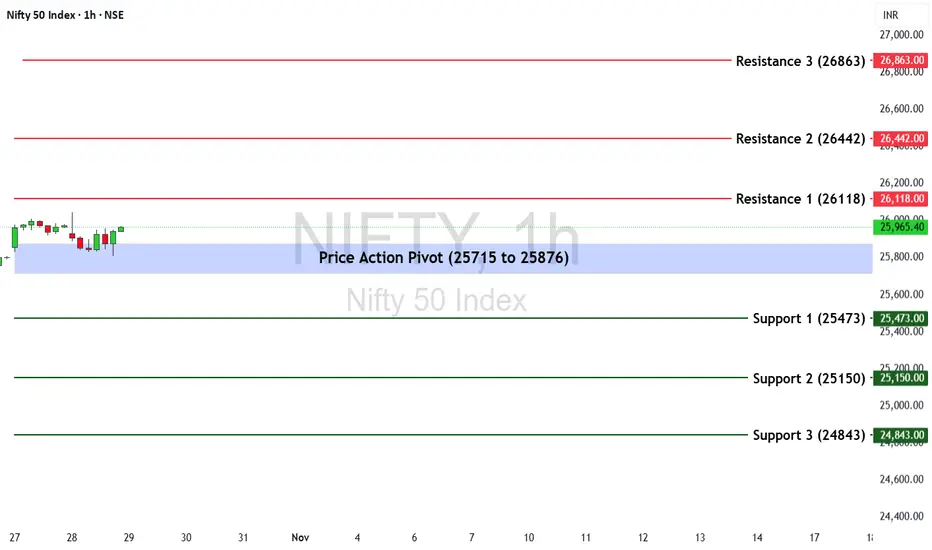
Nifty 50 Weekly Outlook (27th Oct – 31st Oct 2025)The Nifty 50 Index last week ended at 25,795.15, posting a +0.33% gain. The index continues to consolidate near recent highs, signaling a potential directional move in the upcoming week.
🔹 Key Levels for the Upcoming Week
📌 Price Action Pivot Zone:
25,715 to 25,876 – This blue-shaded zone represents the key decision area. Sustaining above this range may attract fresh buying interest, while a fall below could trigger mild profit booking.
🔻 Support Levels:
S1: 25,473
S2: 25,150
S3: 24,843
🔺 Resistance Levels:
R1: 26,118
R2: 26,442
R3: 26,863
📈 Market Outlook
Bullish Scenario:
If Nifty holds above 25,876, a breakout move could take the index toward R1 (26,118). Sustained strength above this level may open the path to R2 (26,442) and R3 (26,863) in the near term.
Bearish Scenario:
If the index slips below 25,715, short-term weakness could drag it toward S1 (25,473), followed by S2 (25,150) and S3 (24,843).
Disclaimer: aliceblueonline.com
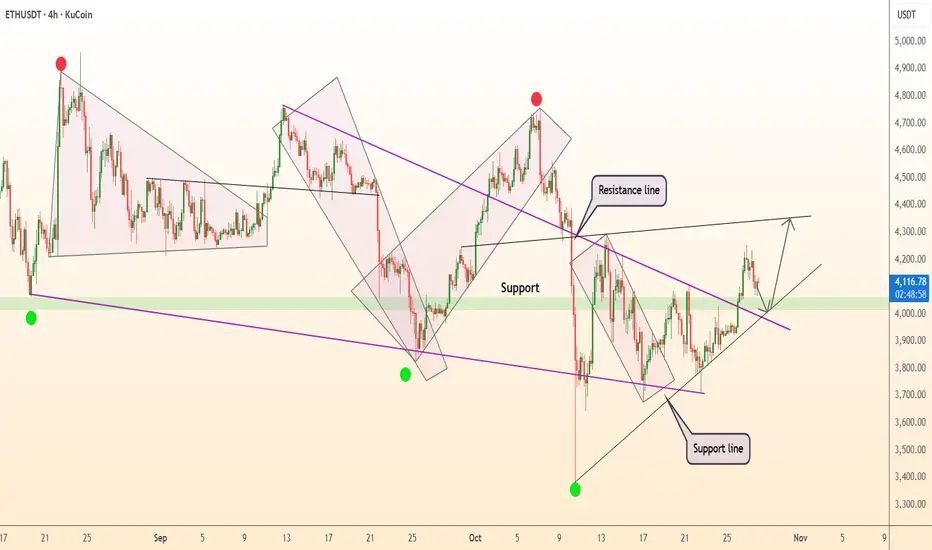
ETH Analysis (4H)After the heavy dump on altcoins, the market is still quite volatile. However, after several days and weeks of ranging, it’s gradually returning to normal and becoming more predictable for analysis.
Ethereum has formed a reversal pattern at the bottom and has made three higher lows. It’s expected to move toward the red zone while holding the green area, and then get rejected toward lower levels.
The best area for a long buy is the green box, and the best area for a short sell is the red box.
Let’s wait and see what happens next.
For risk management, please don't forget stop loss and capital management
When we reach the first target, save some profit and then change the stop to entry
Comment if you have any questions
Thank You

Can Nifty Turn Bullish After Today’s Sideways Breakdown?Today, the market broke the sideways range on the upside but soon faced rejection at resistance.
After that, it reversed sharply and broke the same sideways zone on the downside, showing clear intraday weakness.
Now, the key question is — was today’s move just a trap or a genuine shift in sentiment?
If Nifty holds above the lower range and buyers step in, we might see a short-term bullish recovery tomorrow.
If you liked this analysis, hit like, follow for daily Chart Talks, and share your thoughts below!
📈 Disclaimer: For educational purposes only, not a buy/sell recommendation.

S&P 500 looks Bearish Correction But Fed is Coming...SPX500 – Technical & Fundamental Overview
The index remains under bullish momentum, but a short-term correction toward 6838 from the pivot line at 6889 is possible before the next directional move.
Technical Outlook:
A 1H close below 6839 would confirm a bearish reversal, targeting 6769 as the next support.
However, a 1H close above 6889 would reinforce the bullish trend, paving the way toward 6941 and 6991 — with potential for a momentum-driven continuation if sentiment stays positive.
Pivot Line: 6889
Support Levels: 6840 · 6800 · 6769
Resistance Levels: 6940 · 6991
Fundamental Context:
Traders are positioning cautiously ahead of this week’s Trump–Xi trade talks, which could shape near-term market sentiment. Optimism over a potential U.S.–China tariff framework and expectations that the Federal Reserve may cut rates again are supporting risk appetite.
However, with indices at record highs and AI-related stocks heavily concentrated, any disappointment in the trade outcome or earnings results could spark a sharper downside reaction.
In short, bullish while above 6889, but watch for volatility driven by trade headlines and Fed signals in the coming sessions.

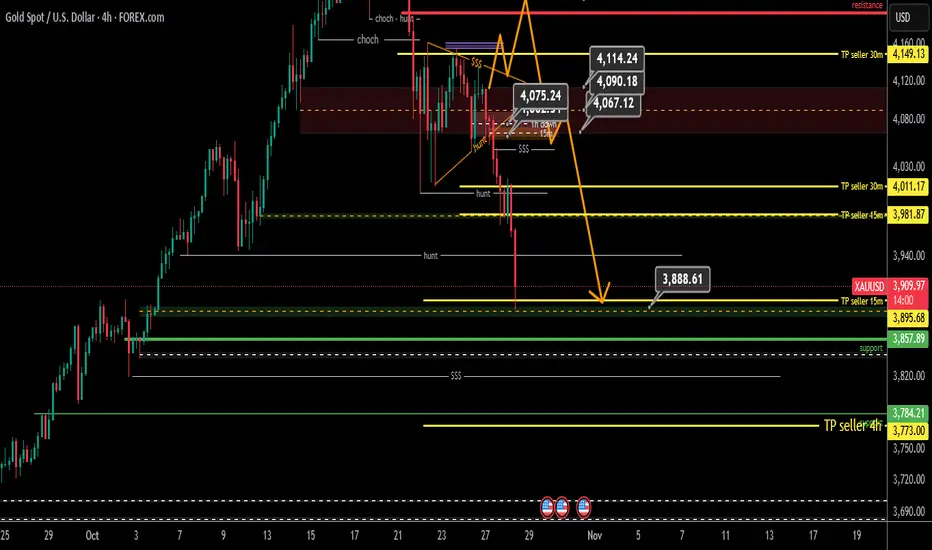
Update Two 4-Hour Gold Analysis
Hello Traders
So far, yesterday's analysis target has been touched, but the seller is still present in the market, and today the 4-hour seller entered the market, and the long-term 4-hour analysis that we had last week gained more strength, the 4-hour sellers target was defined as 3773, which was explained in the relevant post about the entry of sellers. So, every pullback will still have more sellers in the market. For the sell, all the yellow lines of the TPs settled by the candlestick failure act as current resistance and are considered the pullback zone.
Good luck.
Links to the two analyses:
BankNifty levels - Oct 29, 2025Utilizing the support and resistance levels of BankNifty, along with the 5-minute timeframe candlesticks and VWAP, can enhance the precision of trade entries and exits on or near these levels. It is crucial to recognize that these levels are not static, and they undergo alterations as market dynamics evolve.
The dashed lines on the chart indicate the reaction levels, serving as additional points of significance. Furthermore, take note of the response at the levels of the High, Low, and Close values from the day prior.
We trust that this information proves valuable to you.
* If you found the idea appealing, kindly tap the Boost icon located below the chart. We encourage you to share your thoughts and comments regarding it.
Wishing you successful trading endeavors!

Nifty levels - Oct 29, 2025Nifty support and resistance levels are valuable tools for making informed trading decisions, specifically when combined with the analysis of 5-minute timeframe candlesticks and VWAP. By closely monitoring these levels and observing the price movements within this timeframe, traders can enhance the accuracy of their entry and exit points. It is important to bear in mind that support and resistance levels are not fixed, and they can change over time as market conditions evolve.
The dashed lines on the chart indicate the reaction levels, serving as additional points of significance to consider. Furthermore, take note of the response at the levels of the High, Low, and Close values from the day prior.
We hope you find this information beneficial in your trading endeavors.
* If you found the idea appealing, kindly tap the Boost icon located below the chart. We encourage you to share your thoughts and comments regarding it.
Wishing you success in your trading activities!

THE KOG REPORT - UpdateEnd of day update from us here at KOG:
Interesting open on the markets with gaps all over the place. Gold managed to break below on the open then continuing to complete not only the red box targets but our Algo target as well. We would have liked higher to get in on this move, ideally we wanted 4055 during the NY Session but it wasn't to be. The move commenced and those that got in managed to bag themselves a decent trade short.
For now, due to another stretch on buyers, we would like to see where we close today. We have circled the potential play with a swing high looking like it will attempt the 4030 level while the red box below will need to break in order to continue to our long awaited target below.
As always, trade safe.
KOG

EURJPY - Looking To Sell Pullbacks In The Short TermH1 - Strong bearish move.
Bearish convergence.
No opposite signs.
Expecting bearish continuation after pullback until the strong resistance zone holds.
If you enjoy this idea, don’t forget to LIKE 👍, FOLLOW ✅, SHARE 🙌, and COMMENT ✍! Drop your thoughts and charts below to keep the discussion going. Your support helps keep this content free and reach more people! 🚀

$TAO 1hGETTEX:TAO 1H
Beautiful falling channel breakout forming right at key support with clear upside targets (T1–T3).
If CRYPTOCAP:BTC stays stable and continues to perform well, this setup could easily push higher toward resistance. 📈

DeGRAM | ETHUSD is above the support area📊 Technical Analysis
● ETH/USD broke above its descending resistance line and retested the 4,000 support zone, confirming a breakout from a medium-term accumulation structure.
● The price now targets 4,300 as the next resistance, with ascending channel dynamics supporting continued bullish momentum.
💡 Fundamental Analysis
● Ethereum gains traction amid rising DeFi activity and institutional accumulation, while stable macro sentiment boosts broader crypto risk appetite.
✨ Summary
● Long bias above 4,000; targets 4,300. Breakout confirmation and improving fundamentals support medium-term upside.
-------------------
Share your opinion in the comments and support the idea with a like. Thanks for your support!
USDCAD Faces Pressure as DXY Correction Nears Key Resistance!!Hey Traders, in today’s trading session we are monitoring USDCAD for a potential selling opportunity around the 1.40200 zone.
The pair remains in a broader downtrend and is currently in a correction phase, approaching the trendline and resistance area at 1.40200.
From a macro perspective, the US Dollar Index (DXY) is testing its 98.900 channel resistance, where upside momentum may fade amid a weakening U.S. labour market and rising expectations for a dovish shift from the Fed.
A potential DXY rejection from that level could amplify downside pressure on USDCAD, especially if oil continues to find demand and supports the Canadian Dollar.
Next move: Watching for bearish confirmation near 1.40200 for potential continuation of the broader downtrend.
💬 What’s your view on USDCAD and the Dollar outlook this week? Share your thoughts below!
