CRUDE OIL Bullish Breakout! Buy!
Hello,Traders!
CRUDE OIL price executed a clean SMC breakout above the descending trendline, shifting structure into bullish order-flow as liquidity above recent highs was taken and demand stepped in. Time Frame 10H.
Buy!
Comment and subscribe to help us grow!
Check out other forecasts below too!
Disclosure: I am part of Trade Nation's Influencer program and receive a monthly fee for using their TradingView charts in my analysis.
Support and Resistance

BTC/USD – Band Rejection + Gap Squeeze Play (Textbook Execution)Caught a clean 30m bullish band rejection on BTC/USD, aligned with a textbook gap-up squeeze setup. Price gapped above the lower Bollinger Band after a clear downtrend, forming a strong engulfing candle. Entry triggered on break of the rejection candle high at 89,276.
Trade Highlights:
- Entry: 89,276 (2 lots)
- Target 1: Midline (9 EMA) hit at 89,372 (+0.11%)
- Target 2: Upper Band hit at 89,672 (+0.44%)
- Stop: 89,044 (below rejection low)
- Result: Full 1:1 RR achieved on both lots
Setup Confluence:
- Lower band rejection with hammer
- Gap-up ≥ 1% with strong close
- X/Y band stretch> 1.6 confirms squeeze
- No opposite rejection before midline
Takeaway: A+ setup with high-probability structure and mechanical execution. Kill fast, ride smart.

SPY FREE SIGNAL|SHORT|
✅SPY price is reacting inside a major supply zone after a displacement shift, signaling downside intent as liquidity above has been swept. Favoring continuation lower as price seeks inefficiency fill.
—————————
Entry: 686.84$
Stop Loss: 690.00$
Take Profit: 682.00$
Time Frame: 4H
—————————
SHORT🔥
✅Like and subscribe to never miss a new idea!✅

AUD-USD Bullish Continuation Expected! Buy!
Hello,Traders!
AUDUSD taps into the reclaimed demand zone, showing a clean breakout and bullish displacement. Price is likely to retest the broken structure before expanding toward the target level. Time Frame 7H.
Buy!
Comment and subscribe to help us grow!
Check out other forecasts below too!
Disclosure: I am part of Trade Nation's Influencer program and receive a monthly fee for using their TradingView charts in my analysis.

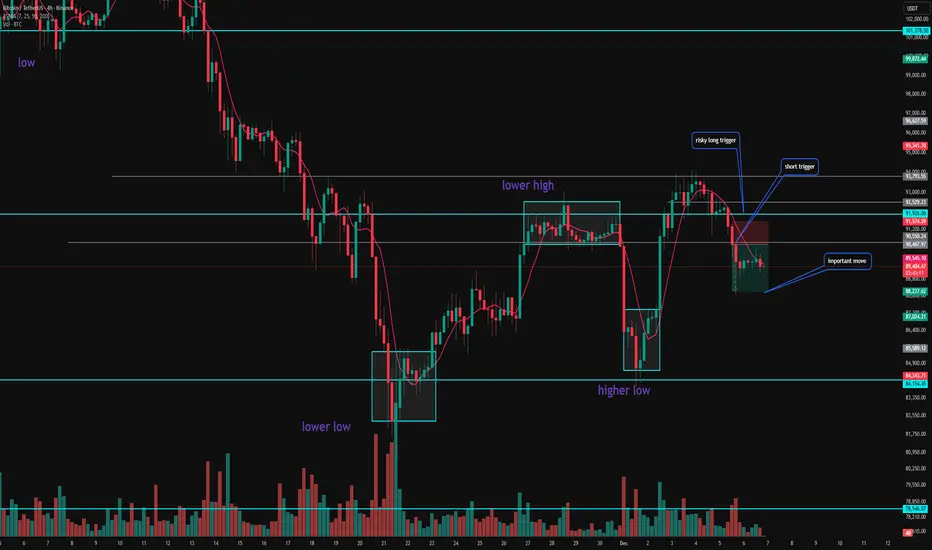
Bitcoin Analysis — Navigating December’s Uncertainty Fear & Greed Index: 21 — still in Fear.
📰 Market Overview
As mentioned in my previous analyses, the short entry trigger played out perfectly.
I personally opened a short on STX, and the trade has now closed at 2R profit. ✔️
So… what now?
To answer that, we need to double-check the trend analysis and evaluate where buyers and sellers currently stand.
📉 Understanding the Current Trend
If you’ve been following my earlier posts, you already know how important it is to watch:
Candle shapes
Volume in bullish vs bearish legs
Where buyers actually step in
And how strongly they can push the market upward
We entered shorts because:
The daily structure is still bearish,
Sellers still control the larger trend,
And the first real signs of buyer weakness appeared — exactly what we waited for.
Now we need to analyze this downward leg in detail:
❓ Key Questions to Ask
Will this drop reach $84,000, the previous major low?
If it reaches that level, will it break?
Will this bearish leg be stronger or weaker than the previous one?
Or… will we fail early and enter a December range?
Your answers to these questions decide your trading plan.
🟦 Scenario 1: December Range (No Man’s Land)
If Bitcoin can’t reach $84k and instead starts moving sideways above it,
this entire region becomes No Man’s Land — no clear control by buyers or sellers.
If that happens, we may spend all of December ranging here.
➡️ Long-term positions would NOT make sense in this scenario.
🔻 Scenario 2: Breakdown Toward $84,000
If price continues downward and reaches $84,000,
shorting becomes extremely important — but entering directly at a major support is always tricky.
My advice:
If you’ve made decent profit recently,
💡 hold one short position without full take-profit,
or set your stop to breakeven once your trade hits your desired R:R.
Because if $84k breaks, panic can accelerate fast —
and we may see some very unusual numbers on the downside.
🎯 Short Entry Plan
Right now, the 4H timeframe does not yet have a clean structure for a new short entry.
But likely around 1 UTC, U.S. session volume will enter the market,
and the structure may become clear enough for a proper short trigger.
🚀 Scenario 3: Bullish Reversal
If sellers show weakness and buyers regain control:
Long Trigger: $91,900
But I need at least one 1H reaction to form a structure
so I can place a reliable stop-loss.
No reaction = no long.
✅ Final Notes
Thanks for reading my analysis — I appreciate every one of you!
Remember:
💛 Risk management is what keeps you alive in the market.
If you enjoy these daily updates, feel free to follow —
I share exactly what I’m doing in the market every day.
Stay safe, stay profitable, and have an amazing trading day! 🚀📊
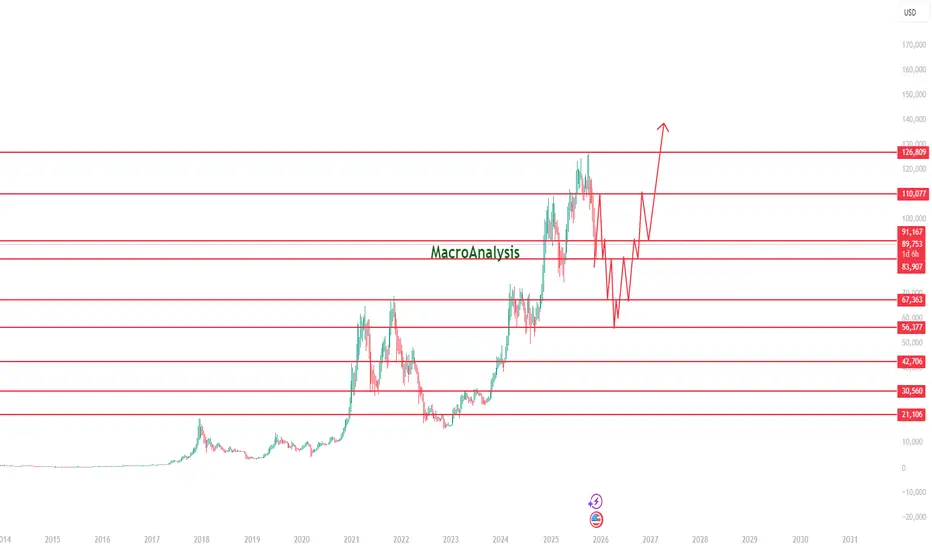
BTC Macro Roadmap: Multi-Year Support/Resistance Structure & ProThis chart presents a long-term BTC roadmap based on major weekly and monthly support/resistance zones, reflecting how BTC typically behaves during mid-cycle phases. Price has recently reacted to the 110K macro resistance, triggering a corrective leg that fits the broader rhythm of previous BTC cycles.
The projected path highlights a realistic multi-stage structure:
• Mid-Cycle Corrective Phase
BTC is forming lower highs and lower lows after the rejection from 110K, with a likely retest of key demand zones between 83K → 67K. Deeper liquidity sweeps into the 56K region remain possible before establishing a macro higher low.
• Accumulation Zone
Inside this lower region, BTC historically creates sideways, choppy movement—sweeping liquidity both directions as market participants reposition. This mirrors prior mid-cycle accumulation phases and sets the foundation for the next macro advance.
• Recovery Phase & Re-Accumulation
Once accumulation stabilizes, structure favors a recovery back toward 91K → 110K, driven by regained momentum and market strength. A successful breakout from this zone signals the beginning of the next expansion wave.
• Macro Expansion Phase
Clearing 110K opens the door toward 126K–140K, the next major macro resistance region and potential cycle extension target.
This idea isn’t a prediction—it’s a structural map, focused on how BTC historically behaves around cycle midpoints: parabolic advance → correction → accumulation → breakout → expansion. The chart emphasizes market memory, key levels, and BTC’s typical volatility during expansion phases.
Macro Levels to Watch:
• 110,077 – major resistance, recent rejection zone
• 91,167 / 89,688 – mid-level pivot controlling short-term direction
• 83,907 – key support that preserves bullish structure
• 67,363 – strong historical demand and liquidity magnet
• 126,809 – next major resistance above ATH
BTCUSD Analysis bearish view.Chart Analysis Summary (BTCUSD – 1H)
BTC is currently reacting from a supply zone after forming a clear CHOCH at the top. The structure shows a bearish shift with multiple BOS confirmations on the way down. Price is now retesting the supply zone and has also broken below the minor trendline.
If the retest holds, a continuation to the downside is likely. The next key downside target is the support zone around 87,500. A break below this level can open the move toward the TP area near 85,000.
Overall, the market is showing a bearish structure unless price breaks back above the supply zone and invalidates the recent CHOCH.

Silver and Gold Flag and Pole PatternBoth Silver and Gold are forming Flag and pole pattern on charts. If the breakout sustains and prices go higher with support of relatively higher volumes, both commodities can achieve higher prices in near term. The momentum is currently on bulls side in both commodities but silver has more relative strength than gold. So watch both commodities for breakout.

Walmart Is Approaching a Breakout Zone — Major Move Ahead?Walmart is currently testing a major long-term ascending resistance line around 115–117 USD. This zone has rejected price multiple times, making it a crucial decision point. Momentum is bullish, but the trendline remains the main barrier.
Targets
Bullish Target (If breakout holds)
• 1st Target: 122 USD
• 2nd Target: 125 USD
Bearish Target (If rejection occurs)
• 1st Support: 112 USD
• 2nd Support: 105 USD
Stop-Loss
• For Long Positions: Below 111 USD (loss of structure)
• For Short Positions: Above 118 USD (confirmed breakout)
Mini Fundamental Analysis
• Walmart continues to benefit from strong consumer demand, especially in essential goods.
• The company is aggressively expanding into e-commerce, improving margins and market share.
• Recent earnings showed steady revenue growth and strong performance in grocery and online sales.
• Fundamentally, WMT remains defensive, stable, and resilient, which supports long-term upside.
Final Summary
Walmart is at a critical breakout zone.
• A clean break above 117 opens the way to 122–125.
• A rejection triggers a drop toward 112 or even 105.
Trend and fundamentals favor bullish continuation, but price must confirm the breakout.

EURCAD: Bearish Rally Continues 🇪🇺🇨🇦
EURCAD turned strongly bearish on Friday.
The price broke and closed below a significant daily support cluster.
There is a high probability that the market will continue falling next week.
Next support - 1.6047
❤️Please, support my work with like, thank you!❤️
I am part of Trade Nation's Influencer program and receive a monthly fee for using their TradingView charts in my analysis.

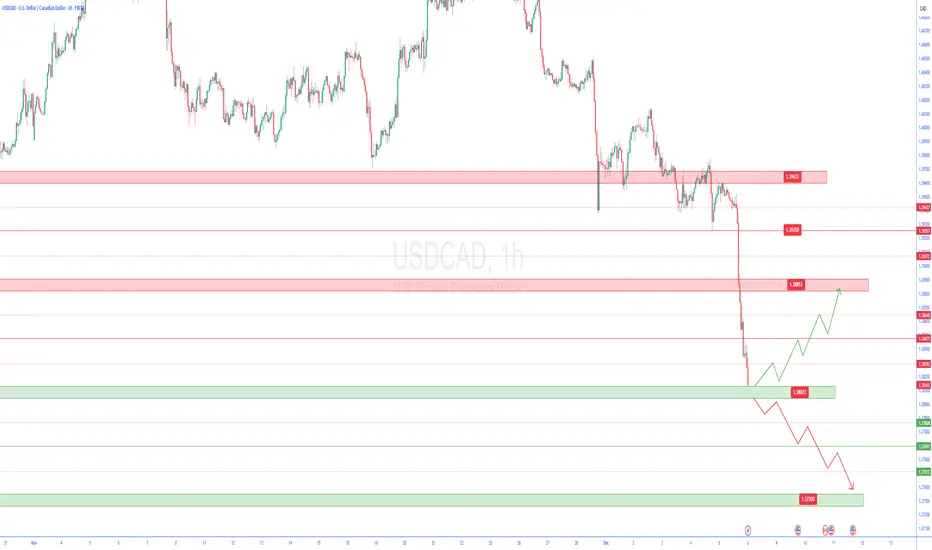
usdcad 1h🔹 Overall Outlook and Potential Price Movements
In the charts above, we have outlined the overall outlook and possible price movement paths.
As shown, each analysis highlights a key support or resistance zone near the current market price. The market’s reaction to these zones — whether a breakout or rejection — will likely determine the next direction of the price toward the specified levels.
⚠️ Important Note:
The purpose of these trading perspectives is to identify key upcoming price levels and assess potential market reactions. The provided analyses are not trading signals in any way.
✅ Recommendation for Use:
To make effective use of these analyses, it is advised to manually draw the marked zones on your chart. Then, on the 5-minute time frame, monitor the candlestick behavior and look for valid entry triggers before making any trading decisions.
eurusd 1h🔹 Overall Outlook and Potential Price Movements
In the charts above, we have outlined the overall outlook and possible price movement paths.
As shown, each analysis highlights a key support or resistance zone near the current market price. The market’s reaction to these zones — whether a breakout or rejection — will likely determine the next direction of the price toward the specified levels.
⚠️ Important Note:
The purpose of these trading perspectives is to identify key upcoming price levels and assess potential market reactions. The provided analyses are not trading signals in any way.
✅ Recommendation for Use:
To make effective use of these analyses, it is advised to manually draw the marked zones on your chart. Then, on the 5-minute time frame, monitor the candlestick behavior and look for valid entry triggers before making any trading decisions.

gbpusd 1h🔹 Overall Outlook and Potential Price Movements
In the charts above, we have outlined the overall outlook and possible price movement paths.
As shown, each analysis highlights a key support or resistance zone near the current market price. The market’s reaction to these zones — whether a breakout or rejection — will likely determine the next direction of the price toward the specified levels.
⚠️ Important Note:
The purpose of these trading perspectives is to identify key upcoming price levels and assess potential market reactions. The provided analyses are not trading signals in any way.
✅ Recommendation for Use:
To make effective use of these analyses, it is advised to manually draw the marked zones on your chart. Then, on the 5-minute time frame, monitor the candlestick behavior and look for valid entry triggers before making any trading decisions.

nas100 1h🔹 Overall Outlook and Potential Price Movements
In the charts above, we have outlined the overall outlook and possible price movement paths.
As shown, each analysis highlights a key support or resistance zone near the current market price. The market’s reaction to these zones — whether a breakout or rejection — will likely determine the next direction of the price toward the specified levels.
⚠️ Important Note:
The purpose of these trading perspectives is to identify key upcoming price levels and assess potential market reactions. The provided analyses are not trading signals in any way.
✅ Recommendation for Use:
To make effective use of these analyses, it is advised to manually draw the marked zones on your chart. Then, on the 5-minute time frame, monitor the candlestick behavior and look for valid entry triggers before making any trading decisions.

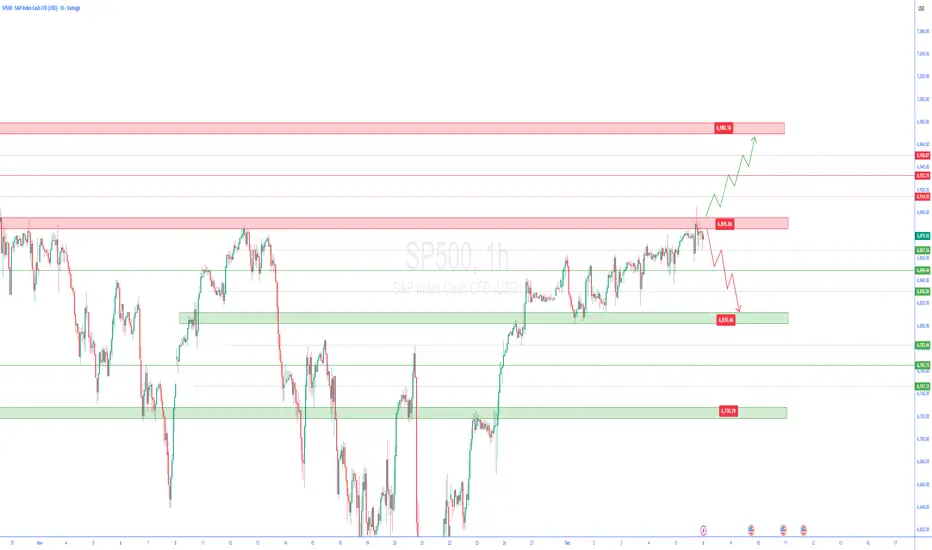
sp500 1h🔹 Overall Outlook and Potential Price Movements
In the charts above, we have outlined the overall outlook and possible price movement paths.
As shown, each analysis highlights a key support or resistance zone near the current market price. The market’s reaction to these zones — whether a breakout or rejection — will likely determine the next direction of the price toward the specified levels.
⚠️ Important Note:
The purpose of these trading perspectives is to identify key upcoming price levels and assess potential market reactions. The provided analyses are not trading signals in any way.
✅ Recommendation for Use:
To make effective use of these analyses, it is advised to manually draw the marked zones on your chart. Then, on the 5-minute time frame, monitor the candlestick behavior and look for valid entry triggers before making any trading decisions.
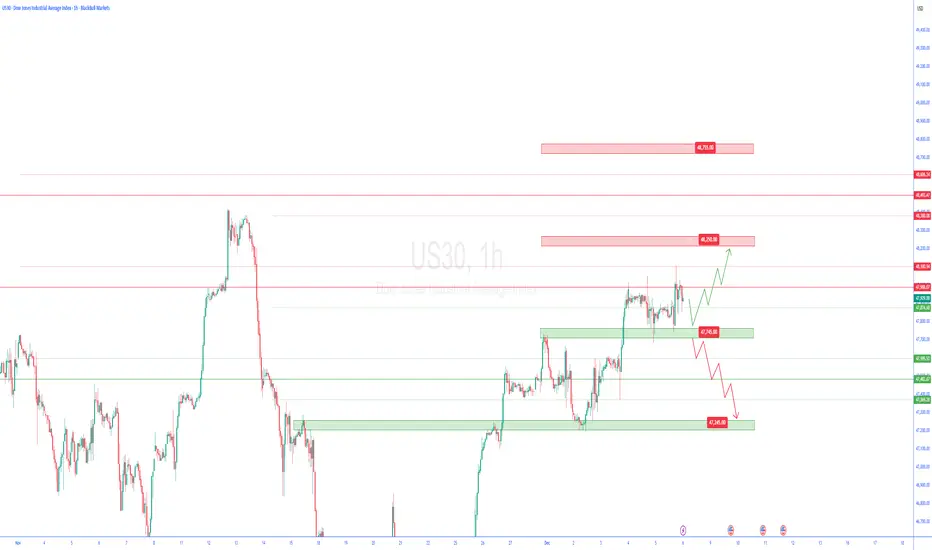
us30 1h🔹 Overall Outlook and Potential Price Movements
In the charts above, we have outlined the overall outlook and possible price movement paths.
As shown, each analysis highlights a key support or resistance zone near the current market price. The market’s reaction to these zones — whether a breakout or rejection — will likely determine the next direction of the price toward the specified levels.
⚠️ Important Note:
The purpose of these trading perspectives is to identify key upcoming price levels and assess potential market reactions. The provided analyses are not trading signals in any way.
✅ Recommendation for Use:
To make effective use of these analyses, it is advised to manually draw the marked zones on your chart. Then, on the 5-minute time frame, monitor the candlestick behavior and look for valid entry triggers before making any trading decisions.
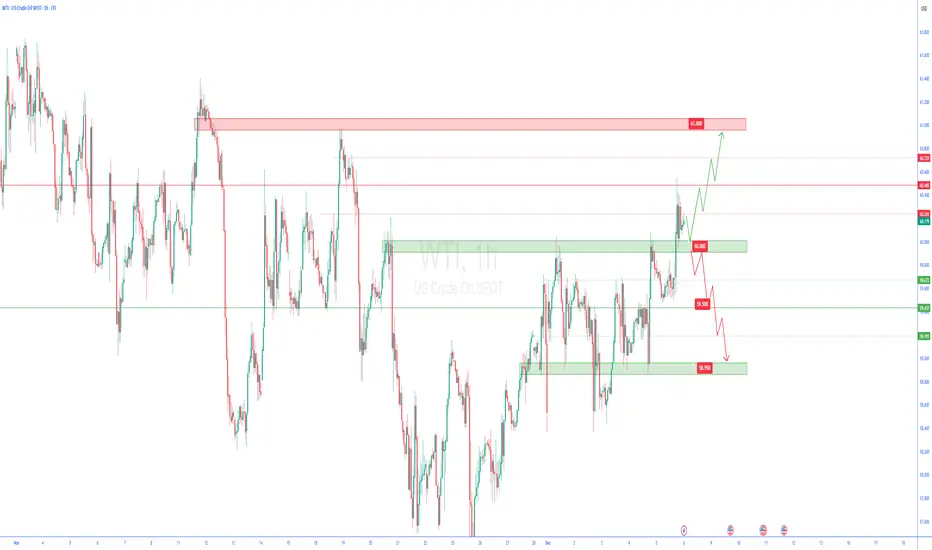
wti 1h🔹 Overall Outlook and Potential Price Movements
In the charts above, we have outlined the overall outlook and possible price movement paths.
As shown, each analysis highlights a key support or resistance zone near the current market price. The market’s reaction to these zones — whether a breakout or rejection — will likely determine the next direction of the price toward the specified levels.
⚠️ Important Note:
The purpose of these trading perspectives is to identify key upcoming price levels and assess potential market reactions. The provided analyses are not trading signals in any way.
✅ Recommendation for Use:
To make effective use of these analyses, it is advised to manually draw the marked zones on your chart. Then, on the 5-minute time frame, monitor the candlestick behavior and look for valid entry triggers before making any trading decisions.
xagusd 1h🔹 Overall Outlook and Potential Price Movements
In the charts above, we have outlined the overall outlook and possible price movement paths.
As shown, each analysis highlights a key support or resistance zone near the current market price. The market’s reaction to these zones — whether a breakout or rejection — will likely determine the next direction of the price toward the specified levels.
⚠️ Important Note:
The purpose of these trading perspectives is to identify key upcoming price levels and assess potential market reactions. The provided analyses are not trading signals in any way.
✅ Recommendation for Use:
To make effective use of these analyses, it is advised to manually draw the marked zones on your chart. Then, on the 5-minute time frame, monitor the candlestick behavior and look for valid entry triggers before making any trading decisions.

dxy 1h🔹 Overall Outlook and Potential Price Movements
In the charts above, we have outlined the overall outlook and possible price movement paths.
As shown, each analysis highlights a key support or resistance zone near the current market price. The market’s reaction to these zones — whether a breakout or rejection — will likely determine the next direction of the price toward the specified levels.
⚠️ Important Note:
The purpose of these trading perspectives is to identify key upcoming price levels and assess potential market reactions. The provided analyses are not trading signals in any way.
✅ Recommendation for Use:
To make effective use of these analyses, it is advised to manually draw the marked zones on your chart. Then, on the 5-minute time frame, monitor the candlestick behavior and look for valid entry triggers before making any trading decisions.

xauusd 1h🔹 Overall Outlook and Potential Price Movements
In the charts above, we have outlined the overall outlook and possible price movement paths.
As shown, each analysis highlights a key support or resistance zone near the current market price. The market’s reaction to these zones — whether a breakout or rejection — will likely determine the next direction of the price toward the specified levels.
⚠️ Important Note:
The purpose of these trading perspectives is to identify key upcoming price levels and assess potential market reactions. The provided analyses are not trading signals in any way.
✅ Recommendation for Use:
To make effective use of these analyses, it is advised to manually draw the marked zones on your chart. Then, on the 5-minute time frame, monitor the candlestick behavior and look for valid entry triggers before making any trading decisions.

Bitcoin is standing at the edge… Next move?The market held its breath as Bitcoin crashed straight into the green major support zone around 80,000 USD — and once again, buyers stepped in. Exactly where they were expected. The bounce is here. But the real question is not if we bounce…
It’s whether this is only a breath of relief — or the ignition of the next major rally.
🔥 The Battlefield Levels
✅ 80,000 USD – The Line in the Sand
This level stopped the sell-off for now see this level. Lose it — and the market could collapse fast.
🎯 94,200 USD – First Gate to Freedom (+4.7%)
Breaking this would confirm that buyers are back in control.
🎯 106,996 USD – Momentum Zone (+13.3%)
Here the trend structure starts to turn bullish again.
🎯 116,219 USD – Heavy Supply Level (+8.9%)
This is where many rallies have died before.
🚀 126,387 USD – The Final Boss
Above this level, Bitcoin enters price discovery mode toward new all-time highs.
📉 RSI & Volatility Signal Something is About to Happen
The RSI is deeply oversold and curling up, a pattern that historically preceded powerful upside moves.
At the same time, Bitcoin touched the lower Bollinger Band and bounced, often the birthplace of explosive volatility.
The market is compressed.
Pressure is building.
A big move is loading.
⏳ Time Is Also Speaking
More than 390 days have passed since the last structural bottom. In past cycles, this timing often marked the transition into a new impulsive phase. Bitcoin is not just at a price level — it’s at a cycle decision point.
⚠️ Two Futures From Here
🟢 Bullish Path:
80K holds.
Break above 94K confirms strength.
Targets: 106K → 116K → 126K
Above 126K = new all-time highs loading…
🔴 Bearish Path:
80K fails.
Liquidity vacuum opens.
Next stop: 70K – 65K
Current bounce = trap.
Final Words
This is not a random level.
This is where trends are born — or where they die.
Bitcoin has made its first move.
Now the market must decide:
Rally continuation… or deeper correction.
The next candles will write the story.

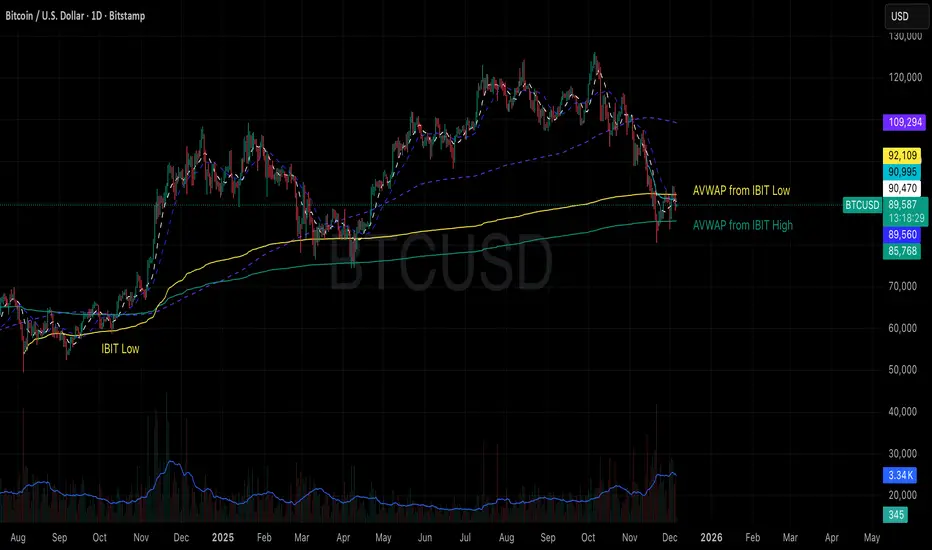
Is BTC near the bottom?Thesis is that institutional money started accumulating after the launch of IBIT. Assume since the launch of IBIT, many buyers are dollar cost averaging in. Anchor VWAP (AVWAP) since IBIT launch has served as support during both liberation day sell off and the recent capitulation in November which is roughly around $85k. Does this mean we are near the bottom or are the bears right that we have more room to dip?
BTCUSD —Retracement Into 4H Demand Before Next Leg UpI’m expecting Bitcoin to complete a healthy retracement before continuing its bullish structure. Price has created a clear higher high on the daily timeframe, and the current slowdown suggests sellers are stepping in temporarily — which is normal after an extended move.
4H Demand Zone (My Entry Area)
I’m watching the 4H demand zone at 86,187 – 87,172.
This zone is:
• Fresh and unmitigated
• Origin of a strong bullish displacement
• Formed after a liquidity sweep and impulsive move up
This makes it a high-probability area for a bullish reaction.
Expectation
I expect BTC to pull back into the demand zone, fill inefficiency, and then continue the uptrend.
Target
My target is the next resistance level around 98,000, which was previously a major support area.
