Gold Hits Buy Zone – Wait! Here's What to Confirm…◆ Market Context
On the M30 chart, the market shows a shift from a downtrend to a short-term recovery phase after forming BOS and CHoCH at the nearest bottoms. However, the upward movement has hit a prolonged downtrend line and reacted sharply downward again. This indicates that the trendline and upper resistance zone still maintain significant selling pressure.
◆ SMC & Price Action
• After breaking the upward BOS, the price made a strong push to 4,219 but couldn't sustain it, forming a downward reaction at the trendline and resistance zone.
• The Resistance Zone 4,211 – 4,219 has been confirmed by multiple price rejections.
• Currently, the market is adjusting to the Buy Support – Fibo – iFvG zone around 4,192. This is the first short-term support zone to test the buying momentum.
• If this zone doesn't hold, the price may return to the deeper liquidity zone 4,173 – where a large number of buyers' stop-losses are concentrated.
◆ Important Price Zones
Resistance (selling zone):
• 4,211
• 4,219
Short-term support:
• 4,192 (Fibo + iFvG + small OB)
Deeper support – Liquidity Pool:
• 4,173 (target zone if 4,192 support is broken)
◆ Main Trading Scenarios
➤ Scenario 1: Price holds at 4,192
• Wait for reversal signals at the support zone
• Recovery targets:
▪ 4,211
▪ 4,219
• If 4,219 is broken → the price may extend to a higher zone, but there is currently no confirmation signal for this.
➤ Scenario 2: Price breaks 4,192 support
• Short-term upward structure invalidated
• Prioritize following the downtrend
• Next targets:
▪ 4,173
▪ monitor liquidity reactions in this area to identify subsequent buying opportunities
➤ Scenario 3: Retrace to resistance for further selling
If the price retraces to 4,211 – 4,219 but doesn't break:
• Monitor rejection patterns
• This is a suitable zone to continue the downward movement following the main flow
◆ Summary
• The main trend still leans towards a decline, with the downtrend line in control.
• The 4,192 zone is a crucial reaction point to determine if buyers still have enough strength.
• If 4,192 is lost, the market is likely to seek liquidity at 4,173.
• If 4,192 holds, the price may recover to 4,211 – 4,219 before determining the next direction.
Support and Resistance

GOLD | Bullish Structure Holds After Fed Cut, with correctionalGOLD – Technical Overview
Gold prices are rising after the Federal Reserve delivered a widely expected 25 bps rate cut, even though policymakers offered little clarity on the 2025 policy path.
Despite uncertainty, safe-haven demand, strong central-bank buying, and surging ETF inflows have pushed both gold and silver toward what could be their strongest annual performance since 1979.
Gold is up more than 60% this year, while silver has more than doubled.
Technical Analysis
Gold remains in a bullish structure while trading above 4198, with upside targets at:
→ 4225 → 4237 → 4255 (extended bullish continuation)
A retest of 4198 remains possible before the next move higher.
Above 4198: bullish trend intact, continuation expected
Below 4198 (1H close): bearish momentum activates, opening a deeper correction toward 4152
Pivot Line: 4218
Support: 4198 · 4152
Resistance: 4237 · 4255

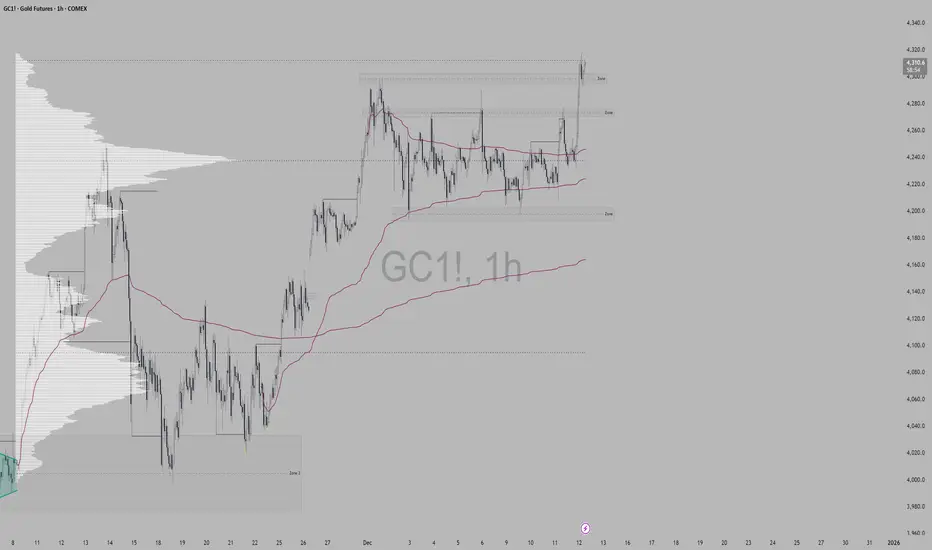
GOLD Consolidation bullish testing the upper momentumGold market has been moving within a broad ascending trend channel, recently break the resistance and could move to upside if the price maintain that range we could expect price growth further.
Recently, price broke out strongly to the upside, creating a bullish momentum shift. After clearing the upper trendline, gold pushed into a higher resistance zone highlighted on the chart. The candles show a steep upward move, followed by a projected pullback and continuation pattern illustrated with white arrows.
Gold has been in consolidation, but the recent breakout signals bullish continuation. If price holds above the 4,305–4,332 region, further growth is possible. However, a drop below 4,260 test the support then again price growth to upside.
Overall, the chart illustrates a bullish breakout, a potential retest of the trendline, and an anticipated continuation toward upper resistance targets.
You may find more details in the chart,
Trade wisely best of luck buddies.
Ps: Support with like and comments for better analysis thanks for supporting.

S&P500 INDEX (US500): Bullish Move After Trap
I see a confirmed liquidity grab after a test of a major
intraday demand zone on US500.
An occurrence of a buying imbalance afterward
suggests a strong bullish pressure.
I expect a rise at least to 6875
❤️Please, support my work with like, thank you!❤️
I am part of Trade Nation's Influencer program and receive a monthly fee for using their TradingView charts in my analysis.

USDJPY: Move Up Confirmed?! 🇺🇸🇯🇵
USDJPY will likely bounce from the underlined intraday support.
A formation of a bullish engulfing candle confirms a buying
imbalance after its test.
The price will rise at least to 156.54
❤️Please, support my work with like, thank you!❤️
I am part of Trade Nation's Influencer program and receive a monthly fee for using their TradingView charts in my analysis.

BAKEUSDT another 2x at least is cookingAs observed on the chart, the price is currently testing a major daily support level, which has already catalyzed a strong rebound. The initial move, resulting in approximately 100% appreciation and supported by notably high trading volume, indicates substantial buying interest and validates the strength of this support zone.
Given this confirmed momentum and volume-backed conviction, the technical structure now suggests the potential for further appreciation. A sustained move from this level could project an additional 100% to 200% gain, provided the asset maintains its current momentum and the support zone continues to hold.
DISCLAIMER: ((trade based on your own decision))
<<press like👍 if you enjoy💚

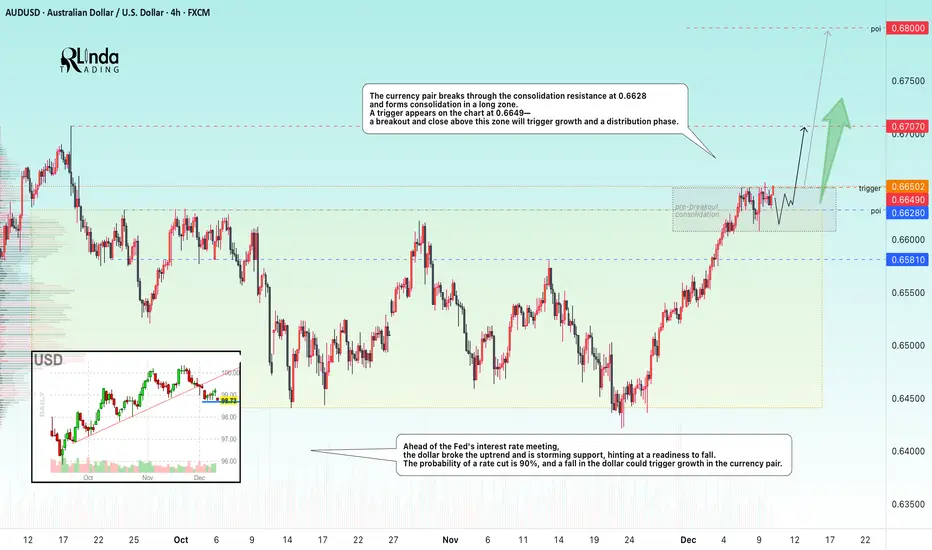
AUDUSD → Readiness for distribution within the uptrend FX:AUDUSD breaks through the resistance of a wide trading range (consolidation) and is preparing for growth. Important news ahead...
Ahead of the Fed's interest rate meeting, the dollar broke its upward trend and is storming support, hinting at a readiness to fall. The probability of a rate cut is 90%, and a fall in the dollar could trigger growth in the currency pair.
The currency pair is breaking through the consolidation resistance at 0.6628 and forming consolidation in a long zone. A trigger of 0.6649 appears on the chart - a breakout and close above this zone will trigger growth and a distribution phase.
Resistance levels: 0.6649, 0.67, 0.68
Support levels: 0.6628, 0.6581
Before rising, the price may test support (the previously broken trading range boundary). However, a breakout and close above 0.6649 could trigger a distribution phase towards 0.67-0.68, especially against the backdrop of a weak dollar...
Best regards, R. Linda!
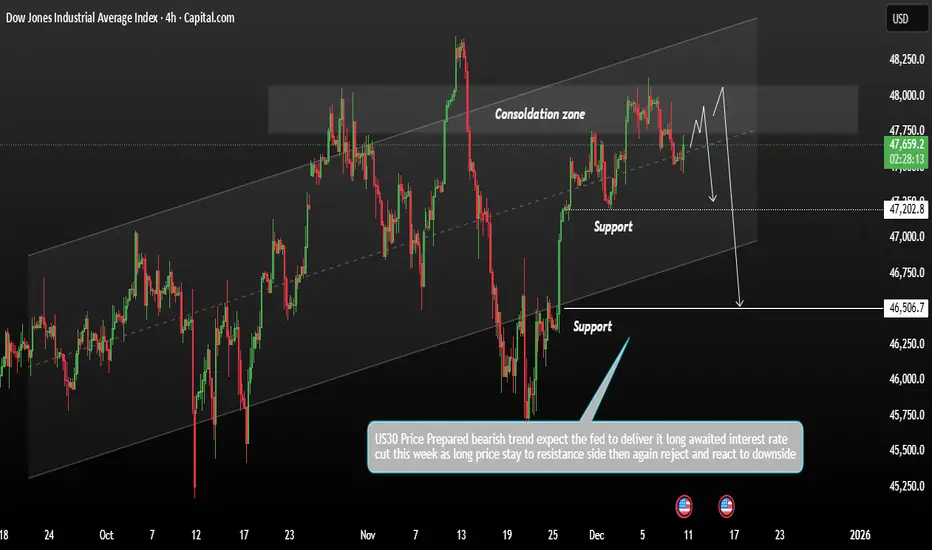
US3O Price Consolidation within its broader bearish momentumUS30 remains in a consolidation phase within its broader bearish trend. After failing to break down convincingly, price may retest overhead resistance before determining the next direction.
Technically Wall Street futures edged slightly higher as traders positioned themselves ahead of one of the most closely watched and divisive upcoming Federal Reserve meetings. Despite this temporary lift, technical structure still favours the bears.
US30 continues to show signs of weakening momentum, and as long as price remains below key resistance levels, bearish control is expected to persist. The index may revisit the support zone between 47,202 and 46,506, which continues to act as an important downside target area.
You may find more details in the Chart.
Trade wisely best of luck buddies.
Ps; Support with like and comments for better analysis thanks for supporting.
Gold Market Update & Technical OutlookGold currently leans bearish, but the next move will depend heavily on how the price behaves around key intraday levels.
If the 1-hour candle closes above 4230, market structure may begin to shift bullish. In that case, the price could retest the resistance zone near 4253.
A rejection from this zone may lead to a pullback toward previous support before any continuation higher if bullish momentum fails to hold, and price reacts weakly, gold may revisit the medium-term support area between 4200 and 4182, these levels will be important to watch for confirmation of either scenario.
If you found this analysis helpful, feel free to leave a comment and share—thanks!

Gold drop
A 320-pip drop on gold right from the 4237.5 resistance I forecasted in the weekly analysis 😉🔥
Hope you caught it!
We’re now over 3R in profit.

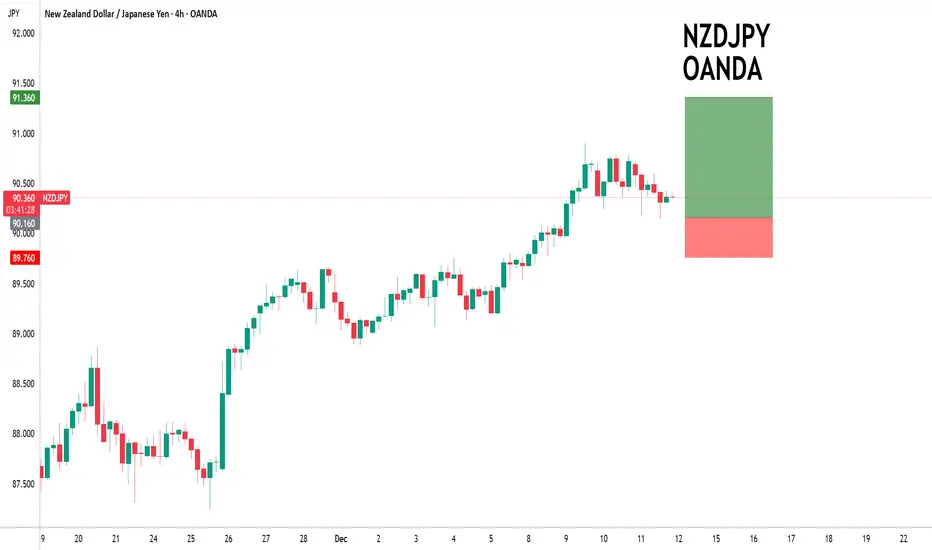
NZDJPY to continue in the upward move?NZDJPY - 24h expiry
Our short term bias remains positive.
There is no clear indication that the upward move is coming to an end.
Offers ample risk/reward to buy at the market.
The sequence for trading is higher highs and lows.
Daily signals are bullish.
We look to Buy at 90.16 (stop at 89.76)
Our profit targets will be 91.36 and 91.56
Resistance: 90.90 / 91.50 / 92.00
Support: 90.14 / 89.50 / 88.88
Risk Disclaimer
The trade ideas beyond this page are for informational purposes only and do not constitute investment advice or a solicitation to trade. This information is provided by Signal Centre, a third-party unaffiliated with OANDA, and is intended for general circulation only. OANDA does not guarantee the accuracy of this information and assumes no responsibilities for the information provided by the third party. The information does not take into account the specific investment objectives, financial situation, or particular needs of any particular person. You should take into account your specific investment objectives, financial situation, and particular needs before making a commitment to trade, including seeking, under a separate engagement, as you deem fit.
You accept that you assume all risks in independently viewing the contents and selecting a chosen strategy.
Where the research is distributed in Singapore to a person who is not an Accredited Investor, Expert Investor or an Institutional Investor, Oanda Asia Pacific Pte Ltd (“OAP“) accepts legal responsibility for the contents of the report to such persons only to the extent required by law. Singapore customers should contact OAP at 6579 8289 for matters arising from, or in connection with, the information/research distributed.
Market Landscape After the Fed Rate Cut !Gold Price Trend Analysis: Yesterday, gold opened higher and encountered resistance near 4219, then began to fluctuate downwards. During the European session, it fell to around 4187 before consolidating. Influenced by the Fed's interest rate decision, gold exhibited a pattern of rising first, then falling, and then rising again, reaching a low of around 4182 and a high of around 4239. The daily candlestick closed as a bullish candle. Logically, after this upward move, the subsequent target should be the 4255-4265 area. However, considering the current market trend, this tendency to rise more easily than fall is the most sustainable. We can actually see the upper limit, with the first high point at 4265, and at least for the current stage, we haven't reached the top yet.
Gold Technical Analysis: On the hourly chart, the moving averages are arranged in a bullish pattern, maintaining strong upward momentum. Technically, the bulls have broken through the neckline and are rising again. The price action shows a large bullish candle at the bottom, indicating strong upward momentum. The current high also coincides with the current cyclical pullback level, making a technical correction reasonable. Today, we expect the price to continue its upward trend after a pullback. Short-term support is around 4210-4200, a support/resistance level. Resistance is around 4255-4265. Avoid chasing highs, but the short-term bullish stance remains unchanged. Intraday trading should continue with a buy-on-dips strategy. In summary, today's gold trading strategy is to primarily buy on dips and secondarily sell on rallies. Key resistance is around 4255-4265, and key support is around 4210-4190. Please follow the trend closely.

Euro Surges After Fed Decision as Bulls Eye BreakoutThe post-Fed rally is now extending nearly 1.5% off the December low. The advance is testing confluent resistance, and the focus is on today’s close with respect to the upper bounds of the late-November channel.
Confluent resistance stands with the October high-day close and the 61.8% retracement of the decline off the yearly high at 1.1731/47. A daily close above this threshold is needed to keep the bulls in control with subsequent resistance objectives eyed at 1.618% extension of the late-November rally and the 2025 high-day close (HDC) at 1.1794-1.1813 and the yearly high-close at 1.1866. Both represents regions of interest for possible top-side exhaustion / price inflection IF reached.
Initial support now rests with the 100% extension at 1.1679 with near-term bullish invalidation now raised to the November HDC and the weekly open at 1.1634/41. A daily close below this threshold would be needed to suggest a more significant high is in place and that a larger trend reversal is underway toward the December low / open at 1.1590-1.16 and the October swing low at 1.1542.
Bottom line: The outlook for the EUR/USD remains constructive with the immediate focus on a reaction into near-term uptrend resistance. From a trading standpoint, losses should be limited to 1.1679 IF price is heading higher on this stretch with a close above 1.1747 needed to fuel the next leg of the advance.
-MB

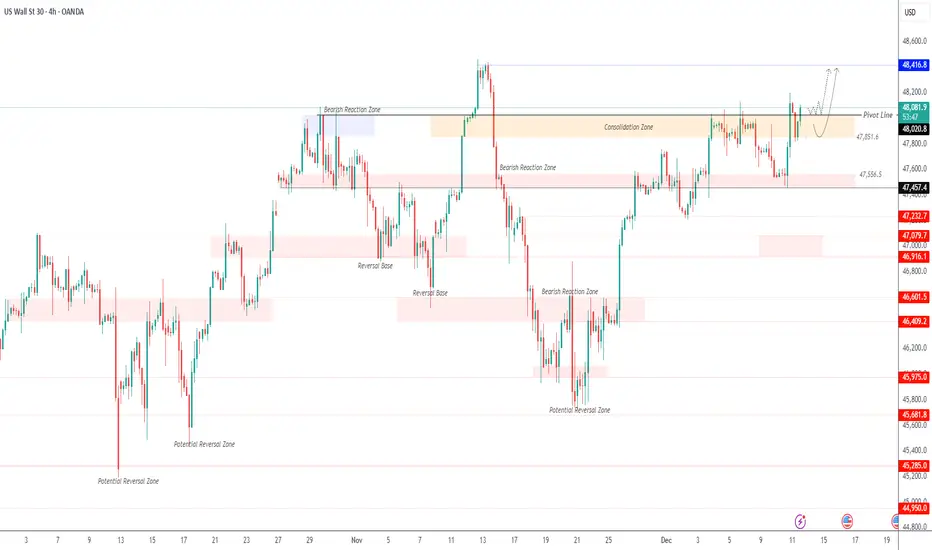
US30 Testing the Pivot Before Next MoveUS30 – Technical Overview
The Dow Jones (US30) gained 1.1% after the Fed’s rate cut, pushing the index within 200 points of a new all-time high. Futures later turned slightly positive, with US30 outperforming Nasdaq and S&P 500 despite weakness in tech.
US30 is attempting to stabilize above the 48020 pivot line. A breakout above this level on a 4H close would support a move toward the previous all-time high at 48415.
A correction remains possible toward the pivot or slightly below it, with 47850 acting as a key pullback level before any renewed bullish momentum.
A 4H break below 47850 would confirm bearish pressure toward 47560 and 47460.
Pivot: 48020
Resistance: 48415 · 48690
Support: 47850 · 47560 · 47460
SPX500 | Bulls Push Higher but Key Reversal Zone NearsSPX500 – Technical Overview
The broad market index is approaching another record high, supported by a surprisingly market-friendly message from the Federal Reserve.
Powell’s acknowledgment of “significant downside risks” in the labor market immediately signaled to traders that additional rate cuts remain possible.
Although the rate cut itself was expected, the tone was less hawkish than feared, giving bulls confidence heading into year-end.
The 9–3 split vote also revealed internal disagreement within the Fed—two members preferred no cut, while one favored an aggressive 50 bps reduction—adding uncertainty to future policy direction.
Technical Analysis
SPX500 currently shows bullish momentum, with price expected to move toward 6873 and 6888.
However, this zone is likely to act as a reversal area, and a bearish reaction could follow from these resistance levels.
As long as price remains below 6888, bearish pressure can re-emerge.
If the market stays below 6852, downside continuation remains favored toward 6815.
Upside continuation only strengthens if the market breaks and holds above 6888, targeting the 6918 region.
Pivot Line: 6852
Resistance: 6873 · 6888 · 6918
Support: 6830 · 6815 · 6797

USDJPY LONG FROM DEMAND AREA|
✅USDJPY price drives into a discounted demand level after clearing sell-side liquidity, setting up an ICT-style rebound as bullish orderflow begins to reassert itself toward the next inefficiency above. Time Frame 6H.
LONG🚀
✅Like and subscribe to never miss a new idea!✅

BITCOIN → False breakout of resistance on a downtrend BINANCE:BTCUSDT is consolidating in the range of 86K - 92K, bears are holding resistance amid a global downtrend, traders lack drivers...
Fundamentally, sentiment in the crypto market is weak, and there is increasing talk of a crypto winter, especially among companies that previously actively bought cryptocurrencies for their balance sheets. There is no bullish driver at the moment.
Bitcoin is in a neutral state, with the market holding the price below 93K. The fundamental background is unstable, and technically, the market is in a downtrend. A reversal pattern is forming relative to 92K, and a retest and false breakout of the zone of interest could trigger a decline to the support range.
Locally, we are seeing an upward channel, but this is a correction against the backdrop of the global trend. If the bears keep the price below 92K, the decline may continue. However, a breakout of 94K and a close above that level could trigger an upward momentum...
Resistance levels: 91850, 92700, 93700
Support levels: 88000, 86300
A false breakout and price consolidation in the short zone could cause further sell-offs towards the areas of interest located at the bottom of the trading range.
Best regards, R. Linda!

USDJPY BuyOverall structure is still bullish, but price reacted strongly from higher timeframe supply. On the 1H chart we had a clean rejection from supply + internal BOS showing short term weakness.
Because of that, I took short setups into the blue 1H demand zone.
Now that price reached the blue demand zone, I will follow the higher timeframe trend and entered a long position.

Gold trending or mean revertingTrading near the upper zone may indicate a potential reversal or pullback toward efficiency levels.
Nifty levels - Dec 12, 2025Nifty support and resistance levels are valuable tools for making informed trading decisions, specifically when combined with the analysis of 5-minute timeframe candlesticks and VWAP. By closely monitoring these levels and observing the price movements within this timeframe, traders can enhance the accuracy of their entry and exit points. It is important to bear in mind that support and resistance levels are not fixed, and they can change over time as market conditions evolve.
The dashed lines on the chart indicate the reaction levels, serving as additional points of significance to consider. Furthermore, take note of the response at the levels of the High, Low, and Close values from the day prior.
We hope you find this information beneficial in your trading endeavors.
* If you found the idea appealing, kindly tap the Boost icon located below the chart. We encourage you to share your thoughts and comments regarding it.
Wishing you success in your trading activities!

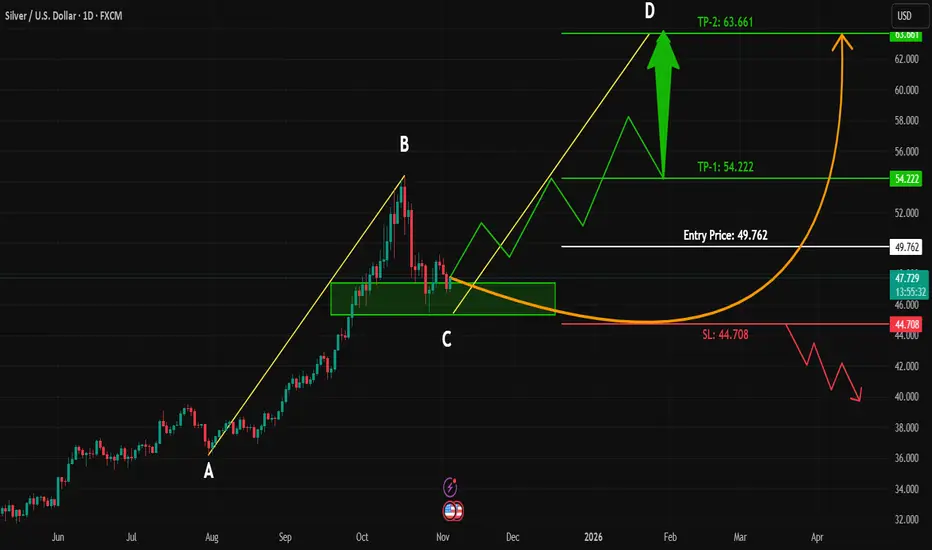
SILVER | Forming AB=CD Pattern | Strong Buy Zone Ahead!#SILVER is currently moving in a correction phase and has reached the Fib retracement zone between 0.382 – 0.5, which historically acts as a strong buying area for long-term investors.
At this zone, no major bearish signs are visible, and the structure suggests a possible formation of a bullish AB=CD pattern.
Trading Plan:
Wait for a clear breakout above the 0.5 level and resistance zone around 49.765.
On the break and retest, we’ll look for long entries with proper risk management.
Key Takeaways:
Correction phase nearing completion
Possible AB=CD bullish pattern
Watching for breakout confirmation before entry
Stay patient — the next bullish leg could start soon if confirmation aligns.
What’s your view on #SILVER? Do you think this zone will hold or break deeper? Drop your analysis below!
#SILVER #XAGUSD #TradingView #Fibonacci #ABCDPattern #TechnicalAnalysis #BuyTheDip #Commodities
The downward trend in gold prices is likely to continue.
news:
The Federal Reserve cut interest rates by 25 basis points as expected, fully in line with market expectations.
However, internal opinions diverged the most this year, with the statement signaling a "hawkish rate cut," predicting a very slow pace of easing in the future, with only one rate cut expected in the next two years.
Because this statement was not significantly different from previous market expectations, although it presented a hawkish signal, it was not as strong as previously anticipated. Gold prices initially fell after the data release but then rose, breaking through the key level of 4230 immediately after Powell's speech.
This indicates that the market has largely priced in this data release. With the subsequent release of non-farm payroll and CPI data, if the cooling labor market and inflation cannot be controlled, gold and silver may face another round of declines.
Technical aspects:
1. The daily moving averages MA5 and MA10 are converging and flattening, indicating a sideways price movement. The MACD indicator is also converging and flattening, further suggesting a sideways price movement. Currently, daily support is around the parabolic retracement level and the middle Bollinger Band, corresponding to the 4175-4165 range. In the short term, the daily chart is expected to remain within the large range of 4260-4170.
2. On the 4-hour chart, the MACD is currently consolidating near the zero line with decreasing volume, and the candlestick has also fallen back to around 4200, near the middle Bollinger Band. Currently, all 4-hour moving averages are intertwined around the middle Bollinger Band, indicating that the price is oscillating around this level, within the 4190-4130 range.
3. On the hourly chart, the MACD is currently showing a bearish crossover with increasing volume, and the stochastic oscillator is rapidly moving downwards into oversold territory, indicating a weak and sideways price movement. Short-term support is at the MA60, around 4200. A break below this level will likely lead to further downward movement towards the lower Bollinger Band, currently around 4160.
Strategy Signals:
Buy at 4235-40, stop loss : 4250, target: 4210, 4190, 4160

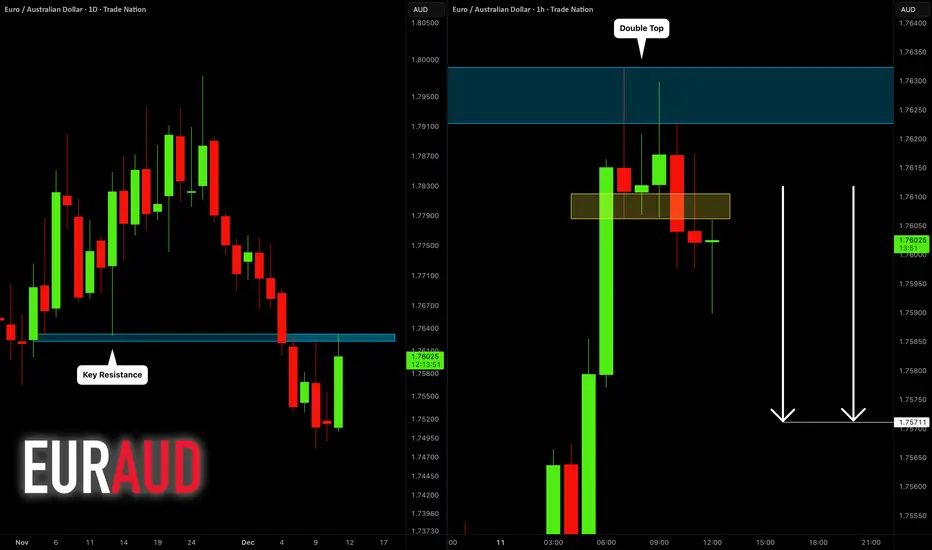
EURAUD: Bearish Move From Key Level 🇪🇺🇦🇺
EURAUD will most likely drop from a key daily resistance level.
I opened my short position on a retest of a broken neckline of
a double top pattern on an hourly.
Goal - 1.7571
❤️Please, support my work with like, thank you!❤️
I am part of Trade Nation's Influencer program and receive a monthly fee for using their TradingView charts in my analysis.