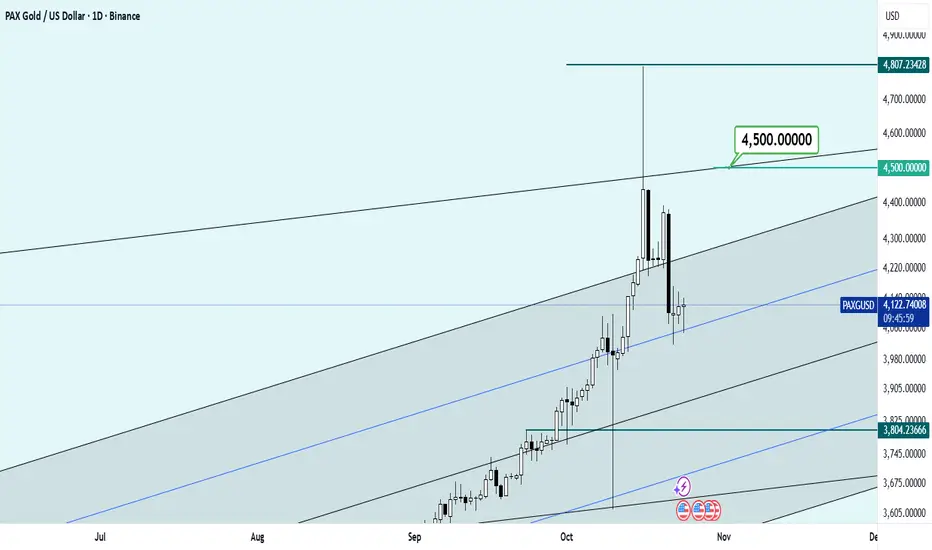
We should test gold with a price target of $4,800!!!This is an empirical test and forward and backtests on the gold chart have confirmed this to some extent, but the timing of the events remains a vague issue. In the end, I must say that I envision a range of $4,800 for the global gold price!
Good luck...
Support and Resistance
VAKKO about to break outAfter break out from resitance level 65, expecting 75 as first resistance and then for the 100 strong resistance. * Not for trading advice *

VESTL, now bullishVESTL broke out, but waiting for closing daily of 44. MACD positive.
Targets 55 , 65 and strong resistance 75
* Not for trading advice *

PD, about to start a long journey.For PD, on the weekly chart, big movement is coming. As seen with the circles, it is the time to break out for long journey. Volume negative divergence is on the spot.
Targets 21 - 26 - 35 and 41 with the Fib 0,618.
* Not for the trading advice *

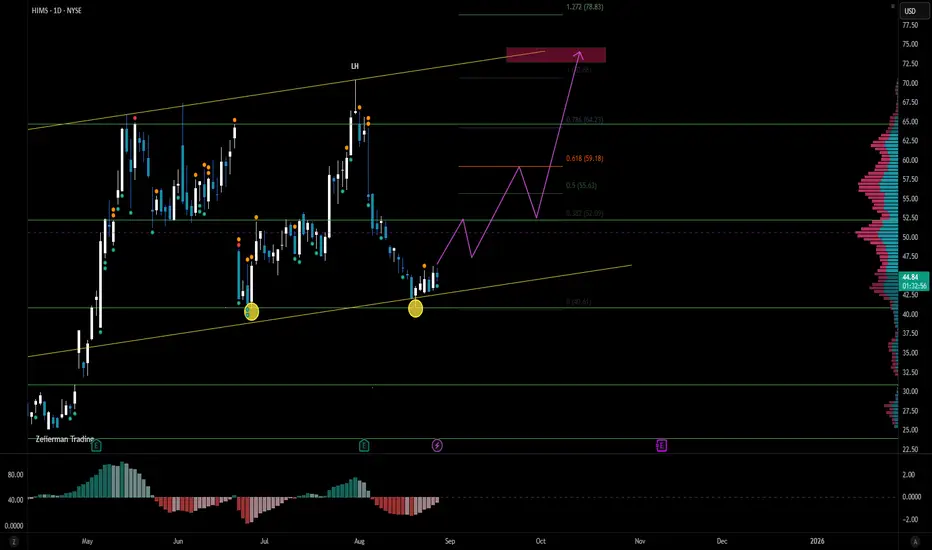
HIMS, confirmed reversalReversal confirmed by double bottom and trend. Also MACD almost positive. First target 59 at Fib 0,618 and after retracement to volume support , expecting ATH as a resistance at 72-75. * Not for a trading advice *
SNCR flowing through the channelSNCR, expecting bounce from lower channel line through the upper to 7,60 . Then strong resistance area of 8.60s, if break out and continues for FVG then a new choch/SMC follows by new HHs.

IBRX consolidating at $2.3 with volume confirmationThe share price has tested and been holding steady around/above ~2.3 for all of 2025. Volume is showing a very obvious increase over time as shares are being consolidated at this level. Price is due for a reversal. How high? My conservative guess is it will reach at least $6.7 before the end of its upward trend.
Don't know much about the company, just going off the chart.

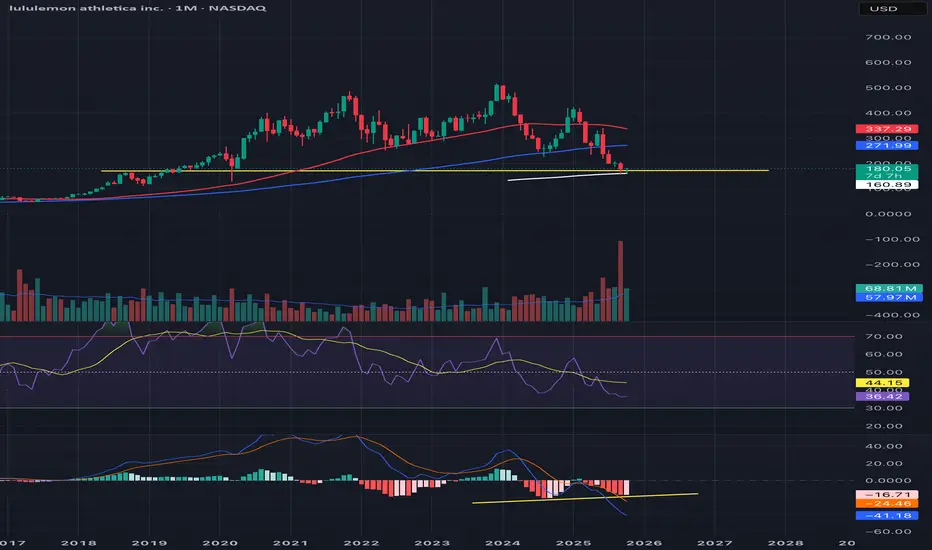
LULU into major support on the monthly timeframeLululemon (LULU) — Deep Value Setup with Technical Reversal Signals
Summary:
Lululemon (LULU) has seen substantial downside over the past several months, declining nearly 58% since early February. Despite the steep correction, multiple technical and fundamental indicators suggest the stock may be approaching a major inflection point.
Technical Outlook:
Price action has now reached a key long-term support zone, as illustrated by the yellow trendline on the chart. Additionally, a bullish divergence has formed on the MACD, a historically reliable signal of momentum reversal when paired with strong support levels.
Fundamental Perspective:
While the company revised its 2025 guidance lower, the underlying fundamentals remain strong. According to Morningstar’s fair value estimate, LULU’s intrinsic value is approximately $295 per share, implying the stock currently trades at a ~64% discount to its assessed business value.
Investment Thesis:
With nearly 3 decades of operational excellence, a loyal customer base, and a proven global brand, Lululemon is unlikely to face long-term solvency or relevance risk. This setup aligns best with long-term investors who are comfortable holding positions through near-term volatility to capitalize on potential multi-year upside.
Timeframe: Monthly (long-term investment horizon)
UPDATE ON USD/CHF LONGSUSD/CHF 1H - Well would you look at that, price has played out very well with this pair, I told you all in previous analysis that I wanted to see the last high break, breaking structure before trading us down and into the zone marked out.
We have been delivered with exactly that, not only giving you the opportunity to buy in before the short trading into the Demand Zone but also now buying in from that Demand Zone.
This trade ran + 45 pips. (+ 3%) 3RR
It is amazing to see our analysis playing out exactly as we want it to, now in order for us to deem a safe entry here taking this market long, we aught to wait for a fractal break higher.
Once we have broken a fractal high we can then begin looking to buy in longer term. A big well done to anyone who shorted into the Demand Zone though.

US30: Price fails to break high, sellers step inSPREADEX:DJI – Price Rejects Previous High, Possible Pullback Ahead
🕒 Timeframe: 30-Minute Chart
📊 Data Source: Spreadex
💵 Currency: USD
________________________________________
🧠 Short Summary (SEO Preview)
US30 (Dow Jones) has rejected its previous swing high near 47,100 after a strong bullish recovery. Price action now shows early signs of weakness from the supply zone, suggesting a potential short-term correction before the next directional move.
#US30 #DowJones #WallStreet #PriceAction #SupplyAndDemand #TechnicalAnalysis #TradingViewIdeas
________________________________________
📈 Market Overview
After forming a solid base around 46,250 – 46,300, the Wall Street Index (US30) has staged a strong V-shaped recovery.
However, recent candles show that price was rejected at the previous high around 47,100, indicating that buying momentum may be fading as the market hits a strong supply zone.
________________________________________
🔍 Key Technical Zones
Supply Zone (Resistance):
47,000 – 47,150
This zone aligns with the previous swing high where strong selling pressure emerged.
The rejection from this level signals potential exhaustion of buyers in the short term.
Demand Zone (Support):
46,750 – 46,850
This is a former resistance area turned support. A retest here could trigger a short-term bullish reaction before the market decides its next move.
________________________________________
🎯 Trading Scenarios
Scenario 1 – Rejection from Supply Zone (Main Bias)
1. Price has tested the 47,000 – 47,150 zone and rejected the previous high.
2. If sellers remain in control, a pullback toward 46,750 – 46,850 is likely.
3. A deeper correction could extend toward 46,600 – 46,650 if momentum builds.
Scenario 2 – Breakout Above Supply Zone
1. A confirmed candle close above 47,150 would invalidate the short-term bearish bias.
2. In that case, 47,150 may flip into support, opening room for 47,300 – 47,400 as the next bullish targets.
________________________________________
🧭 Technical Outlook
• The rejection of the previous high at 47,100 confirms a key resistance zone.
• Momentum is slowing, suggesting a likely short-term pullback before any new highs.
• Potential strategy: Wait for bearish confirmation (e.g., rejection candle, lower-high formation) around 47,000 – 47,150 before making any decision.
________________________________________
Disclaimer
This analysis is for educational and technical purposes only — not financial advice.
Always manage risk and follow your own trading plan before taking any trades.
Please like and comment below to support our traders. Your reactions will motivate us to do more analysis in the future 🙏✨
Harry Andrew @ ZuperView

UPDATE ON EUR/USD SETUPEUR/USD 4H - As you can see this pair has played out exactly as we predicted, we wanted to see price trade up and into this area of interest before taking us lower in the market.
Once price trades us up and into the zone we expect Supply to be introduced which will give us the bearish move we have been provided with, now what confirms a longer term move is a bos to the downside.
This will come fractally, so its important that we look inside of the wave that traded price up and into this zone and we mark out the last protected low that was set within the bullish leg.
Once we see price break beneath that, that is when we know that there is enough Supply in the market to see price trade us lower longer term allowing us to get involved in some short positions.

BANKNIFTYBanknifty levels based on imbalances
1. gapup 57900 long
2. 57900-57400 trade breakout
3. gsapdown 57400 short

BEGINNING OF MAJOR BUYEntry was at 4065-60 and sl at 4040 and tp1 at 4250, so if you are risking 250 for 1500+ , we already at 500 profits and price was just 35pips close to hitting our sl, even if it hit sl I would have called buy again around same entry after i saw a rejection below.

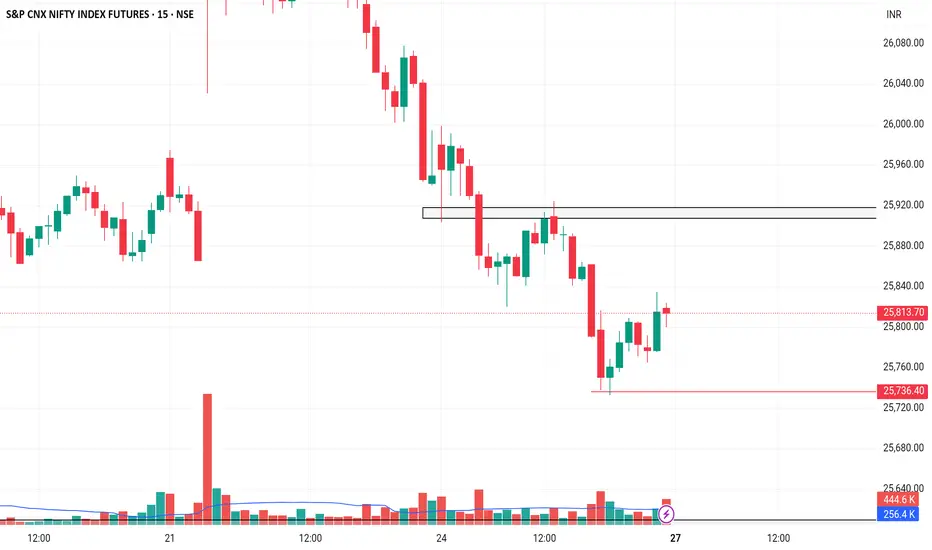
NIFTYNifty levels are b ased on imbalances
1. gapup 25920 long
2. 25920-25720 trade breakout
3. gapdown 25720 short
NQZ2025 Return to Wick 50% then liquidity purgeOn the 4h chart, I see price close above the 50% of a 4h Order Block and above a 1h gap. I think the market has a high probability of treating the gap as an inversion, that, with the confluence of DXY purging shorts and the weekly wick 50%.
Therefore, the next likely target is the liquidity resting above.

US OIL SUPPORT, RESISTANCE & TRENDLINE ANALYSISMy final levels for the last day.
Go "LONG" if it breaks 62.18 and if it also breaks the trendline then can move up till 62.59 and breaking that might lead to 63.01.
Go "SHORT" if it breaks 61.77 along with the trendline leading to 61.35 and if it breaks that then aim for 60.94 and lastly if it breaks that as well by EOD then 60.46 should be our target.
Happy Weekend!!

Steel Dynamics Could Be Fighting Higher Steel Dynamics hit a record high on Tuesday after earnings beat estimates. Now, after a pullback, some traders may see potential for more upside.
The first pattern on today’s chart is the October 9 closing price of $147.78. STLD was trapped below that level for more than a week, but it ripped through resistance following quarterly results. The stock remained above it the next two sessions as it fell and bounced, which may suggest new support is emerging above an old high.
Second is the November 2024 all-time high of $155.56. The steelmaker has made an initial probe of that level. Will another test be more successful?
Third, notice how the moving averages have spread out since September. The 8-day exponential moving average (EMA) is above the 21-day EMA and the 50-day simple moving average (SMA) is above the 200-day SMA. That may suggest its short- and long-term trends are getting more bullish.
Finally, MACD has been rising.
TradeStation has, for decades, advanced the trading industry, providing access to stocks, options and futures. If you're born to trade, we could be for you. See our Overview for more.
Past performance, whether actual or indicated by historical tests of strategies, is no guarantee of future performance or success. There is a possibility that you may sustain a loss equal to or greater than your entire investment regardless of which asset class you trade (equities, options or futures); therefore, you should not invest or risk money that you cannot afford to lose. Online trading is not suitable for all investors. View the document titled Characteristics and Risks of Standardized Options at www.TradeStation.com . Before trading any asset class, customers must read the relevant risk disclosure statements on www.TradeStation.com . System access and trade placement and execution may be delayed or fail due to market volatility and volume, quote delays, system and software errors, Internet traffic, outages and other factors.
Securities and futures trading is offered to self-directed customers by TradeStation Securities, Inc., a broker-dealer registered with the Securities and Exchange Commission and a futures commission merchant licensed with the Commodity Futures Trading Commission). TradeStation Securities is a member of the Financial Industry Regulatory Authority, the National Futures Association, and a number of exchanges.
TradeStation Securities, Inc. and TradeStation Technologies, Inc. are each wholly owned subsidiaries of TradeStation Group, Inc., both operating, and providing products and services, under the TradeStation brand and trademark. When applying for, or purchasing, accounts, subscriptions, products and services, it is important that you know which company you will be dealing with. Visit www.TradeStation.com for further important information explaining what this means.

Possible Gold Long SetupIf gold falls to around 4065–4070, it could present a buying opportunity. My target is 4122, but the 4094 level is an intermediate resistance that could disrupt this setup.
A breakout above 4094 might act as a buy signal, though I would avoid entering there due to the unfavorable risk-reward ratio.

Ethereum Wave Analysis – 24 October 2025
- Ethereum reversed from support zone
- Likely to rise to resistance level 4095,00
Ethereum cryptocurrency recently reversed up from the support zone between the strong support level 3745.00 (which reversed the price multiple times this month) and the 38.2% Fibonacci correction of the upward impulse from June.
The upward reversal form this support zone is likely to form the daily Japanese candlesticks reversal pattern Morning Star – strong buy signal for Ethereum.
Given the clear daily uptrend, Ethereum cryptocurrency can be expected rise fall to the next resistance level 4095,00 (which stopped the previous correction ii).

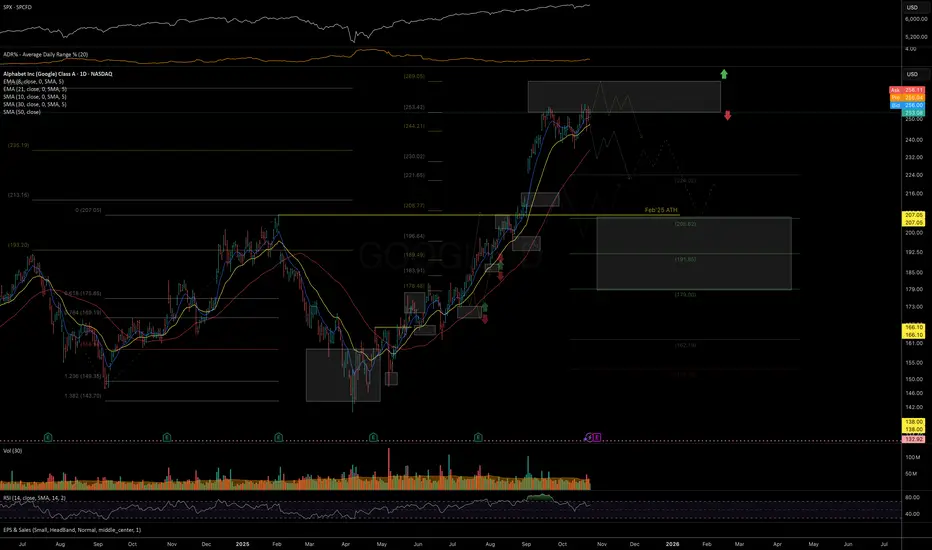
GOOGL: price at important resistance zonePrice has been following the outlined structure from the July and August updates, showing the expected relative outperformance versus SPX. However, instead of forming a prolonged Autumn consolidation, price moved almost directly to the target resistance zone for the uptrend since the April bottom: 250–270.
While one more short-term push toward the top of the resistance zone is possible, as long as price remains below 270, I am watching for rising selling pressure and a potential durable consolidation to develop in the coming weeks. If price manages to post a sustained breakout above 270, the current structural view would need to be reassessed.
Caution is advised with any new long exposure at these levels, and consider protecting open long positions in case of a reversal or broader market weakness.
Chart:
Previously:
• On resistance and potential consolidation (Aug 29):
Chart:
Link: www.tradingview.com
• On local support (Aug 11):
Chart:
Link: www.tradingview.com
• On upside potential & relative strength vs SPX (Aug 5):
Link: www.tradingview.com
• On breakout setup (Jul 13):
Chart:
Link: www.tradingview.com
XAUUSD SUPPORT, RESISTANCE & TRENDLINE ANALYSISDon't fall into the CPI data trap.
My levels will remain the same as posted last time. Follow the same levels for a retest or a reversal.
Go "LONG" if it breaks 4097.28 with 4126.59 with the first target and breaking that as well shall lead to 4155.75 and next if it breaks this as well the might move up till 4201.11
Go "SHORT" if it breaks 4067.96 and further till 4038.47 and breaking that as well might lead to 4000 and 3945.41
Note: As long as it stays below 4160 the plan for "SHORT" only and if it breaks that then we might see an upward movement in the long run.

XAUUSD (ONDA) Intraday & Swing LevelsLevels interpretation Follows:
🌡️Plot Levels Using 3 Min, 5 Min Time frame in your Chart for Better Analysis
L#1: If the candle crossed & stays above the “Buy Gen”, it is treated / considered as Bullish bias.
L#2: Possibility / Probability of REVERSAL near RLB#1 & UBTgt
L#3: If the candle stays above “Sell Gen” but below “Buy Gen”, it is treated / considered as Sidewise. Aggressive Traders can take Long position near “Sell Gen” either retesting or crossed from Below & vice-versa i.e. can take Short position near “Buy Gen” either retesting or crossed downward from Above.
L#4: If the candle crossed & stays below the “Sell Gen”, it is treated / considered a Bearish bias.
L#5: Possibility / Probability of REVERSAL near RLS#1 & USTgt
HZB (Buy side) & HZS (Sell side) => Hurdle Zone,
*** Specialty of “HZB#1, HZB#2 HZS#1 & HZS#2” is Sidewise (behaviour in Nature)
Rest Plotted and Mentioned on Chart
Color code Used:
Green =. Positive bias.
Red =. Negative bias.
RED in Between Green means Trend Finder / Momentum Change
/ CYCLE Change and Vice Versa.
Notice One thing: HOW LEVELS are Working.
Use any Momentum Indicator / Oscillator or as you "USED to" to Take entry.
⚠️ DISCLAIMER:
The information, views, and ideas shared here are purely for educational and informational purposes only. They are not intended as investment advice or a recommendation to buy, sell, or hold any financial instruments. I am not a SEBI-registered financial adviser.
Trading and investing in the stock market involves risk, and you should do your own research and analysis. You are solely responsible for any decisions made based on this research.
"As HARD EARNED MONEY IS YOUR's, So DECISION SHOULD HAVE TO BE YOUR's".
Do comment if Helpful .
In depth Analysis will be added later (If time Permits)

EURUSD Wave Analysis – 24 October 2025- EURUSD reversed from support zone
- Likely to rise to resistance level 1.1740
EURUSD currency pair recently reversed up from the support area between the strong support level 1.1570 (which has been reversing the price from August), lower daily Bollinger Band and the support trendline of the daily up channel from July.
The upward reversal form this support zone stopped the previous minor correction 2 of the higher order impulse wave (3) from the start of October.
Given the clear daily uptrend and the strong euro sentiment, EURUSD currency pair can be expected to rise to the next resistance level 1.1740 (which stopped the previous impulse wave 1).
