Gold drop
A 320-pip drop on gold right from the 4237.5 resistance I forecasted in the weekly analysis 😉🔥
Hope you caught it!
We’re now over 3R in profit.
Support and Resistance

Marriott Pulls Back Following RallyMarriott rallied last month and now it’s pulled back.
The first pattern on today’s chart is the surge to a new record high above $300. The move followed better-than-expected earnings and revenue on November 4, which may reflect improved fundamentals in the hotel stock.
Second is July’s peak of $283.75. MAR bounced at that level in mid-November and may be trying to hold it again this week. Has old resistance become new support?
Third, MAR made a higher high on Wednesday and a lower low compared with the previous session. That bullish outside day could suggest its recent slide is ending.
Fourth, stochastics have dipped toward oversold territory.
Finally, the 50-day simple moving average (SMA) had a “golden cross” above the 200-day SMA in July. It’s stayed there since and is now expanding away from the slower SMA. That may potentially represent the start of a longer-term uptrend.
TradeStation has, for decades, advanced the trading industry, providing access to stocks, options and futures. If you're born to trade, we could be for you. See our Overview for more.
Past performance, whether actual or indicated by historical tests of strategies, is no guarantee of future performance or success. There is a possibility that you may sustain a loss equal to or greater than your entire investment regardless of which asset class you trade (equities, options or futures); therefore, you should not invest or risk money that you cannot afford to lose. Online trading is not suitable for all investors. View the document titled Characteristics and Risks of Standardized Options at www.TradeStation.com . Before trading any asset class, customers must read the relevant risk disclosure statements on www.TradeStation.com . System access and trade placement and execution may be delayed or fail due to market volatility and volume, quote delays, system and software errors, Internet traffic, outages and other factors.
Securities and futures trading is offered to self-directed customers by TradeStation Securities, Inc., a broker-dealer registered with the Securities and Exchange Commission and a futures commission merchant licensed with the Commodity Futures Trading Commission). TradeStation Securities is a member of the Financial Industry Regulatory Authority, the National Futures Association, and a number of exchanges.
TradeStation Securities, Inc. and TradeStation Technologies, Inc. are each wholly owned subsidiaries of TradeStation Group, Inc., both operating, and providing products and services, under the TradeStation brand and trademark. When applying for, or purchasing, accounts, subscriptions, products and services, it is important that you know which company you will be dealing with. Visit www.TradeStation.com for further important information explaining what this means.

US Dollar: Bearish! Look To Sell it towards 98.56!Welcome back to the Weekly Forex Forecast for the week of Dec 8-15th.
In this video, we will analyze the following FX market: USD Dollar
The USD is currently bearish, sitting in a Daily -FVG. If the FVG holds, the sell off will continue from last week. Should the -FVG fail, then hold off on sells! A close above the -FVG will be a bullish indication.
Wed's FOMC will likely weaken the currency further, as institutions have seemingly baked in their bearish bets.
Enjoy!
May profits be upon you.
Leave any questions or comments in the comment section.
I appreciate any feedback from my viewers!
Disclaimer:
I do not provide personal investment advice and I am not a qualified licensed investment advisor.
All information found here, including any ideas, opinions, views, predictions, forecasts, commentaries, suggestions, expressed or implied herein, are for informational, entertainment or educational purposes only and should not be construed as personal investment advice. While the information provided is believed to be accurate, it may include errors or inaccuracies.
I will not and cannot be held liable for any actions you take as a result of anything you read here.
Conduct your own due diligence, or consult a licensed financial advisor or broker before making any and all investment decisions. Any investments, trades, speculations, or decisions made on the basis of any information found on this channel, expressed or implied herein, are committed at your own risk, financial or otherwise.

ASM/USD - Assemble AI - 12-11-2025This is a good chart to trade!
Look at the high volatility with massive % moves!
RSI over sold, with the Vix fix bottom finder showing a bottom!
This is overdue for a little pop, like +350% lol
The big pop is like +1000% :)
I got in 12-09-2025 a couple days ago!
I thought I should share this chart!
Be careful, I don't know how low this can go!

Direxion Midcap Bull 3x | MIDU | Long at $45.67Like my predictions for AMEX:TNA , I believe midcap stocks will likely rise as interest rates are lowered over the next few years (probably a little too early given the looming economic situation). While it may be a bumpy ride and everything truly depends no announcement of an "official" economic recession (by which all stock expectations would change to the negative), there could be significant room to run here before a top - but always stay cautious...
Thus, at $45.67 AMEX:MIDU is in a personal buy zone.
Targets:
$55.00
$75.00 (longer-term if the economic data/news hold up strong)

BAKEUSDT another 2x at least is cookingAs observed on the chart, the price is currently testing a major daily support level, which has already catalyzed a strong rebound. The initial move, resulting in approximately 100% appreciation and supported by notably high trading volume, indicates substantial buying interest and validates the strength of this support zone.
Given this confirmed momentum and volume-backed conviction, the technical structure now suggests the potential for further appreciation. A sustained move from this level could project an additional 100% to 200% gain, provided the asset maintains its current momentum and the support zone continues to hold.
DISCLAIMER: ((trade based on your own decision))
<<press like👍 if you enjoy💚

EURCAD | Move DownLooking for EURCAD to continue the downtrend.
EURCAD is at a key level at the moment testing PDH.
If it breaks this level I expect EURCAD to move further up trying to find liquidity to fuel the next leg down.
Let me know what your analysis is on EURCAD!
Stay safe out there and do your own due diligence, this is not investment advise!

DOT – Bullish Reversal on 4H | Inverse Head & Shoulders in Play#Polkadot (#DOT) is showing a strong bullish reversal signal on the 4-hour timeframe, where the price is developing a clean Inverse Head & Shoulders pattern.
Currently, #DOT is forming the right shoulder, indicating that buyers are stepping in and market structure is shifting toward the upside.
Key Highlights
Inverse H&S pattern active on 4H
Right shoulder formation underway
Breakout expected above the neckline + resistance zone
High-probability setup for a trend reversal
Focus on confirmation, not anticipation
Trading Plan
I will wait for:
Breakout above the neckline/resistance
Successful retest with bullish confirmation
Long entry with strict risk management
Targets will be based on measured move of the pattern and key supply zones.
Risk Management
Always trade with:
Stop-loss below the right shoulder
Strict position sizing
Market structure validation
What do you think?
Do you expect #DOT to break out or reject the neckline?
Share your thoughts in the comments!
If you found this helpful, like, follow, and comment for more high-probability setups on BTC, ALTCOINS, FOREX & Indices.
#DOT #Polkadot #Crypto #Altcoins #InverseHeadAndShoulders #ChartPattern #CryptoTrading #TechnicalAnalysis #4HChart #BullishReversal #PriceAction #TradingStrategy #LongSetup #BreakoutTrading

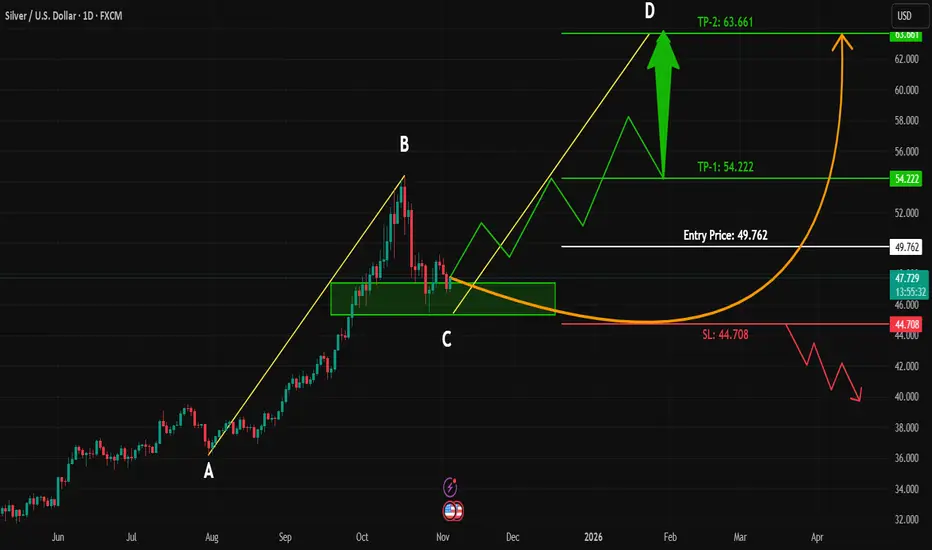
SILVER | Forming AB=CD Pattern | Strong Buy Zone Ahead!#SILVER is currently moving in a correction phase and has reached the Fib retracement zone between 0.382 – 0.5, which historically acts as a strong buying area for long-term investors.
At this zone, no major bearish signs are visible, and the structure suggests a possible formation of a bullish AB=CD pattern.
Trading Plan:
Wait for a clear breakout above the 0.5 level and resistance zone around 49.765.
On the break and retest, we’ll look for long entries with proper risk management.
Key Takeaways:
Correction phase nearing completion
Possible AB=CD bullish pattern
Watching for breakout confirmation before entry
Stay patient — the next bullish leg could start soon if confirmation aligns.
What’s your view on #SILVER? Do you think this zone will hold or break deeper? Drop your analysis below!
#SILVER #XAGUSD #TradingView #Fibonacci #ABCDPattern #TechnicalAnalysis #BuyTheDip #Commodities
Looking For BTC TO Make a new HighBTC Buy Setup (Post-FOMC)
• Daily turned bullish
• H4 bullish – new HH, pullback holding 92K
• Looking for break above 93K once H1 turns bullish
• Trail toward 100K
• Market reacting positively after today’s FOMC

S&P500 INDEX (US500): Bullish Move After Trap
I see a confirmed liquidity grab after a test of a major
intraday demand zone on US500.
An occurrence of a buying imbalance afterward
suggests a strong bullish pressure.
I expect a rise at least to 6875
❤️Please, support my work with like, thank you!❤️
I am part of Trade Nation's Influencer program and receive a monthly fee for using their TradingView charts in my analysis.

EURUSD showing a well-defined bullish structure,EURUSD chart is currently showing a well-defined bullish structure, even though the pair has recently pulled back this area has acted as a strong reaction level multiple times in the past, making it an important zone for determining the next direction.
Technically in this structure, price appears to be forming a potential retest-and-bounce pattern and creating a rebound that could push EURUSD back toward the first resistance around 1.1660. a clean breakout above this area would signal renewed bullish strength and open the doors for a further continuation toward the next resistance level near 1.1700, which stands as the upper major target on your chart.
if the support area fails, however, price may temporarily dip below the trendline before recovering, forming a liquidity grab or false break—this scenario is also illustrated in the diagram. Such a movement would still keep the broader bullish structure intact as long as the price does not break decisively below the shaded support region.
You may find more details in the chart,
Trade wisely best of luck buddies.
Ps; Support with like and comments for better analysis thanks for supporting.

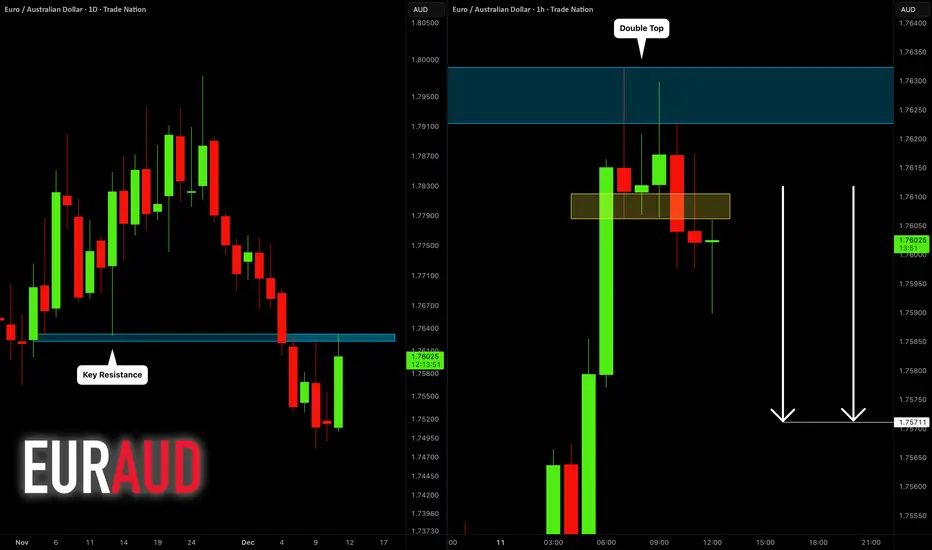
EURAUD: Bearish Move From Key Level 🇪🇺🇦🇺
EURAUD will most likely drop from a key daily resistance level.
I opened my short position on a retest of a broken neckline of
a double top pattern on an hourly.
Goal - 1.7571
❤️Please, support my work with like, thank you!❤️
I am part of Trade Nation's Influencer program and receive a monthly fee for using their TradingView charts in my analysis.
GBPUSD Poised to Rally as USD Weakens Into December CutIn today's trading session we are monitoring GBPUSD for a buying opportunity around the 1.32900 zone.
GBPUSD remains in a clear uptrend, and is currently in a correction phase, approaching the 1.32900 support and resistance area, where buyers may step back in.
On the fundamental side, the US Dollar continues to weaken as the market increasingly prices in a December rate cut from the Federal Reserve. Recent US data has been softening, adding pressure on the Fed and reinforcing expectations for looser monetary policy.
A dovish Fed outlook = bearish USD, which naturally supports GBPUSD upside.
Trade safe,
Joe.

DeGRAM | GOLD will correct to the $4150 level📊 Technical Analysis
● XAU/USD is compressing inside a large symmetrical structure, repeatedly rejecting the descending resistance line near 4,238, showing persistent seller control. A breakdown toward 4,192 and potentially the rising support line near 4,160 becomes likely if price fails to reclaim mid-range support.
● Momentum weakens with lower highs and fading bullish follow-through, increasing probability of a medium-term bearish continuation.
💡 Fundamental Analysis
● Recent data shows steady U.S. labor strength and firm Treasury yields, limiting gold’s ability to rally as markets price slower Fed easing.
✨ Summary
● Short bias: rejection at 4,238 → targets 4,192 and 4,160; key resistance 4,238–4,277.
-------------------
Share your opinion in the comments and support the idea with a like. Thanks for your support!

NZDUSD: Bullish Trend Continues 🇳🇿🇺🇸
There is a high probability that NZDUSD will continue
rising after a retest of a recently broken horizontal structure.
I expect a growth at least to 0.5814
❤️Please, support my work with like, thank you!❤️
I am part of Trade Nation's Influencer program and receive a monthly fee for using their TradingView charts in my analysis.

XAUUSD 10Dec 2025 🔥 Gold (XAUUSD) Trade Plans | 30M Chart
- Pullback Short (Scalp):
Sell 4,212-4,219 | SL: 4,220 | TP: 4,190
- Main Long (Distribution): Buy 4,181-4,172 | SL: 4,163 | TP: 4,260
Smart Money Concepts: Targeting pullback into demand zone, then bullish distribution! 🚀
_Not financial advice._
#Gold #SMC #Trading"

MP shortDowntrend + Wedge (continuation pattern ), near resistance
Looks like Wave 12345 + Wave ABC
Stop 67,
Short entry 63
Target 45
Risk management is much more important than a good entry point.
I am not a PRO trader.
In my trading plan, the Max Risk of each short term trade should be less than 1% of an account.

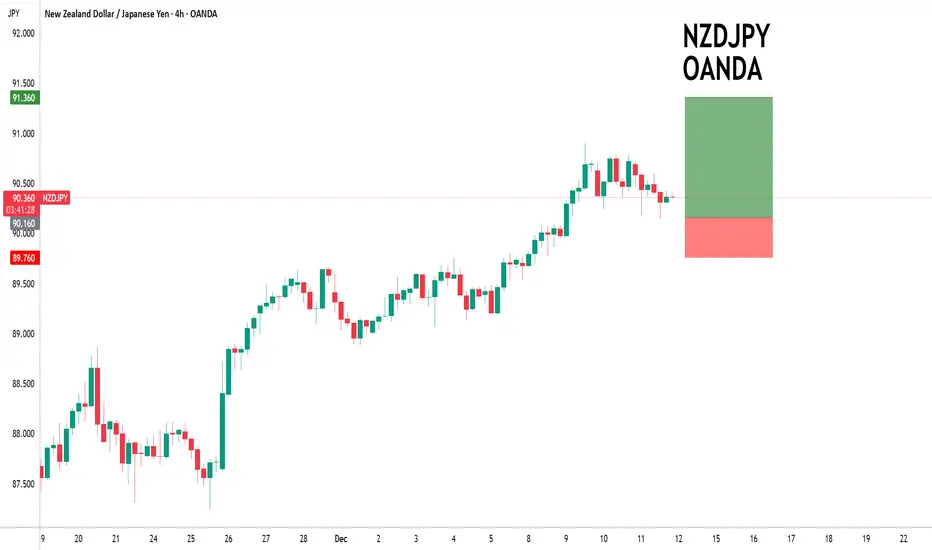
NZDJPY to continue in the upward move?NZDJPY - 24h expiry
Our short term bias remains positive.
There is no clear indication that the upward move is coming to an end.
Offers ample risk/reward to buy at the market.
The sequence for trading is higher highs and lows.
Daily signals are bullish.
We look to Buy at 90.16 (stop at 89.76)
Our profit targets will be 91.36 and 91.56
Resistance: 90.90 / 91.50 / 92.00
Support: 90.14 / 89.50 / 88.88
Risk Disclaimer
The trade ideas beyond this page are for informational purposes only and do not constitute investment advice or a solicitation to trade. This information is provided by Signal Centre, a third-party unaffiliated with OANDA, and is intended for general circulation only. OANDA does not guarantee the accuracy of this information and assumes no responsibilities for the information provided by the third party. The information does not take into account the specific investment objectives, financial situation, or particular needs of any particular person. You should take into account your specific investment objectives, financial situation, and particular needs before making a commitment to trade, including seeking, under a separate engagement, as you deem fit.
You accept that you assume all risks in independently viewing the contents and selecting a chosen strategy.
Where the research is distributed in Singapore to a person who is not an Accredited Investor, Expert Investor or an Institutional Investor, Oanda Asia Pacific Pte Ltd (“OAP“) accepts legal responsibility for the contents of the report to such persons only to the extent required by law. Singapore customers should contact OAP at 6579 8289 for matters arising from, or in connection with, the information/research distributed.
SOLUSDT Looking BearishHi
SOLUSDT has the potential to pulse up and break the 129.83 level. The break of the 129.83 will need to be clear, a clean breakout, and the we have two potential target support areas for a bias of 122.49.
Happy Trading,
K.
This is not financial advice

XAUUSD: Bulls Reach Full Targets; Start SellingToday the bullish momentum remained very strong. First, the market reached our initial target at 4228–4232, then moved up to 4250–4260, and eventually even surged to 4285, completing the final 4280 objective.
However, after reaching this area, the strength of the bulls clearly began to slow. On the one hand, we are approaching the market close, and trading activity is naturally fading. On the other hand, today’s rise has already been substantial, and gold is approaching the key 4300 level, where bullish pressure becomes significant.
Therefore, I plan to begin positioning a base short position. If prices continue to rise into the 4290–4310 zone, I will continue adding to the position to capture a pullback opportunity. The initial target is around 4260, followed by 4250. If the price extends above 4300, these targets will be adjusted upward accordingly, for example toward the 4270 area.

NZDUSD: Bullish Order Flow For Two weeks Now! Buy It!Welcome back to the Weekly Forex Forecast for the week of Dec. 8 - 15th.
In this video, we will analyze the following FX market: NZDUSD
NZDUSD is bearish on the HTFs, but has been bullish the last two weeks. Bullish enough to form a change in the state of delivery! The move indicates bullish order flow entering the market!
Wait for the market to confirm its bullish intent with the +FVG it is currently sitting in, and buy it.
Enjoy!
May profits be upon you.
Leave any questions or comments in the comment section.
I appreciate any feedback from my viewers!
Like and/or subscribe if you want more accurate analysis.
Thank you so much!
Disclaimer:
I do not provide personal investment advice and I am not a qualified licensed investment advisor.
All information found here, including any ideas, opinions, views, predictions, forecasts, commentaries, suggestions, expressed or implied herein, are for informational, entertainment or educational purposes only and should not be construed as personal investment advice. While the information provided is believed to be accurate, it may include errors or inaccuracies.
I will not and cannot be held liable for any actions you take as a result of anything you read here.
Conduct your own due diligence, or consult a licensed financial advisor or broker before making any and all investment decisions. Any investments, trades, speculations, or decisions made on the basis of any information found on this channel, expressed or implied herein, are committed at your own risk, financial or otherwise.

GOLD (XAUUSD): bullish-Neutral! Prepare To Buy!In this Weekly Market Forecast, we will analyze the Gold (XAUUSD) for the week of Dec. 8 - 15th.
Gold closed last week indecisive. It has been moving sideways inside a bullish FVG, that continues to act as support.
Prepare for a short term pullback.... and buy it.
Mindful that FOMC is Wednesday, and the USD is weakened with the expectation of a .25 rate cut.
Enjoy!
May profits be upon you.
Leave any questions or comments in the comment section.
I appreciate any feedback from my viewers!
Like and/or subscribe if you want more accurate analysis.
Thank you so much!
Disclaimer:
I do not provide personal investment advice and I am not a qualified licensed investment advisor.
All information found here, including any ideas, opinions, views, predictions, forecasts, commentaries, suggestions, expressed or implied herein, are for informational, entertainment or educational purposes only and should not be construed as personal investment advice. While the information provided is believed to be accurate, it may include errors or inaccuracies.
I will not and cannot be held liable for any actions you take as a result of anything you read here.
Conduct your own due diligence, or consult a licensed financial advisor or broker before making any and all investment decisions. Any investments, trades, speculations, or decisions made on the basis of any information found on this channel, expressed or implied herein, are committed at your own risk, financial or otherwise.
