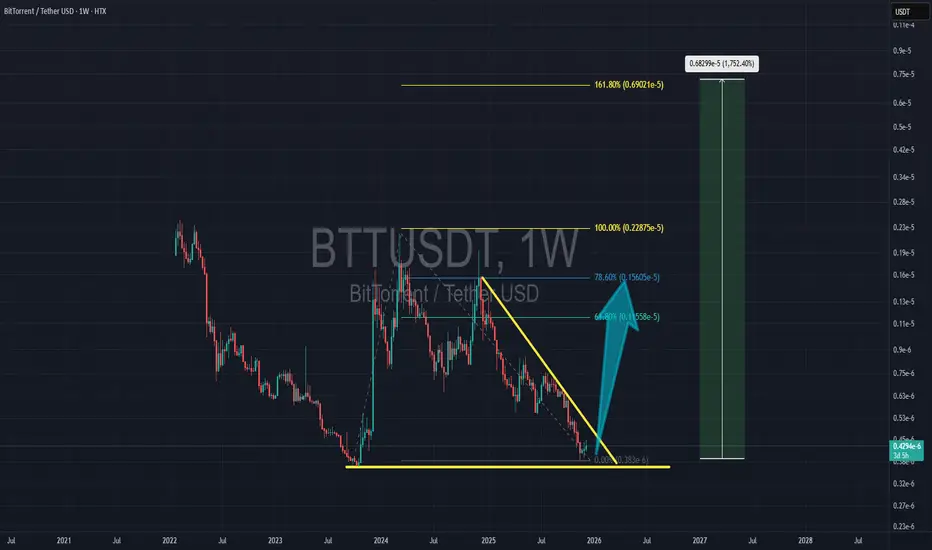
BTT can Rise againBTT is at very bottom price again and it can rise in the coming months to the previous ATH
Support and Resistance
Dollar Index at Critical Support — Is a Big USD Rally Coming?Today I want to analyze the DXY index( TVC:DXY ) for you, which is one of the key indices in the financial markets.
At the moment, the DXY index is moving near a support zone($98.85-$98.50), Monthly Support (1) level, and the 21_SMA(Weekly).
In addition, the DXY has been trending inside a descending channel for roughly the past 13 trading days.
The main question is whether the DXY can break below this confluence of support levels or not.
Looking at the 4-hour chart, we can identify a Morning Star candlestick reversal pattern, and there is also a clear bullish Regular Divergence (RD+) between the last two lows.
Moreover, the US 10-Year Government Bond Yield ( TVC:US10 ) appears bullish in my view — and its upward movement can potentially support a rise in the DXY as well.
From my perspective, the best currency pairs to capitalize on a stronger USD are USDJPY( FX:USDJPY ) and EURUSD( FX:EURUSD ).
We should also keep in mind that several important US economic indicators will be released this week, which could significantly impact market direction. So be extra cautious with your positions, especially during data releases:
JOLTS Job Openings➡️09 December
Federal Funds Rate➡️10 December
FOMC Statement➡️10 December
FOMC Press Conference➡️10 December
Unemployment Claims➡️11 December
I expect that once the DXY breaks above the upper line of the descending channel, it could at least move toward one of the higher Fibonacci levels.
Do you think the U.S. interest rate will be cut this week?
💡 Please respect each other's opinions and express agreement or disagreement politely.
📌U.S. Dollar index Analysis (DXYUSD), 4-hour time frame.
🛑 Always set a Stop Loss(SL) for every position you open.
✅ This is just my idea; I’d love to see your thoughts too!
🔥 If you find it helpful, please BOOST this post and share it with your friends.

BUY BACK ON GOLDclosing my sell position at breakeven and looking forward to go long on a new set up

The downward trend in gold prices is likely to continue.
news:
The Federal Reserve cut interest rates by 25 basis points as expected, fully in line with market expectations.
However, internal opinions diverged the most this year, with the statement signaling a "hawkish rate cut," predicting a very slow pace of easing in the future, with only one rate cut expected in the next two years.
Because this statement was not significantly different from previous market expectations, although it presented a hawkish signal, it was not as strong as previously anticipated. Gold prices initially fell after the data release but then rose, breaking through the key level of 4230 immediately after Powell's speech.
This indicates that the market has largely priced in this data release. With the subsequent release of non-farm payroll and CPI data, if the cooling labor market and inflation cannot be controlled, gold and silver may face another round of declines.
Technical aspects:
1. The daily moving averages MA5 and MA10 are converging and flattening, indicating a sideways price movement. The MACD indicator is also converging and flattening, further suggesting a sideways price movement. Currently, daily support is around the parabolic retracement level and the middle Bollinger Band, corresponding to the 4175-4165 range. In the short term, the daily chart is expected to remain within the large range of 4260-4170.
2. On the 4-hour chart, the MACD is currently consolidating near the zero line with decreasing volume, and the candlestick has also fallen back to around 4200, near the middle Bollinger Band. Currently, all 4-hour moving averages are intertwined around the middle Bollinger Band, indicating that the price is oscillating around this level, within the 4190-4130 range.
3. On the hourly chart, the MACD is currently showing a bearish crossover with increasing volume, and the stochastic oscillator is rapidly moving downwards into oversold territory, indicating a weak and sideways price movement. Short-term support is at the MA60, around 4200. A break below this level will likely lead to further downward movement towards the lower Bollinger Band, currently around 4160.
Strategy Signals:
Buy at 4235-40, stop loss : 4250, target: 4210, 4190, 4160

Price Testing FVG & Fibonacci◆ Market Context
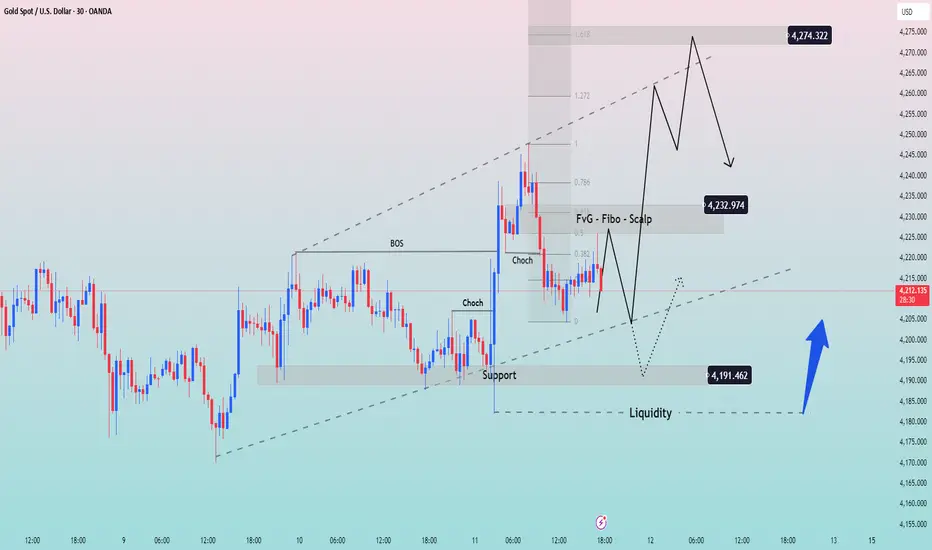
After breaking a bullish BOS, Gold pushed strongly toward 4,232 before losing momentum. Subsequent pullbacks formed a bearish CHoCH, signalling that the corrective wave is weakening and the market needs rebalancing before choosing its next direction.
Price is now sitting inside the short-term ascending channel, near the FVG – Fibo – Scalp zone where strong reactions typically occur.
◆ SMC & Price Action
• The 4,191 support remains a key structural low where strong buying previously broke BOS.
• The FVG around 4,232 is an area where sellers may react since it was created during the fast drop.
• The ascending trendline is still supporting price, but if it breaks, liquidity below 4,191 may be swept before any recovery.
◆ Main Trading Scenarios
➤ Scenario 1: Price rejects the 4,232 FVG → Short-term Sell bias
• Conditions: rejection candle / weakness pattern at 4,230–4,233
• Targets:
▪ 4,210
▪ 4,191 (strong support)
➤ Scenario 2: Price breaks through FVG and extends into Fibo expansion → Look for Sell signals
• Fibo extension targets: 4,255–4,274
• Look for reversal signals to Sell in line with the larger trend.
➤ Scenario 3: Buy from support if liquidity is swept
• Ideal Buy zone: 4,191 → liquidity below 4,185
• Conditions: strong reaction or bullish CHoCH
• Targets:
▪ 4,215
▪ 4,232 (FVG)
◆ Summary
• FVG 4,232 is the key area for short-term trend direction.
• Sell-the-reaction at the FVG remains high-probability.
• If price returns to 4,191 support and holds → potential for a strong Buy.
• If support breaks, market may sweep deeper liquidity before forming a new low.
Nifty levels - Dec 12, 2025Nifty support and resistance levels are valuable tools for making informed trading decisions, specifically when combined with the analysis of 5-minute timeframe candlesticks and VWAP. By closely monitoring these levels and observing the price movements within this timeframe, traders can enhance the accuracy of their entry and exit points. It is important to bear in mind that support and resistance levels are not fixed, and they can change over time as market conditions evolve.
The dashed lines on the chart indicate the reaction levels, serving as additional points of significance to consider. Furthermore, take note of the response at the levels of the High, Low, and Close values from the day prior.
We hope you find this information beneficial in your trading endeavors.
* If you found the idea appealing, kindly tap the Boost icon located below the chart. We encourage you to share your thoughts and comments regarding it.
Wishing you success in your trading activities!

THE Analysis (1H)Considering that THE is currently accumulating liquidity and approaching the supply zone, we can look for sell / short positions in this area.
The targets are marked on the chart.
Do not enter the position without capital management and stop setting
Comment if you have any questions
thank you

NZDUSD: Bullish Trend Continues 🇳🇿🇺🇸
There is a high probability that NZDUSD will continue
rising after a retest of a recently broken horizontal structure.
I expect a growth at least to 0.5814
❤️Please, support my work with like, thank you!❤️
I am part of Trade Nation's Influencer program and receive a monthly fee for using their TradingView charts in my analysis.

SP500 Price consolidating in a bullish structureSP500 is currently consolidating in a bullish structure after successfully holding key support. This stabilization suggests that price may be preparing for another move to the upside.
Technically Wall Street’s main index is expected to remain relatively steady ahead of the closely watched Federal Reserve decision. The Fed is widely expected to deliver a rate cut, although uncertainty remains regarding the extent and pace of potential rate reductions going into 2026.
During the announcement, price may experience temporary volatility—especially upward spikes driven by liquidity grabs. However, the sustained direction will depend entirely on Powell’s tone and forward guidance.
If the market maintains its bullish structure following the Fed release, we could see the SP500 extend higher toward new highs in the 6,924.50 – 7,000.35 zone.
You may find more details in the chart,
Trade wisely best of luck buddies.
Ps; Support with like and comments for better analysis thanks for supporting.

BITCOIN → False breakout of resistance on a downtrend BINANCE:BTCUSDT is consolidating in the range of 86K - 92K, bears are holding resistance amid a global downtrend, traders lack drivers...
Fundamentally, sentiment in the crypto market is weak, and there is increasing talk of a crypto winter, especially among companies that previously actively bought cryptocurrencies for their balance sheets. There is no bullish driver at the moment.
Bitcoin is in a neutral state, with the market holding the price below 93K. The fundamental background is unstable, and technically, the market is in a downtrend. A reversal pattern is forming relative to 92K, and a retest and false breakout of the zone of interest could trigger a decline to the support range.
Locally, we are seeing an upward channel, but this is a correction against the backdrop of the global trend. If the bears keep the price below 92K, the decline may continue. However, a breakout of 94K and a close above that level could trigger an upward momentum...
Resistance levels: 91850, 92700, 93700
Support levels: 88000, 86300
A false breakout and price consolidation in the short zone could cause further sell-offs towards the areas of interest located at the bottom of the trading range.
Best regards, R. Linda!

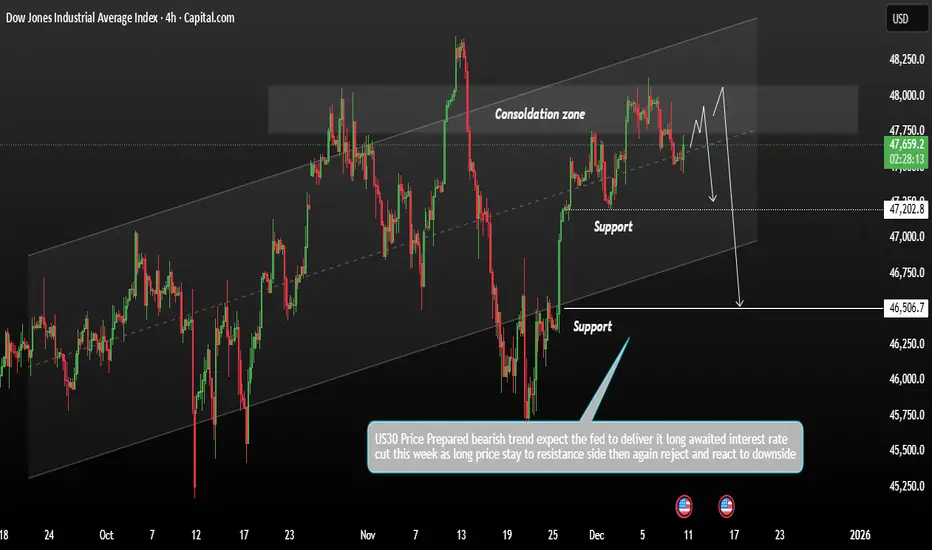
US3O Price Consolidation within its broader bearish momentumUS30 remains in a consolidation phase within its broader bearish trend. After failing to break down convincingly, price may retest overhead resistance before determining the next direction.
Technically Wall Street futures edged slightly higher as traders positioned themselves ahead of one of the most closely watched and divisive upcoming Federal Reserve meetings. Despite this temporary lift, technical structure still favours the bears.
US30 continues to show signs of weakening momentum, and as long as price remains below key resistance levels, bearish control is expected to persist. The index may revisit the support zone between 47,202 and 46,506, which continues to act as an important downside target area.
You may find more details in the Chart.
Trade wisely best of luck buddies.
Ps; Support with like and comments for better analysis thanks for supporting.
XAU/USD – H1 Trading Plan: Buy at OB 4,19x – 4,18x, Targets 4,241. Market Structure (H1)
Gold is retracing back into bullish structure after breaking a series of bullish ChoCH and BoS, forming a new high around 4,24x. The current decline is only a technical pullback because:
• Price is returning to the Buy Order Block at 4,188 – 4,196.
• This zone aligns with trendline support and the demand base that fueled the previous impulse.
• The macro structure remains bullish as long as H1 does not close below 4,188.
→ This is a clear pullback–continuation setup: wait for price to retrace into discount, then target higher zones.
2. Key Levels
🔹 Demand Zone (Buy Zone): 4,188 – 4,196
• Bullish OB
• Trendline support
• Priority BUY area
🔹 Resistance 1: 4,217 – 4,218
• Multiple rejections
• Breakout → next bullish leg
🔹 Resistance 2: 4,238 – 4,239
• 0.5–0.618 Fibo confluence
• Possible mild sell reaction
🔹 Liquidity & Targets:
• 4,259 → Fibo 1.272
• 4,278 → Fibo 1.618 + resting liquidity
3. Trading Plan
🔸 Main Scenario – BUY at OB 4,19x – 4,18x
Conditions:
• Price taps 4,188 – 4,196
• Reversal signals: pin bar, engulfing, or bullish ChoCH
Targets:
TP1: 4,217
TP2: 4,238
TP3: 4,259
TP4: 4,278
Invalidation:
• H1 close below 4,185 → stay out.
🔸 Alternate Scenario – Price goes up without retesting OB
If price holds above 4,210 and breaks 4,217:
• Wait for retest of 4,217
• BUY continuation toward 4,238 → 4,259 → 4,278
Market Outlook
Gold is accumulating and building a base for a stronger breakout. The OB Buy zone 4,19x – 4,18x remains the highest-probability reversal area.

BEL - ShortBEL has shown double top pattern and also broke the trendline support with strong red candle. Either this will go in sideways for few days before breaking down or will go to 400 and then again strong sell may come. TGT - 363-360 in few active sessions (5-10). Highlighted the consolidation areas 393-380.

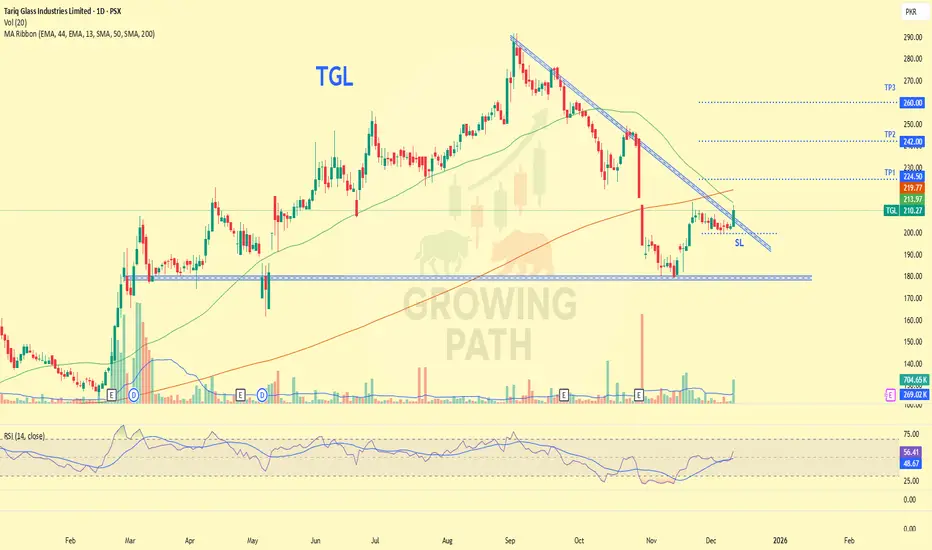
TGL - Technical OutlookTGL (Tariq Glass Industries) is currently testing a key support zone around PKR 210.27, with a potential reversal in sight if the support holds. First buy at PKR 210.27 (CMP) and a second buy if the price drops to PKR 204. Watch for price action to break the descending trendline for a possible uptrend.
Target Levels:
TP1: 224.50
TP2: 242.00
TP3: 260.00
Stop Loss: PKR 200 (below key support).
RSI: 56.41 (neutral) but momentum shifting.
NATGAS Free Signal! Sell!
Hello,Traders!
NATGAS price is reacting from a clear horizontal supply area after an aggressive displacement down, suggesting smart-money orderflow remains bearish. A retest into the imbalance aligns with premium pricing before continuation lower.
--------------------
Stop Loss: 4.724$
Take Profit: 4.527$
Entry: 4.623$
Time Frame: 3H
--------------------
Sell!
Comment and subscribe to help us grow!
Check out other forecasts below too!
Disclosure: I am part of Trade Nation's Influencer program and receive a monthly fee for using their TradingView charts in my analysis.

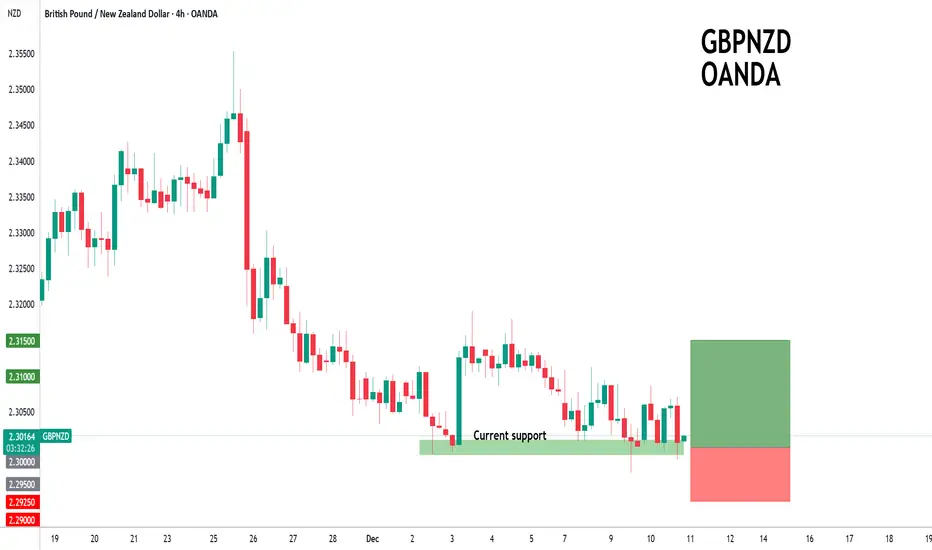
GBPNZD to find buyers at market price?GBPNZD - 24h expiry
The selloff is close to an exhaustion count on the intraday chart.
We expect a reversal in this move.
Risk/Reward would be poor to call a buy from current levels.
A move through 2.3100 will confirm the bullish momentum.
The measured move target is 2.3175.
We look to Buy at 2.3000 (stop at 2.2925)
Our profit targets will be 2.3150 and 2.3175
Resistance: 2.3100 / 2.3150 / 2.3175
Support: 2.3050 / 2.3025 / 2.3000
Risk Disclaimer
The trade ideas beyond this page are for informational purposes only and do not constitute investment advice or a solicitation to trade. This information is provided by Signal Centre, a third-party unaffiliated with OANDA, and is intended for general circulation only. OANDA does not guarantee the accuracy of this information and assumes no responsibilities for the information provided by the third party. The information does not take into account the specific investment objectives, financial situation, or particular needs of any particular person. You should take into account your specific investment objectives, financial situation, and particular needs before making a commitment to trade, including seeking, under a separate engagement, as you deem fit.
You accept that you assume all risks in independently viewing the contents and selecting a chosen strategy.
Where the research is distributed in Singapore to a person who is not an Accredited Investor, Expert Investor or an Institutional Investor, Oanda Asia Pacific Pte Ltd (“OAP“) accepts legal responsibility for the contents of the report to such persons only to the extent required by law. Singapore customers should contact OAP at 6579 8289 for matters arising from, or in connection with, the information/research distributed.
XAUUSD 10Dec 2025 🔥 Gold (XAUUSD) Trade Plans | 30M Chart
- Pullback Short (Scalp):
Sell 4,212-4,219 | SL: 4,220 | TP: 4,190
- Main Long (Distribution): Buy 4,181-4,172 | SL: 4,163 | TP: 4,260
Smart Money Concepts: Targeting pullback into demand zone, then bullish distribution! 🚀
_Not financial advice._
#Gold #SMC #Trading"

Bitcoin Analysis – Market in a Fog of DoubtAlright traders, let’s jump into today’s analysis and see what the market is telling us 👇
As you can see, we’re still in that same area I told you about before —
we’re inside the secondary trend on the daily timeframe, meaning we’re simply correcting the larger downtrend we already had.
On the 4H timeframe, we still can’t call this an uptrend.
Why?
Because even though we are forming higher lows, buyers still don’t have enough strength to print higher highs — they keep creating equal highs instead.
So for now, the 4H trend is unclear ❗️
🎯 Key Levels That Define Everything
There are two major levels that will break this indecision:
93,500
89,100 – 89,800 zone
Whichever side breaks first — that’s where I’ll take a position with momentum.
Especially the 89,100 level, because that one matches my higher-timeframe bias.
📉 Risky Short Setup
I’ve also set a risky short trigger at 92,000.
This one needs another clean reaction before entering —
but if we get that reaction, it gives us a decent short setup.
⏳ Why Lower Timeframes Matter Right Now?
Because on higher timeframes we’ve just reached a support area,
and the market needs time to show a proper reaction.
That usually takes a while.
So right now:
✔️ Most confirmations come from lower timeframes
✔️ We secure profits quickly
✔️ We avoid holding long trades with no clear trend
That’s it for today’s analysis ❤️🔥
Make sure to listen to Powell’s speech tonight,
and never forget your risk management.
Stay profitable and stay sharp! 💰🔥

USDCHF | Long IdeaUSDCHF tapped into Previous Weekly Low and showed a reaction.
I am bullish on this so these are the POI's I look for to make entry.
If price closes under this level, I will be looking for lower POI's to find a new entry points.
Let me know what you think.
Stay safe out there and do your own due diligence, this is not investment advise!

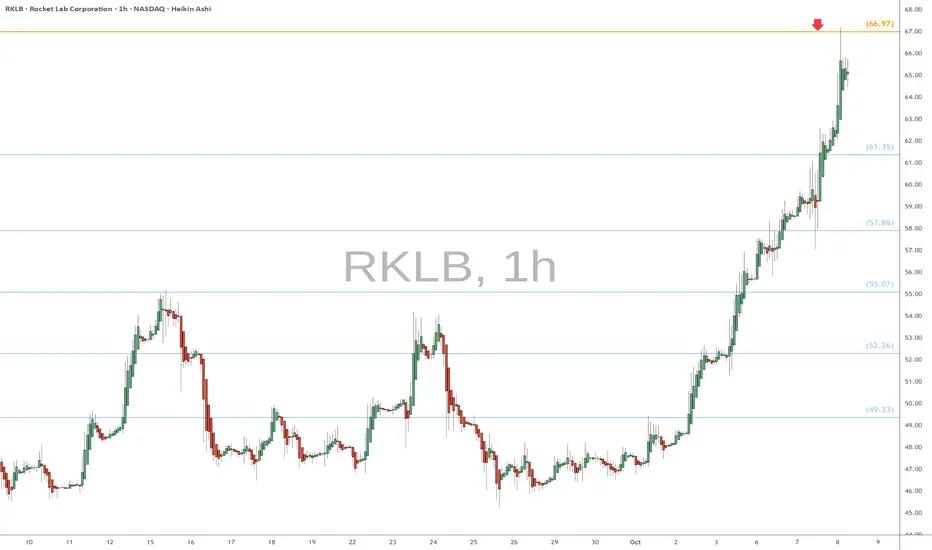
RKLB eyes on $66.97: Golden Genesis fib could make for a TOP RKLB rocketing (lol) from the last Golden Genesis break.
Now approaching the next Golden Genesis fib at $66.97
Look for a Dip-to-Fib or Break-n-Retest for next move.
.
Previous heads-up at last Golden Genesis:
Hit BOOST and FOLLOW for more such PRECISE and TIMELY charts.
========================================================
.
Dax to the upside!Hi
on the 4h TF. Dax bounced strongly from the bottom to break a critical resistance level then went to the next resistance then broke through it to the upside and even bounced up from after it settled on with a pin bar 4H candle and that is the big view of the DAX based on the 4H TF.
3 TPs are there, however, if you accept and tolerate the bearish pullbacks on the journey to TP3, as long the last support level or (the above line) will not be broken by a 4H candle (closing price not by a wick) then TP3 will be your main and real target on DAX.
Fundamentally the next week will offer the Fed interest rate decision which has strong expectations of another rate cut! and may we see currently the preparation on the chart for that move!
Note:
Please do not share or copy my own work! It reflects my own vision and view to that index and it is advertised to not be taken as a legal advice for traders to follow, however, it is not more than an own opinion and analysis to be shared with you!
Good luck ;)


NZDUSD: Bullish Order Flow For Two weeks Now! Buy It!Welcome back to the Weekly Forex Forecast for the week of Dec. 8 - 15th.
In this video, we will analyze the following FX market: NZDUSD
NZDUSD is bearish on the HTFs, but has been bullish the last two weeks. Bullish enough to form a change in the state of delivery! The move indicates bullish order flow entering the market!
Wait for the market to confirm its bullish intent with the +FVG it is currently sitting in, and buy it.
Enjoy!
May profits be upon you.
Leave any questions or comments in the comment section.
I appreciate any feedback from my viewers!
Like and/or subscribe if you want more accurate analysis.
Thank you so much!
Disclaimer:
I do not provide personal investment advice and I am not a qualified licensed investment advisor.
All information found here, including any ideas, opinions, views, predictions, forecasts, commentaries, suggestions, expressed or implied herein, are for informational, entertainment or educational purposes only and should not be construed as personal investment advice. While the information provided is believed to be accurate, it may include errors or inaccuracies.
I will not and cannot be held liable for any actions you take as a result of anything you read here.
Conduct your own due diligence, or consult a licensed financial advisor or broker before making any and all investment decisions. Any investments, trades, speculations, or decisions made on the basis of any information found on this channel, expressed or implied herein, are committed at your own risk, financial or otherwise.
