GOLD | Short ideaGold tapped into the previous monthly high and since then been trending down.
Now it is at a key level where I expect Gold to reject and make a move down.
A reaction has been there already, it is very volatile so tread carefully.
Let me know what your analysis is!
Stay safe out there and do your own due diligence, this is not investment advise!
Support and Resistance

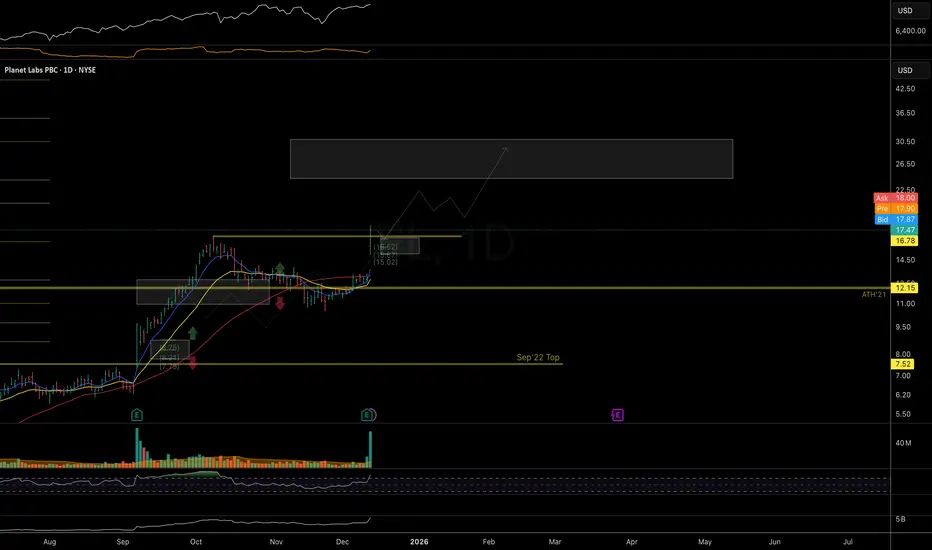
PL: room to follow-through Price continues to follow the macro bullish trend structure outlined in the September updates. Watching for further follow-through into the next 24–30 resistance zone.
The earnings gap may offer a delayed-reaction setup if we see a constructive, low-volume pullback in the coming days - ideally with price holding above the 15 local support.
Chart:
Macro view (Weekly):
Previously:
• On macro bullish-trend structure (Sep 14):
www.tradingview.com
• On resistance zone and pullback (Sep 26):
www.tradingview.com
EURUSD - 12/ 12/25 - day tradeYesterday had a major bullish push up in EURUSD. Now with a correction in play during this Friday, i would like to take a trade in the direction of the short term correction.
- Sub structure bearish Break of structure in play
- Market Structure suggesting further bearish action.
Small doji and imbalance identified on the 1 hour chart and a bearish trade placed to take out the imbalance below and read the area identified. the demand zone that broke the structure to the bullish side.


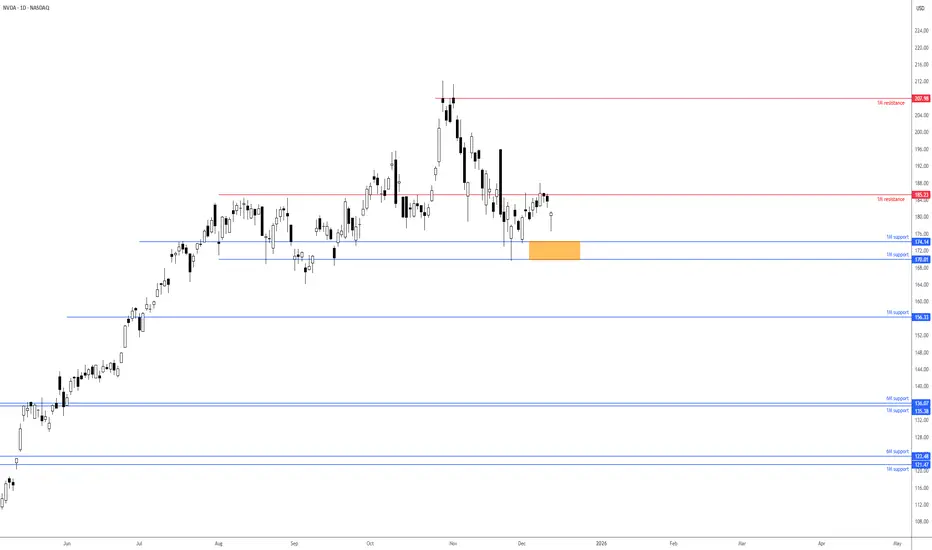
NVDA breakout will help determine near-term direction Shares of Nvidia took a hit during Thursday’s session, losing about 1.5%. Technically, the trend remains northbound, though near-term price action has shown a few lower lows and lower highs: early signs of a downtrend.
1M resistance recently made a show at US$185.23 and withstood a few upside attempts. 1M support is nearby between US$170.01 and US$174.14, with a break under here unbolting the door to another layer of 1M support from US$156.33. Alternatively, pushing above US$185.23 would help bolster the long-term trend, and potentially attract fresh buying to 1M resistance at US$207.98, closely shadowed by the all-time high of US$212.19.
Ultimately, the direction of travel for this Stock will depend on whether it breaks above resistance at US$185.23, encouraging buying, or below the support zone between US$170.01 and US$174.14, which could prompt further underperformance.
Written by the FP Markets Research Team
Bitcoin Price Update Clean Clear ExplanationBitcoin trading inside a wide consolidation zone, with price currently hovering around the mid-range near 90K Multiple supply and demand zones are highlighted, giving a clear picture of where strong buying or selling reactions may occur.
If Bitcoin holds above the current minor support and builds momentum, price may Push upward through the mid-range resistance retest higher supply zones between 93K / 94K then continue climbing toward the upper rejection zone shown in the chart this scenario represents a continuation of the bullish trend if buyers stay in control.
If the price fails to hold above the local support levels breakdown is expected toward the major support at 87K if this zone also fails, the chart projects a deeper drop into the heavy demand zone around 84K this represents a potential shift from consolidation to bearish retracement, where sellers regain strength.
If you found this analysis helpful free, free to leave a comments and share thanks.

GOLD (XAUUSD): To All-Time High
As I predicted earlier, Gold finally violated our current daily resistance
and set a new local higher high higher close with a confirmed bos.
We can expect a bullish continuation to a resistance based on
a current ATH now.
Goal - 4353
❤️Please, support my work with like, thank you!❤️
I am part of Trade Nation's Influencer program and receive a monthly fee for using their TradingView charts in my analysis.

Waiting for Premium Pullback Buy the Bullish Continuation1. Market Context & Structure (H1)
• After a prolonged consolidation phase, Gold has delivered a clear bullish BOS, breaking above the previous highs around 4,24x–4,25x.
• The current impulse originated from the EQL → OB 4,209 zone, confirming active buying flow and a shift into a short-term uptrend.
• Price is now trading above the Premium Zone at 4,265; any pullback into this area is considered a technical retracement within the bullish trend.
2. Key Technical Zones
• Main OB – Demand: around 4,209 → Origin of the current bullish leg; a strong BUY zone if price holds.
• Premium Pullback Buy Zone: 4,265 – 4,270 → First discount after BOS; priority area to look for BUY setups.
• Target 1 – Reaction Zone: 4,322 – 4,323 → Fibo 0.5–0.618 confluence; potential profit-taking / short-term sell reaction.
• Target 2 – Extension Zone: 4,366 – 4,367 (Fibo 1.272) → Bullish extension target and potential liquidity sweep zone.
3. Trading Scenarios
Main Scenario – Trend BUY at Premium Zone
• Wait for pullback to 4,265 – 4,270.
• Look for confirmation: long lower wicks, bullish engulfing, or bullish ChoCH on M15–H1.
• Execute BUY with trend continuation.
TP1: 4,322
TP2: 4,366
• Partial TP at TP1, move SL to BE, hold remainder to TP2.
• Invalidation: H1 close below 4,258 → pause BUY scenario.
Scenario 2 – Deep BUY at OB 4,209
• If price breaks Premium decisively and drops to OB 4,209, do not catch a falling knife.
• Wait for strong bullish reaction and reversal structure (new HL, bullish ChoCH).
TP: 4,265 → 4,322
4. Risk Management Notes
• Avoid FOMO BUY at highs after strong bullish candles.
• SELL setups are only short-term reactions, not the main bias.
• Bias remains BUY on dips as long as H1 holds above 4,209.

CHF-JPY Bullish Breakout! Buy!
Hello,Traders!
CHFJPY breaks above a well-defined supply zone with strong bullish displacement, confirming a shift in market structure. The breakout signals smart money strength, with upside liquidity now exposed. A brief pullback may occur, but continuation toward higher targets remains favoured. Time Frame 4H.
Buy!
Comment and subscribe to help us grow!
Check out other forecasts below too!
Disclosure: I am part of Trade Nation's Influencer program and receive a monthly fee for using their TradingView charts in my analysis.

Nifty levels - Dec 15, 2205Nifty support and resistance levels are valuable tools for making informed trading decisions, specifically when combined with the analysis of 5-minute timeframe candlesticks and VWAP. By closely monitoring these levels and observing the price movements within this timeframe, traders can enhance the accuracy of their entry and exit points. It is important to bear in mind that support and resistance levels are not fixed, and they can change over time as market conditions evolve.
The dashed lines on the chart indicate the reaction levels, serving as additional points of significance to consider. Furthermore, take note of the response at the levels of the High, Low, and Close values from the day prior.
We hope you find this information beneficial in your trading endeavors.
* If you found the idea appealing, kindly tap the Boost icon located below the chart. We encourage you to share your thoughts and comments regarding it.
Wishing you success in your trading activities!

GBPCHF LOCAL LONG|
✅GBPCHF is approaching a key ICT demand zone after a corrective pullback. Price is likely to retest demand to mitigate imbalance and fill inefficiency before bullish continuation. Expect renewed displacement toward buy-side liquidity once demand is respected. Time Frame 6H.
LONG🚀
✅Like and subscribe to never miss a new idea!✅

BankNifty levels - Dec 15, 2025Utilizing the support and resistance levels of BankNifty, along with the 5-minute timeframe candlesticks and VWAP, can enhance the precision of trade entries and exits on or near these levels. It is crucial to recognize that these levels are not static, and they undergo alterations as market dynamics evolve.
The dashed lines on the chart indicate the reaction levels, serving as additional points of significance. Furthermore, take note of the response at the levels of the High, Low, and Close values from the day prior.
We trust that this information proves valuable to you.
* If you found the idea appealing, kindly tap the Boost icon located below the chart. We encourage you to share your thoughts and comments regarding it.
Wishing you successful trading endeavors!

This Is Why GBPUSD Could Spike Hard USD Fundamentally Broken!Hey Traders, in today’s trading session we are monitoring GBPUSD for a buying opportunity around the 1.33500 zone.
GBPUSD is trading in a clear uptrend and is currently in a correction phase, approaching the trend area at 1.33500, which acts as a key support and resistance zone.
On the fundamental side, the US Dollar remains under pressure after the Fed’s recent 25 bps rate cut, which aligns with a broader shift toward easing. With markets now hyper-focused on labor market data, any sign of softness could increase expectations for another cut. The January FOMC isn’t fully priced for additional easing yet — which leaves room for more USD weakness, supporting GBPUSD’s bullish bias.
Trade safe,
Joe.

GOLD → Positive fundamental background. Focus on 4200 FX:XAUUSD is testing the $4,250 level amid news momentum related to interest rate cuts. The fundamental backdrop is improving, with the dollar entering a downward trend...
The Fed cut rates by 25 basis points to 3.75%, as expected. Powell's tone was cautious rather than hawkish, which weakened the dollar and Treasury yields. The market expects two rate cuts next year, compared to one in the Fed's forecasts
- Focus has shifted to US employment data (jobless claims). The next key risk will be next week's NFP data.
The Fed's decision provided support for gold, but for growth above $4250, confirmation of a weakening labor market in upcoming reports will be needed. Technically, the focus is on the 4200-4220 zone.
Resistance levels: 4220, 4250, 4260
Support levels: 4200, 4180, 4175
Consolidation above 4200 will confirm the bullish sentiment, while a breakout and consolidation above 4220 will open up a new chance for growth towards the resistance of the range.
I do not rule out the possibility of a retest the support of the range at 4181 before moving up (the price is still in a sideways trend).
Best regards, R. Linda!

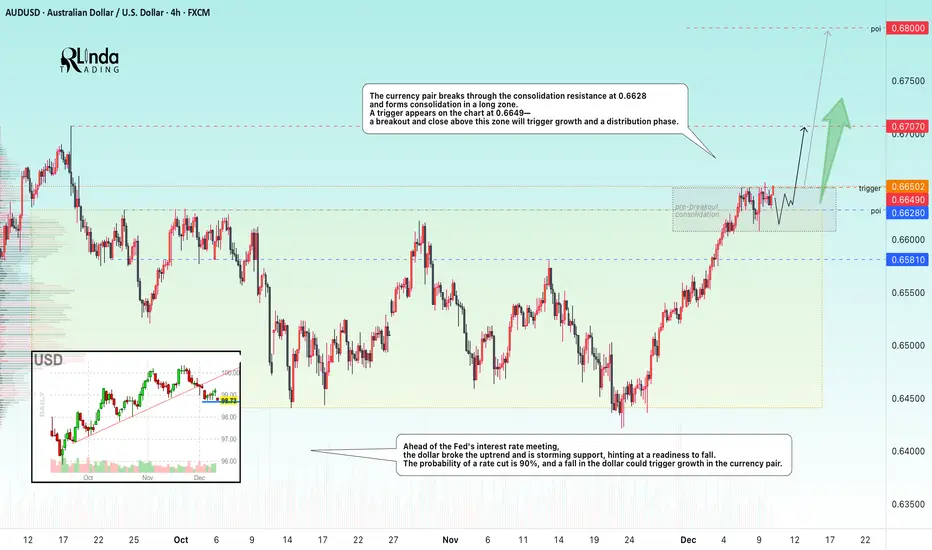
AUDUSD → Readiness for distribution within the uptrend FX:AUDUSD breaks through the resistance of a wide trading range (consolidation) and is preparing for growth. Important news ahead...
Ahead of the Fed's interest rate meeting, the dollar broke its upward trend and is storming support, hinting at a readiness to fall. The probability of a rate cut is 90%, and a fall in the dollar could trigger growth in the currency pair.
The currency pair is breaking through the consolidation resistance at 0.6628 and forming consolidation in a long zone. A trigger of 0.6649 appears on the chart - a breakout and close above this zone will trigger growth and a distribution phase.
Resistance levels: 0.6649, 0.67, 0.68
Support levels: 0.6628, 0.6581
Before rising, the price may test support (the previously broken trading range boundary). However, a breakout and close above 0.6649 could trigger a distribution phase towards 0.67-0.68, especially against the backdrop of a weak dollar...
Best regards, R. Linda!
Fed Just Opened the Door — USDJPY Could Bleed Hard!!Hey Traders, in today’s session we are monitoring USDJPY for a selling opportunity around the 156.300 zone. The pair continues to trade within a broader downtrend, and price is now retracing toward a key trend + S/R confluence at 156.300 — an area that has consistently acted as a supply zone for sellers.
Technical Structure
USDJPY remains in a bearish market structure (lower highs / lower lows).
Current pullback is approaching the 156.300 correction zone, where downside continuation becomes highly probable.
Dollar Macro Backdrop: Perfect Storm for USD Weakness
On the other side, DXY broke below its uptrend and is now pulling back toward the 98.800 retracement zone, confirming a broader shift in momentum.
The fundamentals are even more compelling:
1. The Fed did cut yesterday — 25bps.
This reinforces a clear dovish turn, and historically the USD underperforms aggressively in the weeks following the first cut of a new cycle.
2. The Fed's balance sheet is expanding again.
An expanding balance sheet = USD bearish liquidity environment.
3. The January FOMC is currently NOT priced for a cut — and that’s the opportunity.
The market is underpricing the risk of back-to-back cuts.
Now labor market data becomes the main catalyst.
And the reality is:
If we get any sign of further labor market weakness — which is increasingly likely — the market will start pricing in a January cut very fast.
And that leaves MUCH more room for USD weakness across the board.
Trade Focus
Monitoring price reaction at 156.300 for a bearish continuation setup.
If DXY resumes weakness out of 98.800 and labor data disappoints, USDJPY could accelerate aggressively to the downside.
Trade safe,
Joe.

EUR-CHF Free Signal! Buy!
Hello,Traders!
EURCHF reacts strongly from a well-defined SMC demand zone after a liquidity sweep below equal lows. The sharp displacement confirms smart money absorption, with price now poised for a corrective push higher into the nearest inefficiency and premium objective.
--------------------
Stop Loss: 0.9311
Take Profit: 0.9346
Entry: 0.9326
Time Frame: 4H
--------------------
Buy!
Comment and subscribe to help us grow!
Check out other forecasts below too!
Disclosure: I am part of Trade Nation's Influencer program and receive a monthly fee for using their TradingView charts in my analysis.

CRUDE OIL Bearish Bias! Sell!
Hello,Traders!
CRUDE OIL taps into a fresh SMC supply pocket after a clean liquidity grab and shifts order flow bearish. The current pullback simply mitigates the breaker before another leg down unfolds toward discounted pricing. Time Frame 4H.
Sell!
Comment and subscribe to help us grow!
Check out other forecasts below too!
Disclosure: I am part of Trade Nation's Influencer program and receive a monthly fee for using their TradingView charts in my analysis.

USDCAD // Upward follow-up can be done, including the yellow line support. Cutting losses on continuations that can be kept below the yellow line would be the right decision.

Gold 4 HGold has now broken the range and retested it. Next resistance is at 4330 - 4380 zone. If it breaks that we are getting new highs and if it reverses then we get back to 4263 zone or maybe even lower.

DeGRAM | GOLD will rebound to the $4370 level📊 Technical Analysis
● XAU/USD trades within a rising channel, respecting the ascending support line while printing higher lows. Repeated consolidations above 4,190–4,200 confirm strong demand and controlled bullish structure.
● Price is compressing below the upper trend resistance near 4,285–4,300, forming a continuation range that favors an upside breakout toward the major resistance at 4,370.
💡 Fundamental Analysis
● Gold remains supported by expectations of softer US monetary policy and persistent geopolitical risks, which continue to underpin demand despite short-term USD fluctuations.
✨ Summary
● Bullish bias above 4,200. Upside targets: 4,300 → 4,370. Key support: 4,190–4,200.
-------------------
Share your opinion in the comments and support the idea with a like. Thanks for your support!

EURNZD FREE SIGNAL|SHORT|
✅EURNZD rejects the supply level after engineering a liquidity sweep above prior highs, shifting order flow bearish as price displaces downward. The current retracement simply returns to a premium zone before further repricing lower.
—————————
Entry: 2.0202
Stop Loss: 2.0246
Take Profit: 2.0141
Time Frame: 5H
—————————
SHORT🔥
✅Like and subscribe to never miss a new idea!✅

XAG/USD: Price at the Upper Boundary of an Ascending ChannelAnalyzing the XAG/USD chart, we can identify a well-defined ascending channel that contains the broader uptrend originating in early September.
Within this structure, several important technical observations stand out:
The median line of the channel acted as dynamic support and triggered a bullish reaction on December 4.
The line that divides the upper half of the channel into quarters has demonstrated a clear role reversal: it served as resistance earlier in the month and later turned into support around December 10.
The current silver price is trading near the upper boundary of the channel, which may function as a significant resistance level — similar to what was observed in mid-October.
Given these factors, it is reasonable to assume that the market may be extremely overheated, increasing vulnerability to a corrective move. If this scenario unfolds, a bearish break of the steep ascending trajectory cannot be ruled out, especially considering that silver has rallied by approximately 30% from the November 21 low.
