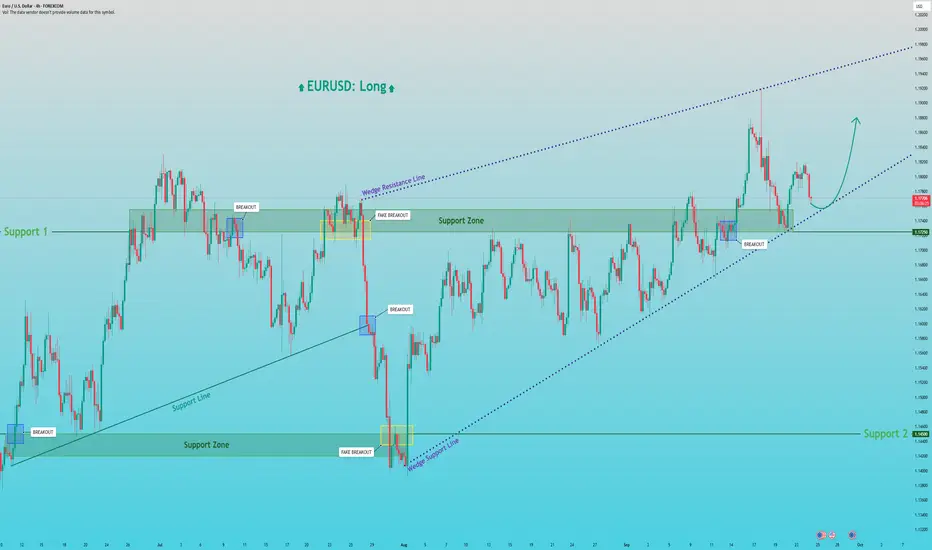
EURUSD: Rally from Wedge Support to 1.1880Hello everyone, here is my breakdown of the current Euro setup.
Market Analysis
A prior uptrend failed, leading to a sharp drop down to the major Support zone 2 around the 1.1450 level. However, strong buying pressure emerged from that low, initiating a powerful reversal and establishing the current market structure.
This new bullish phase has formed a well-defined Upward Wedge. The price successfully broke through Support 1 and tested the wedge's resistance. Currently, it's in a healthy corrective pullback and is testing the ascending support line of this wedge, which is a key area to watch.
My Scenario & Strategy
I'm looking for the price to complete its correction and find a solid floor on the ascending support line. A confirmed bounce from this dynamic support would be the key signal that the next impulsive move up is about to begin.
Therefore, the strategy is to watch for this bounce. A successful rebound would validate the long scenario. The primary target for the next wave higher is 1.1880, which would represent a new structural high within the Upward Wedge.
That's the setup I'm tracking. Thank you for your attention, and always manage your risk.
Supportandresistancezones
Master Horizontal Lines on Trading Charts | Signal & Structure 2In this second episode of the Signal and Structure series, we dive deep into one of the most fundamental yet powerful tools in technical analysis - horizontal support and resistance lines. This practical tutorial demonstrates a systematic approach to identifying and marking key price levels across multiple timeframes.
What You'll Learn:
Color-Coded Line System for Multiple Timeframes:
Monthly (Black, thickness 4) - The strongest levels from monthly candle closes
Weekly (Maroon/Brown, thickness 3) - Key weekly support/resistance zones
2-Day (Red, thickness 2) - Intermediate term levels
12-Hour (Orange, thickness 1-2) - Short-term trading levels
3-Hour (Yellow, thickness 1) - Day trading reference points
Key Concepts Covered:
Why monthly candle closes often matter more than wicks (with live examples)
How previous resistance becomes new support - demonstrated on Bitcoin's chart
Identifying distribution and accumulation ranges using horizontal levels
The importance of avoiding chart clutter - when NOT to add more lines
Using transparent candles to see through to your levels and indicators
Practical Techniques:
Live demonstration on TradingView using Bitcoin/USD charts
How to identify the most significant levels from each timeframe
Creating "boxes" to visualize trading ranges and distribution zones
Brief introduction to Wyckoff theory concepts (spring patterns)
Tips for maintaining clarity when working with multiple overlapping levels
Chart Setup Tips:
Why exchange charts (KuCoin, Gate.io) provide better volume data than index charts
Continuing emphasis on logarithmic scale for crypto analysis
How to organize your workspace for multi-timeframe analysis
This 20-minute tutorial walks you through the exact process of building a professional-grade support and resistance framework on your charts. The presenter demonstrates each concept in real-time on TradingView, making it easy to follow along and implement these techniques immediately.
Perfect for traders who want to move beyond random line drawing and develop a systematic, color-coded approach to identifying key market levels. Whether you're scalping on the 3-hour or position trading on the monthly, this hierarchical system helps you see exactly where the important levels are at a glance.
Next episode preview: Diagonal trend lines, channels, and Fibonacci levels - including a unique approach to stacking channels that provides an edge in the markets.

From 4800 Highs to 3850 Lows – ETH Eyes RecoveryAfter a fresh test of the 4800 zone in mid-September, ETH started to decline, with the selloff accelerating after September 22nd, in line with the broader crypto market weakness.
The drop broke below the 4100 technical support and even under the psychological 4K mark, sending price as low as 3850.
Yesterday, however, ETH managed to recover part of the losses and climbed back above 4K, a positive sign for the bulls.
From a structural point of view, the overall trend remains strongly bullish, and I see this move as nothing more than a correction and a hunt for liquidity at lower levels.
Trading Outlook:
• In the coming days, I expect ETH to reclaim the 4100 zone, turning the breakdown into a false break.
• If that happens, the door opens for upside continuation, with potential to retest 4500 and even challenge the 4800 resistance again.
• For now, I remain on the sidelines, waiting for confirmation before taking a new position.

Bitcoin Drops Below $108.6K — What’s Next?
Bitcoin was holding near $115K, but now it's fallen below the $108.6K level. The next support is around $105K. If that breaks, we could see further downside toward $100K.
To turn bullish again, Bitcoin needs to reclaim $112K as support. If that happens, it could retest $115K–$120K.
#PEACE

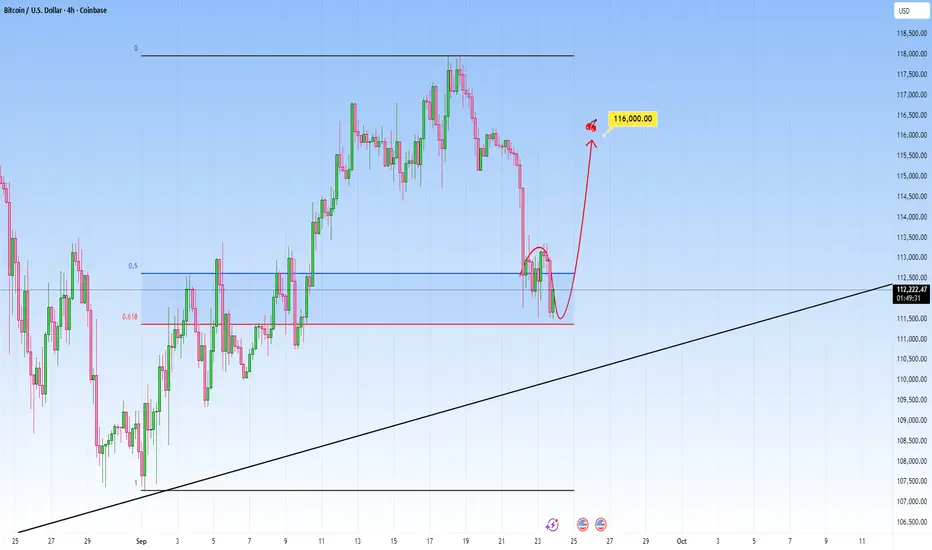
Bitcoin Analysis: Key Level to WatchPrice sold off aggressively, and now it sits within a key reaction area.
We can see price just tapped into the 0.5 and 0.618 Fibonacci retracement level of the last leg up. This is the golden pocket, a place where markets tend to react often.
Now look closely: price is showing early signs of rejection here, with wicks forming and momentum slowing down. If buyers step in here, and hold this zone that is our signals, targeting around the previous high.
But if price breaks clean below it, that invalidates the bullish idea and we could see some more continuation lower.
GBP/JPY - BOJ Holds Rates, Inflation Outlook RisesOANDA:GBPJPY #GBPJPY #Forex #Trading #FXAnalysis #TechnicalAnalysis #PriceAction #BankOfJapan #ForexTrader
The Bank of Japan decided to keep interest rates unchanged while raising its inflation forecast. This shows caution but also optimism that cooperation with the U.S. could support Japan’s economic stability.
On the chart, demand zones (red) are acting as key support, with potential bullish targets around 200.500 – 201.100 (green key zones). If buyers defend these support levels, we could see momentum pushing GBP/JPY toward the upside targets.
Traders should watch price reaction at support for potential long entries.
👍 Support with a like & drop your thoughts in the comments!
⚠️ Disclaimer: This analysis is for educational purposes only and should not be considered financial advice. Always do your own research before making trading decisions.

1D Investment Long CounterTrend TradeCounterTrend Trade
- short impulse
+ support level
- unvolumed T1 level
+ below 1/2 correction?!
+ historical volume zone
+ biggest volume 2Sp-
+ weak test
Calculated affordable virtual stop loss
1 to 2 R/R take profit
Monthly CounterTrend
"- short impulse
+ exhaustion volume
+ broken SOS
+ intiative take over"
Yearly no context

USD/JPY - Bank of Japan Holds Rates, Inflation RisingFX:USDJPY #USDJPY #Forex #Trading #FXAnalysis #TechnicalAnalysis #PriceAction #BankOfJapan #ForexTrader #DayTrading #SwingTrading
The Bank of Japan kept interest rates unchanged while raising its inflation forecast. This signals caution but also optimism that cooperation with the U.S. could help stabilize Japan’s economy.
On the chart, we see key demand zones (red) holding as potential support, with upside targets toward 148.700 – 149.200 (green key zones). If price sustains above the demand area, bullish momentum could push USD/JPY higher into these resistance levels.
Traders should watch for confirmation signals around support before entering long positions.
👍 Support with a like & drop your thoughts in the comments!
⚠️ Disclaimer: This analysis is for educational purposes only and should not be considered financial advice. Always do your own research before making trading decisions.

CADJPY higher bullish for expect
OANDA:CADJPY nice construction we have, PA is breaked, currently price is break and zone which is placed above top PA line, from here having higher bullish expectations.
SUP zone: 106.800
RES zone: 108.000, 108.300

MARIPSX MARI :: Day Level
📈 MARI Trading Recommendation
Current Market Price (CMP): PKR 685
💎 Bullish Bias: BUY & HOLD
✅ My clear view: MARI is a strong buy for long-& Mid term investors. Fundamentals are solid, and the recent dividend announcement strengthens the positive outlook.
💹 Long-Term Investors:
Enter at the current price for early entry and hold for very strong returns.
Support Levels for Accumulation (if price dips):
🔹 654 (immediate support; key level after breaking smaller range Jan–Sep 2025)
🔹 643
🔹 620
🔹 610
This allows accumulating MARI at discounted prices while maintaining a bullish long-Mid term view.
📊 Technical Outlook:
Range Bound: Since January 2024, MARI has been trading in a broader range of 590–744.
Resistance: 723–744
Support: 590–612
Smaller Positive Range: 605–654, which has been positively broken.
654 now acts as key support.
⚡ Intraday / Short-Term Traders:
Monitor daily price action carefully. Not recoomended for intraday Trading but can manag as per below:
Rule: Do not hold if the price closes below 654 with a bearish candle on the daily chart.
A break below may lead to pullbacks toward 643–610.
Target TP1: 723 TP2: 744
Pattern: Formation of a bullish flag indicating potential upward movement.
✅ Summary:
Long-Mid term: Buy & hold 💎
Short-term: Watch 654 closely ⚡
Market sentiment favors upward movement, making MARI attractive for both accumulation and swing trading.

B Short 1H Aggressive CounterTrend TradeAggressive CounterTrend Trade
- long impulse
+ biggest volume T1
+ exhaustion volume
+ resistance level
+ biggest volume Ut
+ weak test
- below first bullish bar close entry
Calculated affordable virtual stop loss
1 to 2 R/R take profit
1D CounterTrend
"- long imluse
- neutral zone
- volume distribution long
+ exhaustion volume"
1M CounterTrend
"- long impulse
+ volumed interaction bar"
1Y countertrend
"- long impulse
+ volumed T1 level
+ resistance level"

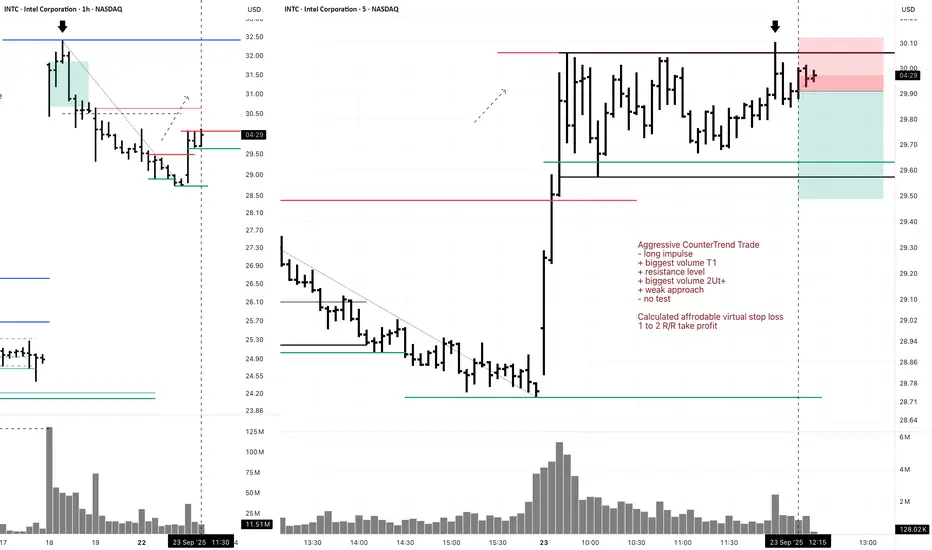
INTC Short 5M Aggressive CounterTrend Day TradeAggressive CounterTrend Trade
- long impulse
+ biggest volume T1
+ resistance level
+ biggest volume 2Ut+
+ weak approach
- no test
Calculated affordable virtual stop loss
1 to 2 R/R take profit
1H CounterTrend
"- long impulse
+ T1 level
+ resistance level
+ 1/2 correction?"
1D CounterTrend
";- long impulse
+ expanding CREEK / TE
+ exhaustion volume
- too high
+ correction to 1/2"
1M Trend
"+ short impulse
+ T2 level
+ resistance level
+ 1/2 correction"
1Y CounterTrend
"- long impulse
+ correction
- 1/2 of impulse
- biggest volume"
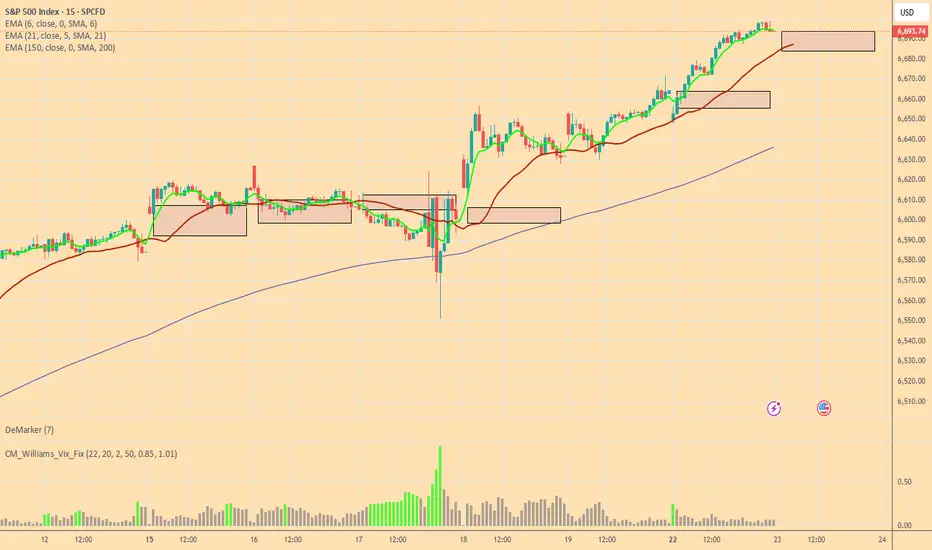
Bulls and Bears zone for 09-23-2025Last two trading sessions Bulls were very active. Hopefully, Bulls will continue the trend and make 3 sessions in a row.
Level to watch : 6752 --- 6750
EUR/AUD - Selling Pressure Below 1.7850 (22.09.2025)#EURAUD #Forex #Trading #TechnicalAnalysis
EUR/AUD – Channel Breakout Pattern (30M)
EUR/AUD has broken below the rising channel, confirming a bearish reversal after completing a Head & Shoulders pattern at the top.
🔹 Market Structure:
Clear rejection from the resistance zone (1.7850 – 1.7860)
Breakdown of the bullish channel support
Head & Shoulders formation adding to bearish momentum
🔹 Key Levels:
1st Support: 1.7715
2nd Support: 1.7710
📉 Trading Idea:
As long as EUR/AUD stays below the channel resistance, selling pressure could drive price toward the support levels.
🎁 Please hit the like button and
🎁 Leave a comment to support for My Post !
Your likes and comments are incredibly motivating and will encourage me to share more analysis with you.
Best Regards, KABHI_TA_TRADING
Thank you.

NEAR/USDT - Bearish Outlook for short Term BINANCE:NEARUSDT NEAR/USDt - Channel Breakout with strong volume, looking for strong bearish in upcoming days.
As altcoin momentum intensifies, Near Protocol
NEARUSDT is rapidly emerging as a standout contender in the crypto space. Fueled by strong fundamentals and recent bullish market trends, NEAR’s rise has caught the attention of both retail and institutional investors.
With NEAR now bridging to Solana and TON via Chain Signatures, the future looks promising. Wondering where it’s headed next? Dive into our in-depth NEAR Price Prediction
However, if bearish pressure takes over and breaks the $2.0 to $1.8 support zone, a further decline is likely, with the $1.0 level becoming the next probable target.
Support by Likes and Comments.
Thank you.

TGKA 5M Long Aggressive CounterTrend DayTradeAggressive CounterTrend Trade
- short impulse
+ biggest volume T1
+ volumed 2Sp+ ?
- T2 level
- resistance level
Calculated affordable virtual stop loss
1 to 2 R/R expandable to swing take profit
1H CounterTrend
"- short impulse
+ biggest volume T1
+ support level
+ volumed interaction bar
- reaction bar went lower"
1D Trend
"+ long impulse
+ biggest volume expanding T2 level
+ support level
+ below 1/2 correction
+ volumed interaction bar"
1Y no context

EUR/USD - Rising Wedge Breakout @ H1 CMCMARKETS:EURUSD EUR/USD - Wedge Pattern Strong breakout - @ H1 with high volume. Expecting Strong Bearish outlook today and Fundamental also play major role today.
"The Fed is still signalling more rate cuts, but at the same time still sees okay growth, which is a positive combination for share markets"
The Fed reduced rates by a quarter point on Wednesday, as expected, and indicated it will steadily lower borrowing costs for the rest of this year, initially sending the dollar plunging.
Support by Likes and Comments.
Thank you.

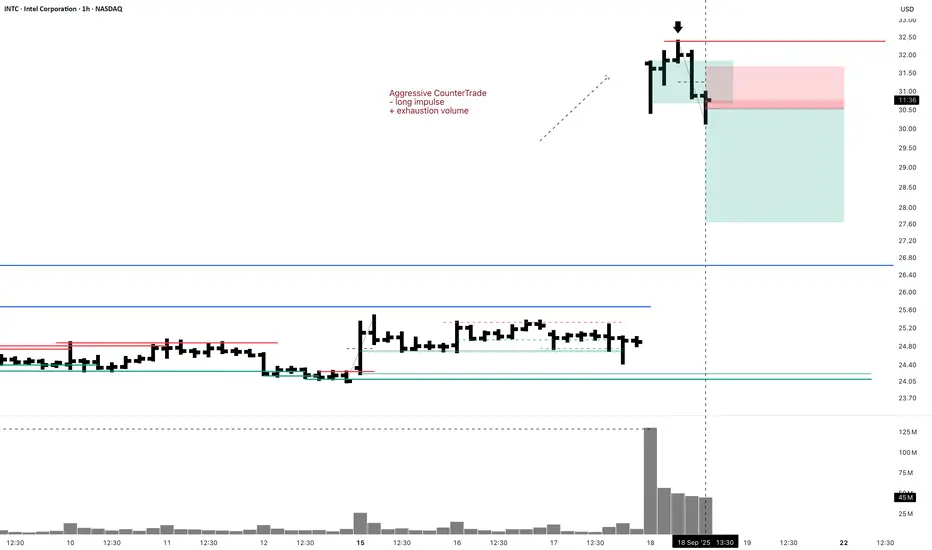
INTC Short Swing 1H Aggressive CounterTradeAggressive CounterTrade
- long impulse
+ exhaustion volume
Daily CounterTrend
"- long impulse
+ expanding CREEK level
+ exhaustion volume
+ too high"
Monthly Trend
"+ short impulse
+ T2 level
+ resistance level
+ 1/2 correction"
Yearly Trend
"- long impulse
+ correction
- 1/2 of impulse
- biggest volume"
GBPUSD1H Short Call
GBPUSD
Support Break (which earlier was stong resistance now was acting as support on confirmation
Short trade Is valid)
Manage your risk and rewards
📊 Key Data Just Released: US UN-Employement Claims
FUNDAMENTALS:
Unemployment Claims: 231K (better than forecast 241K, and much better than 264K prior) → labor market stronger.
Philly Fed Manufacturing: 23.2 (blowout vs 1.7 forecast, -0.3 prior) → economic activity hotter.
👉 This means:
Labor market is not weak, economy looks stronger than expected.
So the 25 bps cut last night will be seen as normal easing, not aggressive.
Aggressive cut scenario is off the table for now, unless Fed signals future cuts.

GBP/USD - Channel Breakout @ H1 (BoE Interest Rate Today)CMCMARKETS:GBPUSD GBP/USD - Channel Breakout with strong volume and today BoE Interest Rate, it gives high movement.
"The Fed is still signalling more rate cuts, but at the same time still sees okay growth, which is a positive combination for share markets"
The Fed reduced rates by a quarter point on Wednesday, as expected, and indicated it will steadily lower borrowing costs for the rest of this year, initially sending the dollar plunging.
Support by Likes and Comments.
Thank you.

USDJPY after FOMC bullish continuation expected
FX:USDJPY expectations are be bearish strong after we are have break of zone 147.000, yesterday after FOMC, today we have changes in market and some volatility.
Price pushing strong bullish and for nextp eriods here exepcting bullish continuation
SUP zone: 147.300
RES zone: 149.100, 149.700

EURUSD LONG 15MThe trend still bullish, It will go short first then fulfill the unmitigated imbalance. This is just my analysis sorry if i'm wrong.

HINO📊 HINO (PSX) Analysis (One can also buy on current market price)
🔎 Fundamentals
🚌 Buses & Trucks: Orders surged 80% 🚀
💰 Undervalued Price → Attractive entry point for long-term investors
📈 Earnings Growth: EPS improved to 4.67 ✅
🤝 MFTBC (Mitsubishi Fuso Truck & Bus Corp.) agreement with HINO → backed by a 100% publicly listed global player 🌍
📉 Technicals
📍 3 Accumulation Areas → Strong buying interest spotted
📊 Trendline Break (Daily) → Closed at 562 → ✅ Buy Signal
🔄 Support Bounce: Price moves in the 562–582 range → Ideal Buy Zone
⚡ If Support Breaks: Next attractive Buy Zone → 360–390
Note: (One can also buy on current market price)
