Current Market StructureMarket looks more in a deciding phase right now.
I just shared the EURUSD chart,
but this kind of structure is visible across most pairs.
Waiting for clearer direction.
Systematictrading

EURUSD — Context Shift | Bullish Bias (Execution-Based)EURUSD was short-term bearish against the higher-timeframe trend.
That corrective move now appears complete.
Price has returned to its primary bullish context.
Because of this shift, my bias moves back to the long side only.
Important clarification:
This is not a trade call.
I am not interested in predicting the move.
I will only consider execution if a proper bullish setup forms within this context.
If conditions fail to align:
No trade is taken
Capital stays protected
Bias defines direction.
Execution depends on conditions.
Key Notes
Short-term pullback appears corrective
Higher-timeframe structure remains bullish
Focus: long-side execution only
No setup = no trade
This reflects how I handle context → bias → execution,
not public signals.

Algorithmic Trading vs Manual TradingWhy the Edge Is Shifting And Why 2026 May Be a Turning Point
As this year comes to an end, it’s the perfect moment to slow down, zoom out, and ask an uncomfortable but necessary question:
Are we trading the markets — or are the markets trading us?
Whether you are in your first year of trading or have spent a decade studying charts, there comes a moment of clarity where you ask yourself:
“If I know what to do… why don’t I always do it?”
Beginners ask this after their first emotional mistake.
Experienced traders ask it after their hundredth.
The market does not punish ignorance as harshly as it punishes inconsistency.
Most traders don’t fail because they lack knowledge.
They fail because they are human.
We all know this pattern:
The entry is clear but hesitation creeps in
The stop is defined but gets adjusted “just a little”
The trend is obvious yet profits are taken too early
The system says don’t trade but emotions say this time is different
At the end of the day, trading is not a battle against the market.
It’s a battle against ourselves.
And that’s exactly where algorithmic (systematic) trading enters the game. Not as a shortcut, not as a holy grail, but as an evolution of execution.
Now, with AI evolving rapidly and tools becoming accessible to retail traders, something big is happening:
The same systematic edge institutions used for years is now available to individuals.
That raises a powerful question:
Can a system (without emotion, instinct, or fear) trade better than a human?
After spending the last 6–8 months deeply immersed in algorithmic trading, intense backtesting, rule-building, and system refinement, I came to a conclusion:
Algorithmic trading is not just the future, it’s the logical evolution of trading itself.
And I strongly believe 2026 will be a major turning point.
Let’s break this down properly.
Manual Trading (Human Trading) → The Strengths & The Silent Killers
Manual trading is where almost everyone starts and for good reason.
What humans do exceptionally well
Pattern recognition
Context awareness and regime interpretation
Macro, narrative, and sentiment understanding
Adaptation during abnormal market conditions
For experienced traders, discretion often becomes earned intuition.
But here’s the uncomfortable truth:
The better you get, the more painful your mistakes become.
Why?
Because you know better yet still break your own rules.
Humans are great at ideas.
But trading success doesn’t come from ideas.
It comes from execution → repeated thousands of times.
And this is where humans struggle most.
The Complete List of Human Trading Failures (The Real Reason Most Traders Lose)
Regardless of experience, humans share the same failure modes.
Here’s the part most people avoid talking about.
Emotional failures
Fear when price approaches entry
Greed when price runs in profit
Panic after one losing trade
Overconfidence after a winning streak
Revenge trading to “get it back”
Execution & discipline failures
Moving stop losses too early
Widening stops to avoid realizing a loss
Taking profit early because “it’s green now”
Ignoring your system once emotions kick in
Changing rules mid-trade
Cognitive biases (even in professionals)
Confirmation bias (seeing only what supports your bias)
Recency bias (overweighting the last trade)
Anchoring to entry price
Counter-trading the trend because price “feels extended”
Lifestyle & state-based issues
Trading tired
Trading stressed
Trading distracted
Trading emotionally impacted by life events
The classic question every trader has asked:
“Why did I take profit so early when the trend was obvious?”
Or:
“Why did I counter-trade when the moving averages clearly showed downside momentum?”
These aren’t skill problems.
They are human problems.
The Hard Truth: Trading Is an Execution Game
Markets reward:
Consistency
Repetition
Risk control
Statistical edge
They do not reward:
Creativity during execution
Emotional intelligence in drawdowns
Smart excuses
Execution quality determines outcomes and execution is precisely where humans are weakest.
Algorithmic Trading → What Changes When Rules Take Control
Algorithmic trading removes the weakest link in trading:
The trader.
A system:
Doesn’t feel fear, stress, fatigue, or boredom
Doesn’t reinterpret rules mid-trade
Doesn’t revenge trade
Doesn’t move stops
Doesn’t second-guess
Doesn’t hesitate
It follows rules.
Every single time.
Key advantages of algorithmic trading
Processes multiple data points simultaneously
Executes instantly during fast price action
Trades 24/7 without fatigue
Applies identical risk rules every trade
Can be objectively tested and measured
There is no emotional deviation.
And that alone is a massive edge.
“But Humans Have Instinct” — The Big Myth
Instinct is just pattern recognition shaped by experience.
And patterns can be quantified.
If a trader can explain why they take a trade
that logic can be turned into rules.
And rules can be executed better by machines.
Win Rate Reality — How High Can It Really Go?
When I began researching existing algo traders:
Some had ~60% win rates with solid returns
Some reached 70–80%
That sparked a question I wrote down and circled:
“Is a 90% win rate even possible?”
So I tested.
Started with swing trading systems
Moved to intraday
Then scalping
Simplified rules instead of complexity
Tested only what truly mattered
After months of backtesting and refinement:
Achieving high-precision win rates of 80–90% across various asset classes, with drawdowns kept to an absolute minimum.
It proved something deeper:
Precision trading is possible when emotion is removed.
Important Reality Check (Especially for Experienced Traders)
High win rate does not automatically mean profitability.
What truly matters:
Risk-to-reward
Drawdowns
Expectancy
Consistency
Longevity over multiple market regimes
A system must survive:
Trending markets
Ranging markets
High volatility
Low volatility
Durability beats elegance.
Always.
The Real Future of Trading (2025–2030)
Here’s how I see it:
More traders will become system builders, not button clickers
Manual trading will shift toward monitoring & strategy design
AI will assist in:
Data filtering
Pattern discovery
Optimization
Hybrid approaches will dominate:
Machines execute
Humans supervise
Manual trading won’t disappear
but manual execution will.
My Personal Conclusion
Manual trading becomes validation
Algorithmic trading becomes execution
Humans decide what to trade
Systems decide how to trade
That’s evolution.
Final Thoughts — End of Year Message 🎄
As the year comes to an end, take time to reflect:
What worked
What didn’t
Where emotions interfered
Where rules could replace decisions
Trading is a long-term game.
The goal isn’t to trade more
it’s to trade better.
Merry Christmas to everyone!
May the next year bring clarity, discipline and growth — both in trading and in life.
The edge is shifting.
And those who adapt early will lead.
Would love to hear your thoughts:
Are you trading fully manual?
Hybrid approach?
Or already building systems?
_________________________________
💬 If you found this helpful, drop a like and comment!

What Is Systematic Risk and How May It Affect Markets?What Is Systematic Risk and How May It Affect Markets?
Systematic risk affects all traders, no matter the strategy or asset class. It comes from market-wide forces—like interest rates, inflation, or geopolitical shifts—that influence entire sectors at once. Unlike unsystematic risk, it can’t be avoided through diversification. This article breaks down what systematic risk is, how it’s measured, and how traders may incorporate it into their analysis.
What Is Systematic Risk?
Systematic risk refers to the kind of risk that affects entire markets or economies, rather than just individual assets. It’s the result of large-scale forces—like inflation, interest rates, central bank policy, geopolitical conflict, or economic slowdowns—that ripple through multiple asset classes at once.
A sharp rise in interest rates, for example, tends to push bond prices lower and can drag down equity valuations as borrowing costs climb and consumer spending slows. Similarly, during a global event like the 2008 financial crisis or the COVID-19 shock in 2020, almost all sectors saw simultaneous drawdowns. These events weren’t tied to poor management or bad earnings reports—they were macro-level shifts that hit everything.
Because it’s a largely undiversifiable risk, systematic risk is a key consideration for traders assessing overall market exposure. It often drives correlation between assets, particularly in times of stress. This is why equities, commodities, and even currencies can start to move in the same direction during periods of heightened volatility.
So, can systematic risk be diversified against? Only relatively speaking. Traders and investors may shift into defensive positions to limit potential drawdowns (e.g. gold, bonds, healthcare stocks vs tech companies). However, no matter how diversified a portfolio is, it remains exposed to this kind of risk because it’s tied to broader market movements rather than asset-specific events.
Note: systematic risk differs from systemic risk. The systemic risk definition relates to the potential collapse of the financial system, such as in a banking crisis. It is rare but severe.
Systematic vs Unsystematic Risk
Systematic risk is broad and market-driven. Unsystematic risk, on the other hand, is specific to a company or sector. It might come from a product failure, a major lawsuit, or a change in management. For example, if a tech company misses earnings due to poor execution, that’s unsystematic. If the entire sector drops because of a global chip shortage or policy change, that’s systematic.
Unsystematic risk can be reduced through diversification. Holding assets across industries may help spread exposure to isolated events. But systematic risk can’t be avoided by simply adding more assets. It affects everything to some extent.
That’s why traders track both systematic and unsystematic risk—understanding where their risk is concentrated and whether their exposure is tied to broad market movements or individual events. Clear separation of the two may help traders analyse potential drawdowns more accurately.
Key Drivers of Systematic Risk
Systematic risks tend to stem from structural or macroeconomic forces, and while they can’t be avoided, traders can track them to better understand the environment they’re operating in. Below are some of the most common types of systematic risk and how they influence market-wide movement.
Monetary Policy
Central banks play a huge role in shaping market conditions. When interest rates rise, borrowing becomes more expensive, which tends to slow down spending and investment. That usually puts downward pressure on risk assets like equities. Conversely, rate cuts or quantitative easing often lead to a surge in asset prices as liquidity improves.
Traders closely monitor central bank statements and economic projections, especially from institutions like the Federal Reserve, the Bank of England, and the European Central Bank.
Inflation and Deflation
Inflation affects everything from consumer behaviour to corporate earnings. Higher inflation can reduce real returns and push central banks to tighten policy. Deflation, though less common, signals weak demand and falling prices, which also tends to hurt equities. Commodities, currencies, and bonds often react sharply to inflation data.
Economic Cycles
Booms and busts are among the most well-known examples of systematic risk, influencing everything from job creation to earnings growth. During expansions, risk appetite tends to rise. In downturns, investors often shift towards defensive assets or cash. GDP figures, manufacturing data, and consumer spending are key indicators traders watch.
Geopolitical Risk
Elections, wars, trade tensions, and sanctions can drive sharp market reactions. These events introduce uncertainty, increase volatility, and can disrupt global supply chains or investor sentiment.
Market Sentiment and Liquidity
Panic selling or sudden shifts in positioning can cause assets to move together, even if fundamentals don’t support it. During liquidity crunches, correlations spike and markets can move sharply on little news. This is often driven by leveraged positioning unwinding or large institutions adjusting risk.
Measuring Systematic Risk
Systematic risk can’t be removed, but it can be measured, and that may help traders understand how exposed they are to broader market swings.
One of the most widely used tools is beta. Beta shows how much an asset moves relative to a benchmark index. A beta of 1 indicates that the asset typically moves in the same direction and by a similar percentage as the overall market. Above 1 means it’s more volatile than the market; below 1 means it’s less volatile. For example, a high-growth stock with a beta of 1.5 would typically move 15% when the market moves 10%.
Another approach is Value at Risk (VaR), which estimates the potential loss on a portfolio under normal market conditions over a specific timeframe. It doesn’t isolate systematic risk but gives a sense of how exposed the overall portfolio is.
Traders also watch the VIX—often called the “fear index”—which tracks expected volatility in the S&P 500. When it spikes, it usually signals rising market-wide risk.
More complex models like the Capital Asset Pricing Model (CAPM) use beta and expected market returns to price risk, but some traders use these tools to get a clearer picture of how exposed they may be to movements they can’t control.
How Traders May Use Systematic Risk in Analysis
Systematic risk isn’t just a background concern—it plays a direct role in how traders assess the market, structure portfolios, and manage exposure. By understanding how market-wide forces are likely to affect asset prices, traders can adjust their approach to reflect broader conditions rather than just focusing on technical analysis or individual names.
Position Sizing and Exposure
When systematic risk is elevated—during tightening cycles, political unrest, or global economic slowdowns—traders may scale back position sizes or reduce leverage. The aim is to avoid being caught in a correlated sell-off where multiple positions move against them at once. It's common to see increased cash holdings or a shift towards lower beta assets in these periods.
Asset Allocation Adjustments
Systematic risk also shapes how capital is distributed across asset classes. For example, during periods of strong economic growth, traders may lean into equities, particularly cyclical sectors. In contrast, during uncertain or contractionary periods, there may be a move towards defensive sectors, fixed income, or commodities like gold. Some rotate between assets based on macro trends to stay aligned with the dominant forces driving markets.
Macro Analysis and Scenario Planning
Understanding systematic risks may help traders prepare for potential market reactions. A trader can analyse upcoming interest rate decisions, inflation prints, or geopolitical tensions and assess which assets are likely to be most sensitive. If recession risk increases, they may expect higher equity volatility and reassess exposure accordingly.
Correlation Tracking
As systematic risk rises, correlations between assets often increase. Traders who normally count on diversification may find their positions moving together. Keeping track of these shifts may help reduce false confidence in portfolio structure and encourage more dynamic risk controls.
Systematic Risk: Considerations
As mentioned above, systematic risk is mostly unpredictable and fully unavoidable. There are some other things you should consider when trying to analyse it. Here are a few points traders often keep in mind:
- Lagging indicators: Metrics like GDP or inflation are backwards-looking. Markets often react before the data confirms the trend.
- False signals: Beta, VaR, and the VIX can be useful, but they’re not foolproof. A low VIX doesn’t guarantee calm markets, and beta doesn’t account for real market conditions.
- Uncertainty around timing: Even if the presence of risk is clear, the timing and severity of its impact are hard to analyse with precision.
- Overreaction risk: Markets can price in fear quickly, and traders may misjudge whether a reaction is justified or temporary.
- Diversification assumptions: Assets that usually behave differently may move in sync during stress. Risk models can underestimate this.
The Bottom Line
Systematic risk is unavoidable, but understanding how it moves through markets may support traders in making decisions. By tracking macro drivers and adjusting positions accordingly, traders may respond with more clarity during volatile periods. However, it is important to take into account all the difficulties that systematic risk brings.
FAQ
What Is Systematic Risk?
Systematic risk refers to the type of risk that affects an entire market or economy. It’s driven by macroeconomic forces such as interest rates, inflation, economic health, and geopolitical events. Because it impacts broad segments of the market, systematic risk cannot be eliminated through diversification.
What Is Systematic Risk vs Unsystematic Risk?
Systematic risk is market-wide and linked to broader economic conditions. Unsystematic risk is asset-specific and tied to events like company earnings, leadership changes, or industry developments. According to theory, unsystematic risk can be reduced by holding a diversified portfolio, while systematic risk remains even with strong diversification.
What Are the Five Systematic Risks?
The main categories include interest rate risk, inflation risk, economic cycle risk, geopolitical risk, and currency or exchange rate risk. Each can affect multiple asset classes and contribute to broad market shifts.
Can You Diversify Systematic Risk?
No. While diversification may help reduce unsystematic risk, systematic risk affects most assets. It might be managed, not avoided.
This article represents the opinion of the Companies operating under the FXOpen brand only. It is not to be construed as an offer, solicitation, or recommendation with respect to products and services provided by the Companies operating under the FXOpen brand, nor is it to be considered financial advice.

AUGUST 30TH Withdrawal executed this Sunday, Aug 30, as per strict monthly protocol. This isn't just about taking profits—it's about enforcing discipline, compounding growth responsibly, and adhering to a system that prioritizes long-term consistency over short-term emotion. The strategy continues.
NOTE ON PAST POSTS:
For clarity — if you’ve ever come across any of my hidden posts, they were strictly tied to an MT5 link shared to confirm analysis already posted on TradingView. Nothing more.
My focus has always been (and will always be) showcasing a real, working system — not on self-promotion or chasing attention.
Thank you for your continued understanding and support.

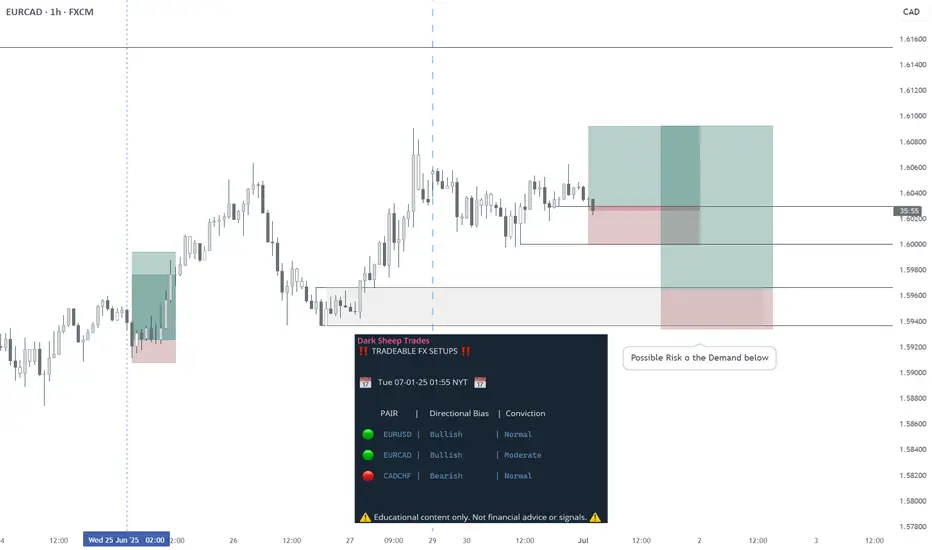
EURCAD - LONG - Statistically-backed FX shortlistEURCAD - LONG
Daily Outlook: Statistically-backed FX shortlist
@darksheeptrades
CADCHF - SHORT - Statistically-backed FX shortlistCADCHF - SHORT
Daily Outlook - Statistically-backed FX shortlist
@darksheeptrades

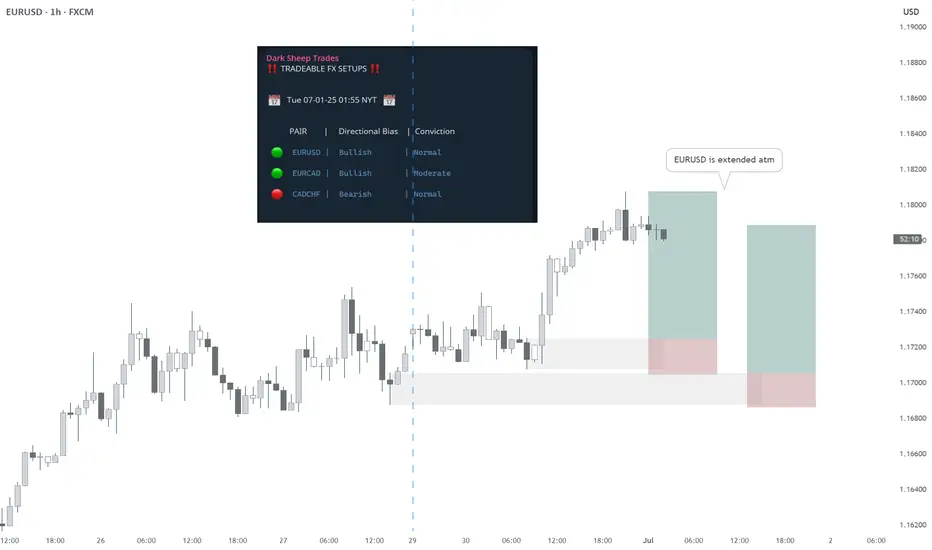
EURUSD BUY - Statistically-backed FX shortlistEURUSD BUY
Daily Outlook: Statistically-backed FX shortlist
@darksheeptrades
EUR/USD 4H Analysis: Smart Money Concept SetupOn the 4H timeframe, EUR/USD transitioned from a downtrend to bullish momentum after breaking the previous LH. This indicates a potential trend reversal.
Price swept liquidity at the IDM level, confirming the inducement move. I’ll now move to the 30M timeframe to refine my entry. My focus is on waiting for a CHoCH (Change of Character) and a bullish order block retest before executing a buy position.
Sticking to one pair this week to maintain a focused approach. Let’s see how this plays out!
Feedback is welcome—drop your thoughts below!
Bless Trading!

XAU/USD: Bearish Continuation Setup with SMC Framework~On the 4H chart, the previous bullish structure shifted to bearish intent after breaking the recent major higher low (HL). This confirmed a change of character (CHoCH) and suggested a potential trend reversal. Following the break, price took out buy-side liquidity (BSL) as inducement and fully mitigated the supply zone/order flow area, solidifying the bearish bias.
~Lower Timeframe Plan (30M & 5M):
As we approach the Sunday evening or Monday opening, I am closely watching the 30-minute chart for confirmation of a CHoCH that aligns with the 4H bearish intent. Once the CHoCH on the 30M is validated, I will refine my entry on the 5-minute chart by looking for a CHoCH flip into a precise order block or order flow zone.
Expectations:
I anticipate price to respect the mitigated supply zone on the 4H and continue its bearish trend. My targets are set at liquidity zones aligned with the higher timeframe structure. I will patiently wait for the setup to develop in alignment with Smart Money Concepts (SMC) principles, focusing on structure, liquidity inducements, and precise entries.
Key Levels:
• 4H bearish intent confirmed after HL break.
• 30M CHoCH confirmation: Awaiting.
• 5M entry: Pending precise setup during Sunday evening or Monday open.
Let’s Connect:
Does this setup align with your perspective on XAU/USD? Drop your thoughts or questions below!
Bless trading!

ES1! 5 minute shorts into Monday 1/27 earningsS&P futures open technically bearish with a 'GAP' down to start off earnings week ( 1/27 - 1/31). We are currently taking advantage of the price action on a shorter time-frame and playing the market structure to its next subsequent down-side targets each pull-back and extension from Sydney, into London session.

DEC 18 GBPUSD SELL TRADE ACTIVATEDThis is a classic move when you know wyckoff schematics ( supply and demand) . I am checking gbpusd since november, it was only this december that the movement gets slow motion. This was an evidence for me to go bearish once I had a validity in lower timeframe.
FAST FORWARD: Dec 12-16 MOVE was a confirmation for me to look for short trades, If you will notice here in my chart : order block was created (supply). I marked it as my POI , Look for validity and EQH---> sell limit activated with a beautiful 1:5RR.
(check chart for complete details) .
#wyckoffianttrader
#profitablesystem
#psychology.

XRPUSD on the Rise: Positioning for Profits with X1X2 AnalysisXRPUSD is currently positioned for a bullish breakout, and I’m excited to share my analysis using the X1X2 methodology to capture potential long opportunities.
In my approach, I will leverage probabilities to strategically get positioned for long entries.
Key Fundamentals Supporting the Bullish Bias
Several fundamental factors are contributing to this bullish outlook:
- Legal Clarity: Recent developments in regulatory clarity surrounding cryptocurrencies are fostering a more favorable environment for XRP, which is crucial as it aims to expand its use case in cross-border payments.
- Increased Adoption: There’s growing interest from institutional investors and partnerships that enhance XRP's utility within the financial ecosystem.
- Market Sentiment: The overall market is experiencing a resurgence, with Bitcoin's recent price action influencing altcoins positively, including XRP.
With the combination of technical analysis and supportive fundamentals, there’s a compelling case for entering long positions.
Let’s stay informed and ready to capitalize on the opportunities ahead!
Feel free to share your thoughts or questions below!
1M:
2W:
4H:
P.S. If you have any questions about how I trade probabilities with the overall market direction, feel free to reach out.

Bearish Signals: Time to Short ADAUSDAs I prepare to share my bearish trade idea for ADAUSD, here are key trends that support my outlook:
- Market Sentiment: Cardano (ADA) has faced a significant downturn, losing nearly 13% this week and about 41% year-to-date. This reflects growing concerns among investors and a lack of bullish momentum.
- Technical Indicators: A bearish divergence between ADA's price and daily active addresses suggests weakening demand, indicating potential further declines.
- Price Action: ADA is trading below crucial moving averages (20-day and 50-day), trapped in a declining channel. This reinforces the bearish sentiment as it approaches the lower boundary.
In my trading strategy, I focus on probabilities to position myself for short trades on ADAUSD.
In summary, by leveraging probabilities alongside market trends, I aim to strategically position myself for potential declines in ADAUSD.
This disciplined approach not only enhances my trading strategy but also aligns perfectly with the current bearish environment.
Join me as we navigate this market together!
P.S. If you have any questions about how I trade probabilities with the overall market direction, feel free to reach out.
4H:https://www.tradingview.com/x/IFRT8mYP/

Bullish on XAGUSD: X1X2 Strategy for Silver GainsAs a trader focused on XAGUSD, I'm excited about my bullish bias and the potential for significant gains in the silver market.
My strategy employs the X1X2 methodology, which is grounded in probabilities, allowing me to identify optimal entry points for long positions.
With silver currently showing strong momentum, especially as it approaches key resistance levels, I anticipate a breakout that could drive prices higher.
The Elliott Wave analysis supports this outlook, indicating that we are in a bullish phase with potential for further upside as long as we maintain support above recent lows.
By leveraging my swing trading system and the X1X2 probabilities, I am positioned to capitalize on this bullish trend effectively.
Join me as we navigate this exciting opportunity in the silver market!
3D:
4H:
P.S. If you have any questions about how I trade probabilities with the overall market direction, feel free to reach out.

Join My Bullish EUR/GBP Journey!Hey Traders! Today, I'm excited to share my bullish trade idea on the EUR/GBP currency pair. As we navigate through the current market dynamics, I believe there are several key fundamentals supporting this upward bias.
Current Market Fundamentals
- Economic Indicators: The upcoming release of the Confederation of British Industry (CBI) retail sales data is anticipated to show positive trends, which could strengthen the GBP. A robust consumer spending report can create a favorable environment for the Euro to gain against the Pound.
- Market Sentiment: Recent bullish candlestick patterns on the H4 chart suggest a potential reversal in the EUR/GBP pair. The price is currently hovering near the middle Bollinger Band, indicating a possible breakout.
- Technical Setup: The pair is trading between the 23.6% and 38.2% Fibonacci retracement levels, suggesting consolidation with potential for upward movement. This technical setup aligns with my bullish sentiment.
Utilizing Probabilities for Positioning
In my trading strategy, I emphasize the importance of probabilities to make informed decisions. Here’s why:
- Statistical Edge: By analyzing historical price movements and current market conditions, I can identify patterns that have a higher likelihood of repeating. This statistical approach helps me gauge potential outcomes more effectively.
- Risk Management: Using probabilities allows me to set realistic targets and stop-loss levels, ensuring that I manage risk while maximizing potential gains. For instance, if historical data shows a 70% success rate for bullish movements after similar setups, I can confidently position myself for long trades.
- Adaptability: Markets are dynamic; therefore, employing a probabilistic mindset enables me to adapt my strategy based on real-time data and changing conditions. This flexibility is crucial in maintaining an edge in trading.
Conclusion
With a bullish bias on EUR/GBP backed by solid fundamentals and a robust technical setup, I am ready to position myself for long trades using probabilities as my guiding principle.
Let’s keep an eye on the upcoming economic data releases and market movements that could further validate this trade idea.
Feel free to share your thoughts or any questions you may have! Happy trading!
1M:
2W:
2H:
P.S. If you have any questions about how I trade probabilities with the overall market direction, feel free to reach out.

Algorithmic vs. Quantitative Trading: Which Path Should You TakeI’ve always wondered why anyone would stick to traditional trading methods when algorithms and mathematical models could do all the heavy lifting.
I started questioning everything:
• Why do so many mentors still swear by discretionary trading when algorithms could handle all the heavy lifting?
• Do they really have solid proof of their “own” success, or is it just talk?
• Or are they keeping things complex and discretionary on purpose, to confuse people and keep them as members longer?
• Why deal with the stress of emotions and decisions when an algorithm can take care of it all?
• Imagine how much further ahead you could be if you stopped wasting time on manual trades and instead focused on market research and developing your own models.
When I first got into trading, I thought Algorithmic Trading and Quantitative Trading were basically the same thing. But as I dug deeper, I realized they’re two completely different worlds.
Algorithmic Trading: It’s simple – you set the rules and the algorithm executes the trades. No more sitting in front of the screen “controlling your emotions” and trying to manage every little detail. Instead, you let the algorithm handle it, based on the rules you’ve set. It frees up your time to focus on other things rather than staring at price charts all day.
But here’s the thing – it’s not perfect. You’ll still need to test the rules to make sure the data and results you’re getting aren’t overfitted or just random.
Quantitative Trading: A whole different level. It’s not just about executing trades; it’s about understanding the data and math behind market movements. You analyze historical price, economic, and political data, using math and machine learning to predict the future. But it can be complex – techniques like Deep Learning can turn it into a serious challenge.
The upside? This is the most reliable way to trade, and it’s exactly what over 80% of hedge funds do. They rely on quant models to minimize risk and to outperform the market.
So, which path should you choose?
Quantitative Trading can feel overwhelming at first, I recommend starting with the basics. Begin with Pine Script coding in TradingView—start building a foundation with simple strategies and indicators. As you grow more confident, start coding your own ideas into rules and refining your approach to eventually automated your trading strategy.
TradingView is a great tool for this, and I’d highly suggest grabbing the Premium plan. This will give you access to more data and features to make your learning journey smoother.
Dive into the Pine Script documentation , and begin bringing your ideas to life.
I promise, the more you focus on this, the better and more independent you’ll become in trading.
Every day, aim to get just 1% better.
To Your success,
Moein

Short Position on EURCAD: Strong Potential for TP SuccessKey Fundamentals Supporting a Bearish Bias:
- Eurozone Struggles: Recent economic reports indicate that the Eurozone is facing challenges, including sluggish growth and rising inflation. This could weaken the Euro as investors lose confidence.
- Interest Rate Outlook: The European Central Bank is taking a cautious stance on interest rates, while the Bank of Canada is likely to raise rates. This contrast could strengthen the Canadian Dollar against the Euro.
- Geopolitical Pressures: Ongoing issues in Europe, such as energy crises and trade disruptions, are creating uncertainty. This instability can further drag down the Euro's value relative to the CAD.
I'm focusing on short positions for EURCAD by using probabilities derived from historical data. By analyzing past trends and applying straightforward mathematical rules, I can spot high-probability trading opportunities.
This strategy helps me stay disciplined and make informed decisions, reducing emotional trading and increasing my chances of success.
Let's dive into the multiple timeframe top-down analysis together:
12M:
1D:
Hourly Entry:

My Bullish GBP/USD Strategy Using X1X2!You have no idea how many opportunities are there when you're simply following "X1X2"!
I invite you to engage with me in this analysis!
Current Fundamentals Supporting a Bullish Bias on GBP/USD:
1. Positive UK Economic Data: Recent reports indicate that the UK's GDP expanded by 0.2% in August, aligning with analyst expectations. Additionally, industrial production and manufacturing have shown growth, which supports the Pound's strength against the Dollar.
2. Diminishing US Dollar Strength: The US Dollar has faced selling pressure, particularly in light of recent mixed macroeconomic data. A softening inflation rate and rising initial jobless claims have raised concerns about the US economy, contributing to a bullish outlook for GBP/USD.
3. Market Sentiment Shift: An improving risk mood among investors has led to optimism regarding potential Federal Reserve rate cuts. This sentiment has weakened the Dollar, allowing GBP/USD to gain traction above key support levels.
Utilizing Probabilities in My Swing Trading Strategy:
In my trading approach, I employ a system known as X1X2, which focuses on probabilities to determine optimal entry points for long positions in GBP/USD.
In conclusion, my bullish bias on GBP/USD is supported by favorable economic indicators from the UK and weakening US economic data. By leveraging probabilities through my X1X2 system, I aim to position myself effectively for potential long trades in this pair.
1W:
3H:

ETHUSD: Bullish Bias with 58.65% Probability of Hitting TP1I'm feeling bullish on ETHUSD and looking to take some long positions.
My approach is all about using probabilities based on solid math and historical data from my charts.
Why probabilities?
They help me make smarter decisions by showing how often certain price levels have been reached in the past. This gives me a clearer idea of where I might want to enter and exit trades.
By analyzing past price movements, I can build my confidence in this trade and keep emotions in check.
With a 58.65% probability of hitting TP1, this setup looks like a great opportunity to ride the potential upward movement in Ethereum!
12M:
2W:
1H:
for more information check out my BIO!

USOIL: Multi-Timeframe Analysis | Strong Setup FormingI've been looking at various markets recently, and USOIL really stood out to me. I want to share how I analyze markets using a mechanical top-down approach across all timeframes to form my trading bias.
Top-Down Analysis:
This method is crucial in my trading strategy. It helps me stay objective by focusing on what the market is indicating regarding trends and key levels, rather than letting my personal opinions cloud my judgment.
By adopting a systematic approach, I've been able to reduce doubts and fears in my trading decisions.
Now, let's dive into the top-down analysis process.
12M:
2W:
6H:

Trade Idea for BTCUSDMy sentiment about BTCUSD is firmly bullish.
I plan to utilize probabilities to strategically position myself into long positions. This approach allows me to leverage statistical analysis and market behavior to enhance my trading decisions.
Several key fundamentals are currently influencing the market in a direction that aligns with my bullish bias on BTCUSD:
Institutional Adoption: There has been a notable increase in institutional interest in Bitcoin, with major firms investing heavily. This trend suggests growing confidence in Bitcoin as a long-term asset.
Economic Uncertainty: Global economic conditions remain volatile, leading many investors to seek alternative assets like Bitcoin as a hedge against inflation and currency devaluation.
Technological Advancements: Innovations in blockchain technology and increased acceptance of cryptocurrencies for transactions are contributing to a more robust ecosystem, enhancing Bitcoin's utility and attractiveness.
Conclusion
In summary, my bullish stance on BTCUSD is supported by both statistical probabilities and current global fundamentals. By strategically using probabilities, I aim to position myself advantageously in the market. This method not only enhances my trading strategy but also aligns with broader economic trends that favor the growth of Bitcoin.
Let’s dive into the top-down analysis together! Your thoughts and feedback are always welcome!
1D:
Hourly Timeframes:
If you found this analysis useful, please boost and comment! Your support helps us all grow!

Probabilities Powering BTCUSD TradesUtilizing probabilities based on historical data is a cornerstone of my bullish strategy for BTCUSD. Here’s why I believe this approach is not only effective but essential for positioning long trades successfully.
Understanding the Importance of Probabilities
Probabilities in Trading
Trading is inherently uncertain, and relying on probabilities allows traders to make informed decisions rather than guesses. By analyzing historical price movements and patterns, we can identify trends that have previously led to upward or downward movements. This statistical approach helps mitigate risks associated with emotional decision-making.
Historical Data as a Guide
Historical data provides a wealth of information about how BTCUSD has reacted under various market conditions. By employing a mechanical trading strategy that incorporates these indicators, I can increase my chances of entering profitable trades.
Mechanical Trading Strategy
What is a Mechanical Trading Strategy?
A mechanical trading strategy is a systematic approach that uses predefined rules based on historical data to make trading decisions. This method eliminates emotional bias and ensures consistency in trade execution.
Benefits of a Mechanical Approach
1. Consistency: Adhering to a mechanical strategy means that trades are executed based on data rather than emotions.
2. Backtesting: Historical data allows for backtesting strategies to see how they would have performed in the past, providing confidence in their potential effectiveness.
3. Risk Management: By employing probabilities, I can better manage risk through calculated position sizing and stop-loss orders.
Current Market Context
In the current market environment, BTCUSD shows signs of bullish momentum. The formation of higher lows indicates strength, and historical patterns suggest that we may be at the beginning of another significant upward trend. By leveraging probabilities derived from past performance, I am positioning myself to capitalize on this potential movement.
Conclusion
In summary, utilizing probabilities based on historical data through a mechanical trading strategy equips me with a robust framework for entering long positions in BTCUSD. This approach not only enhances my decision-making process but also aligns with my overall bullish bias. As we navigate the complexities of the crypto market, relying on data-driven strategies will be crucial for achieving success in our trades.
1D:
6H:
