HHNGAS:Profit target hit. The Freeport Pin was pulled.This video consists of an update of the Henry Hub Natural Gas trade strategy that was presented on 25 August 2026 when a bull flag pattern with the flag pole from $3.20 to $2.60, three weeks of tight consolidation within the range and freeport LNG maintenance, being a pin and forcing prices below equilibrium, were spotted. The pin was broken early-cycle LNG feedgas demand nominations reached 6-week highs as freeport was recovering and Corpus Christi's train 7 was pushing record flows at the same
Targetprice
Japan 225 ($JP225) 4H: Long Setup Hits Take Profit TargetJapan 225 ( FOREXCOM:JP225 ) 4H: Long Setup Hits Take Profit Target — Reclaiming 200-EMA After Trendline Demand Rebound
### 🇯🇵 Japan 225 Index ( FOREXCOM:JP225 / Nikkei 225) 4-Hour Trade Execution Matrix (Ref: JP225_2026-08-05_09-27-26.png)
We are releasing a successful trade execution update on the Japan 225 Index ( FOREXCOM:JP225 ). Following a liquidity sweep and double-bottom reaction along the lower dynamic trendline baseline (green LTA), our systematic long setup expanded aggressively to
AKT: Ichimoku Bullish Setup Awaiting an SSB BreakoutThis chart shows a bullish Ichimoku setup worth monitoring, but not a confirmed breakout yet.
Current situation
The black ellipse on the left highlights that the Lagging Span has already been rejected four times by the SSB resistance level (0.4559). As long as that barrier remains intact, the bullish setup remains incomplete.
Entry scenarios
The bullish scenario becomes valid only if the Lagging Span breaks above its SSB resistance, allowing price to close above the flat SSB. Once that ha
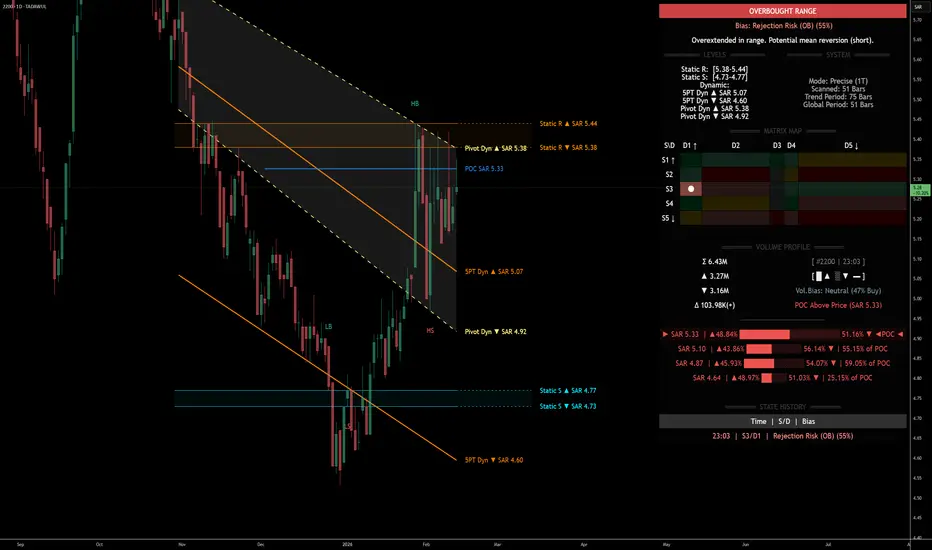
2200 | OVERBOUGHT RANGE — Rejection Risk at Static Resistance TADAWUL:2200 — 1D Chart | DSRTL-ML Algorithmic Reading
Matrix State: S3/D1 | Confidence: 55% | Bias: Rejection Risk (Overbought)
Price at SAR 5.28 sits mid-range between Static Support (SAR 4.73–4.77) and Static Resistance (SAR 5.38–5.44). The Dynamic state reads D1 (Overextended Up), meaning price is stretched above dynamic equilibrium without structural confirmation. This creates a classic overbought-in-range condition with mean reversion pressure.
Key Structural Observations
A resistan
H&S on Bitcoin Daily Is Now Confirmed!Trading Fam,
Not a long post here as I have said enough on this in many of my previous posts. Just wanted to update you on the Head and Shoulders pattern. Our candle close today has now confirmed a break in the neckline. This is bad. We will now look to the weekly candle close to confirm further price action down. The weekly could save us. But this is doubtful.
Remember, I have outlined at least 6 additional strong bearish patterns in previous posts that have all been confirmed. This H&S was
CADJPY Potential Sell Setup – Liquidity Gap Reversal IdeaI hope everyone is having a productive day. CADJPY is presenting a potential selling opportunity as price action is gradually moving toward a visible liquidity imbalance. There is a high probability that the market may fill this gap before showing a corrective move or possible reversal. The projected target zone is near 110, however traders are encouraged to manage their own take-profit levels based on personal strategy and disciplined risk management.
Trade responsibly, stay patient, and always
Last XPT Options Insights & What They Mean for Precious MetalsPlatinum Options showed unusual activity last week — and it’s worth your attention.
Why focus on platinum?
It’s a traditional institutional instrument, with minimal retail presence.
Check your terminal: compare spreads in PL vs. gold or silver — you’ll see the difference.
Low liquidity → less noise → clearer signals from funds and smart money.
And here’s the key:
Platinum often leads the way.
Its moves and positioning frequently foreshadow broader precious metals trends.
🔍 What Are We Seeing
Bitcoin Update – November 1, 2025 - Revised 2026 target $46KBitcoin and Crypto Market Update – November 1, 2025
Bitcoin has completed its cup-and-handle pattern , hitting the technical target near $118,000 before rolling over into a fresh rising-wedge formation . The new structure is supported by declining volume , hinting at fading momentum and a potential pullback toward $46,000 .
Today’s move mirrors broader macro caution—the Fed’s pause on rate cuts and Trump–Xi trade tensions have triggered a wave of risk-off sentiment. Bitcoin is down 3
What Bitcoin Options on CME Are Whispering Right Now
A quick look at the flow — and it’s clear:
the market is pricing in a move toward $145K–$150K.
But here’s the nuance:
nearly all these call spreads come with a hedge — a short futures leg added right away.
This isn’t pure bullish speculation.
It’s a structured play.
🔍 The Logic Behind It:
Primary goal: Profit from upside as BTC rallies.
But also prepared for downside:
These portfolios assume a potential drop to $103K, and in some cases even $101K — which are the break-even points of the s
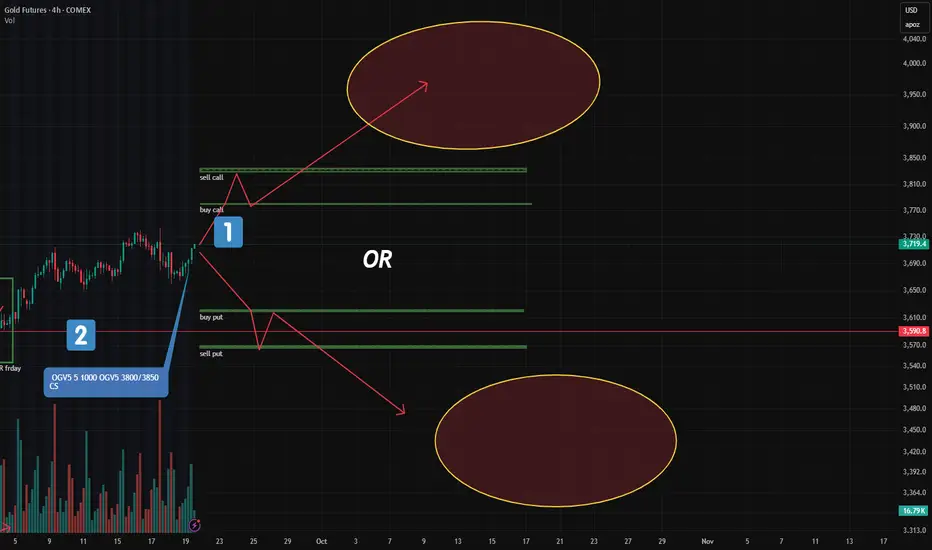
Gold: Major New Option Portfolios Signal Strong Moves AheadFriday’s CME report showed a surge in large option blocks in gold — two of them stand out.
🔹 1. "Long Condor" on December Futures (GCZ24)
This is the most significant structure added:
Targets a move below $3,620 or above $3,780
In other words: a breakout is expected, not consolidation
📌 Key point:
A "Long Condor" profits from volatility, not direction.
It wins if price moves sharply — up OR down — but loses if it stays flat.
💡 My note:
When I first encountered delta-neutral strategies like t
BTC USD UpdateWe’ve hit all of our targets on the BTC/USD pair, so it’s time to close today’s trades and let the markets work their magic. I hope you’ve found this trading plan helpful. With the summer trading season ahead, it will be interesting to see how both the dollar and crypto markets perform. I’ll keep you posted!
Bullish Flag / Pennant Pattern Formation appearing.
87 - 88 is the Breakout Level; but Important Resistance
lies around 90 - 92
Closing above 100 - 101 would trigger more positivity.
Crossing & Sustaining this level may expose new Highs
around 130.
However, it should not Break 73.
Target Corporation (NYSE:TGT) To Report Earnings Before the BellTarget Corporation (NYSE: NYSE:TGT ) a company that operates as a general merchandise retailer in the United States is set to report earnings on Tuesday, March 4, 2025, before market open. In like of that manner, NYSE:TGT shares surge 2.27% in Tuesday's premarket trading.
With the 1-month low acting as a support point, in the case of a pullback the 1-month low seems strong enough to hold off sellers. With the RSI at 40, a bullish reversal could be feasible in the case of a favourable earnin
ETHEREUM 2 HR ANALYSIS 🚨 Ethereum 2 Hour Analysis 🚨
Here’s what we’re watching:
📈 Upside Targets:
• TP1:3350
• TP2: 3500
📉 Downside Targets:
• TP1: 3200
• TP2: 3100
So we have to watch out for $3250-$3300 level. If ETH stays below then you can target downside targets and if above then you can target above levels mentioned as TP(take profit)
Keep an eye on key levels and trade smart! 💹
What’s your take? Drop a comment below and share this with your trading crew! 🚀
Hey SPYLOVERS here are 3 Scenarios for this week check it out...Another week analyzing SPY's behavior correctly as we planned. I’d like to invite you to review my previous analyses of the price movements throughout the week, so you can see that I base my strategy solely on price action and institutional supply and demand concepts—simple methods that the price has respected.
In this case, we won’t be seeing historical highs anytime soon. I believe we’re in a pullback where we need to monitor closely to see if the price might return to the order block I have
Target $3,745 in XAUUSD monthly timeframeOunce made a new ATH last week. Currently, it is involved in a monthly target that I specified for you with the help of Fibonacci extension. The beginning of the Fibonacci extension is the price of $252 on August 2, 1999
There is a possibility that we will have a price correction in this area, but if the price stabilizes above $2,713, it can continue to rise.
The next target in the monthly timeframe of XAUUSD will be the range of $3,745, which can be thought of as a long-term view.
Ethereum is starting to recover ! check the structure pathEthereum is showing a lot of strength and recovery. Always trust and follow your plan !
On the daily timeframe we can see that it is following the path of the pullback we have marked on the chart. So far we are predicting very well, and it seems that the markets in general want to start changing direction.
Cheers and thank you for following my analysis.
my best regards
Hey SPY Lovers we got a Pullback Target !This is my analysis of SPY on the daily chart.
I have a leg measurement in the two strong corrections that the price has been making. In the second leg, it replicates the first one. I also have a very important point that coincides with the first leg and connects with the second one. So, no matter how low we might see the market fall, the levels 531 and 532 are a point of interest for me for a possible pullback.
$2 Is My Target - Bullish On SEIResistance flipped to support and targets $0.40. My overall target for SEI is $2 during this bull-run.
An area I am looking for a short scalp is the daily & 0.618 fib confluence.
Calculate Your Risk/Reward so you don't lose more than 1% of your account per trade.
Every day the charts provide new information. You have to adjust or get REKT.
Love it or hate it, hit that thumbs up and share your thoughts below!
This is not financial advice. This is for educational purposes only.
FUBO "B" wave bottoming? First upside target 4.85USD?This is a followup idea on my previous one where we "idezied" the bottoming process, which so far has been manifested. So far I see it as a huge (A)(B)(C) forming to the upside, hence the choppiness, which overall LIKELY will stay as 3 wave structure hitting a several year upside target of between 22 - 84 USD, too soon to projectile anything more proper target. Can it be something even more bullish? Yes, but it has to proove a lot in the upcoming years. In that case it is LIKELY to be a huge ove