AUD/CAD BULLS ARE GAINING STRENGTH|LONG
Hello, Friends!
AUD/CAD pair is trading in a local uptrend which know by looking at the previous 1W candle which is green. On the 4H timeframe the pair is going down. The pair is oversold because the price is close to the lower band of the BB indicator. So we are looking to buy the pair with the lower BB line acting as support. The next target is 0.914 area.
Disclosure: I am part of Trade Nation's Influencer program and receive a monthly fee for using their TradingView charts in my analysis.
✅LIKE AND COMMENT MY IDEAS✅
Techincalanalysis

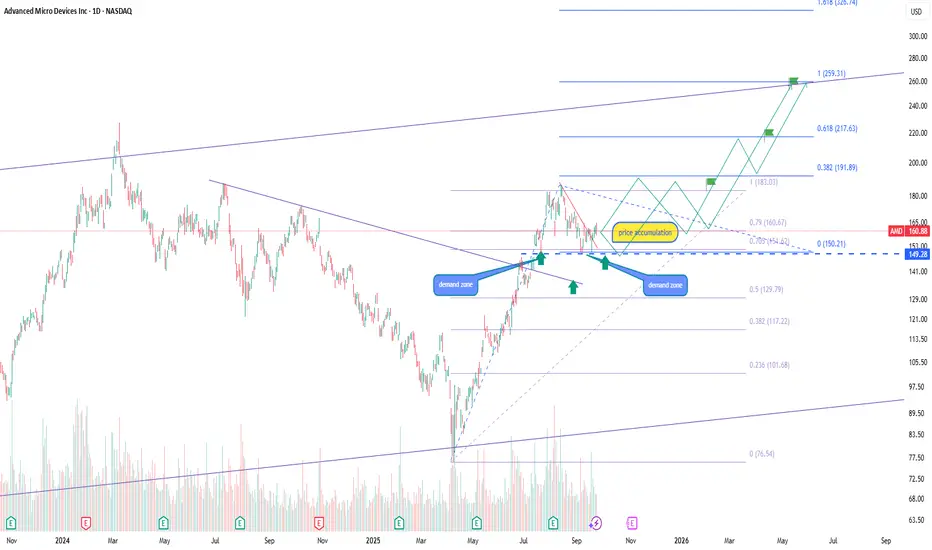
AMD reversal pattern and long-term growth potentialOn the AMD chart price holds the key support around 149–150 forming a base for continuation of the bullish trend. Above the consolidation zone at 160 targets open at 183, 217 and 259. In the longer-term perspective the structure points toward 326 and even higher as the trend remains bullish. Should a correction occur the 129 zone acts as major support to preserve the upward structure.
AMD keeps strengthening its market share in processors and GPUs, expanding rapidly in the server and AI segments. Strong demand for company products and its growing role in the AI ecosystem continue to attract institutional investors. Looking ahead to 2026, some analysts expect the stock to potentially reach levels around 900 per share.
Both the technical setup and fundamentals support further upside with near-term targets at 183, 217 and 259 while in the long-term a scenario above 300 and potentially up to 900 stays in focus for strategic investors. Risk-to-reward conditions provide a strong basis for holding existing positions and considering new entries. Additionally, investors may also look at opportunities through the AMD-linked ETF (AMDL).
Gold shakes violently | Priority Buy on dip to support🟡 XAU/USD – 24/09 | Captain Vincent ⚓
🔎 Captain’s Log – Context & News
Geopolitics : Trump unexpectedly supported Ukraine reclaiming full territory and called on NATO to be tougher on Russia → defensive sentiment returned, supporting Gold.
US Economy : Housing data due today, no FED speeches.
Earlier: Weak US PMI + dovish FED tone → no momentum for a prolonged downtrend.
Price Action : Gold dropped more than 20 points overnight, then quickly rebounded to 3,76x → likely profit-taking pressure at higher levels.
⏩ Captain’s Summary : Main trend stays bullish, but the voyage will remain choppy as Gold absorbs profit-taking near resistance.
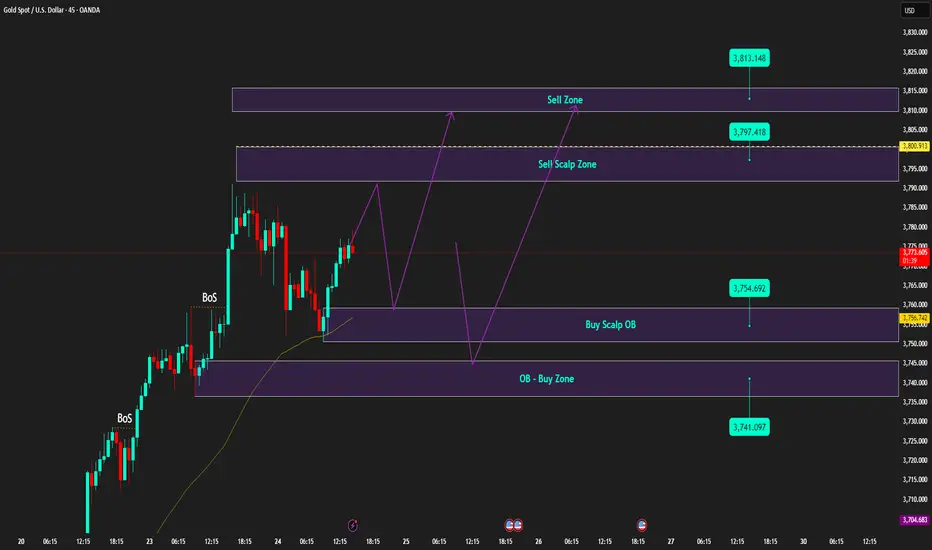
📈 Captain’s Chart – Technical Analysis (M45)
Golden Harbor (Support / Buy Zone)
Buy Scalp OB: 3,754 – 3,757
OB Harbor: 3,741 – 3,744
Storm Breaker (Resistance / Sell Zone)
Sell Scalp Zone: 3,797 – 3,800
Higher Sell Zone: 3,813 – 3,815
Market Structure
After the deep drop, Gold rebounded and held above 3,76x.
Bullish trend remains intact, but waves of volatility may occur near higher resistance zones.
🎯 Captain’s Map – Trade Plan
✅ Buy (priority)
Buy Scalp OB
Entry: 3,754 – 3,757
SL: 3,747
TP: 3,762 – 3,767 – 3,772 – 3,777 – 3,782
Buy Zone OB
Entry: 3,741 – 3,744
SL: 3,732
TP: 3,749 – 3,754 – 3,759 – 3,764 – 3,769
⚡ Sell (short scalp – lower RR)
Sell Scalp Zone
Entry: 3,797 – 3,800
SL: 3,806
TP: 3,795 – 3,790 – 3,785 – 3,780 – 3,775
Higher Sell Zone
Entry: 3,813 – 3,815
SL: 3,823
TP: 3,810 – 3,805 – 3,800 – 3,795 – 3,790
⚓ Captain’s Note
“The Golden ship rocked violently overnight but still anchored firmly at Golden Harbor 🏝️ (3,754 – 3,741) . Profit-taking waves may still rise at Storm Breaker 🌊 (3,797 – 3,815) , suitable for short Quick Boarding 🚤 scalps. Yet the main voyage continues north – Buy the Dip remains the compass to follow the strong winds.”
📢 If you find the Captain’s Log useful, don’t forget to Follow for the latest signals.
💬 Got your own view on Gold? Share it in the comments and join the crew discussion!
LiamTrading – XAUUSD IN-DEPTH ANALYSIS OF CURRENT TRENDSLiamTrading – XAUUSD Today's Scenario: Opportunities at Key Price Levels
Gold continues its strong upward momentum, currently oscillating around the 376x–377x range after a series of breakouts. The technical structure on the H1 chart indicates the market is forming clear resistance and support zones, suitable for short-term trading plans.
Technical Analysis
RSI is cooling off from high levels, indicating the potential for a short-term correction.
The upper price zone around 3818–3821 is a strong confluence of resistance, coinciding with wave peaks and Fibonacci extensions, making it prone to selling reactions.
Conversely, the support zones at 373x and 370x show dense liquidity, serving as potential buying points when prices correct.
The short-term Dow structure still leans towards an uptrend, but attention is needed at the sell confirmation zone if gold fails at the peak.
Trading Plan Reference
Sell Zone: 3818 – 3821, SL 3828, TP 3805 – 3785 – 3760 – 3732 – 3650
Buy Scalping: 3728 – 3731, SL 3723, TP 3750 – 3777 – 3790
Buy Zone: 3706 – 3709, SL 3700, TP 3725 – 3738 – 3750 – 3777 – 3790
In summary, the main trend still favors an uptrend, but with gold approaching strong resistance zones, the likelihood of a correction is high. Traders should patiently wait for reactions at the marked zones for optimal entry, while managing risk tightly.
This is my personal view on XAUUSD. If you're interested in gold scenarios, follow me for the fastest updates.

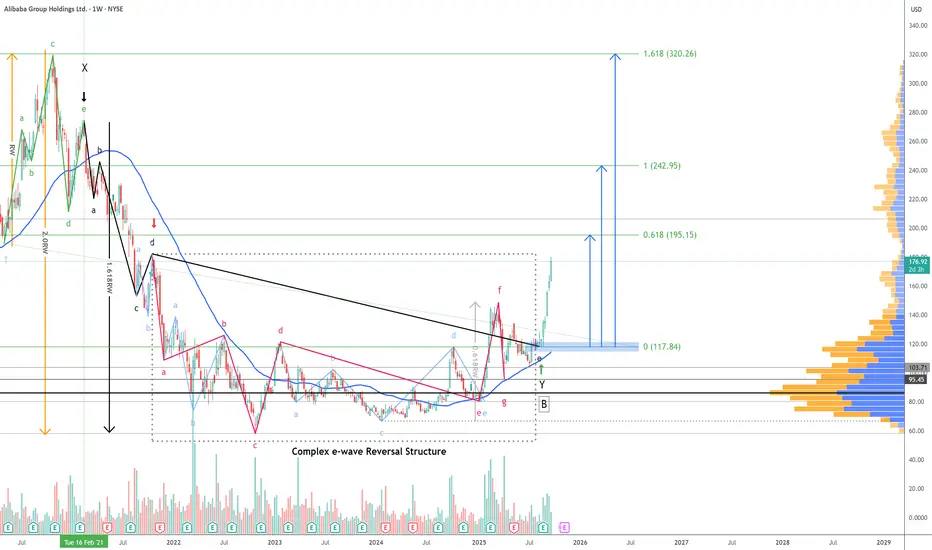
$BABA - Structure Confirmed, Targets In Motion - 9/24/2025Back in February, we discussed how NYSE:BABA was approaching the final stages of a reversal pattern. That call has now been confirmed with the structure concluding at $117. What followed was nothing short of explosive—a 51% upswing rally that’s currently unfolding with strong momentum. 📈
Note: The stock bounced twice off the 50-week moving average, signaling strong support as the correction neared its end.
The chart highlights the projected targets for this new rally, and for transparency and educational value, the internal wave structure and labeling have been intentionally left visible. This is especially insightful for traders exploring Modern Trading Algorithms and their structural variations.
Let the rally do the talking! 📊. 🚀
Happy Trading!
SILVER SELLERS WILL DOMINATE THE MARKET|SHORT
SILVER SIGNAL
Trade Direction: short
Entry Level: 4,409.7
Target Level: 4,246.7
Stop Loss: 4,517.2
RISK PROFILE
Risk level: medium
Suggested risk: 1%
Timeframe: 9h
Disclosure: I am part of Trade Nation's Influencer program and receive a monthly fee for using their TradingView charts in my analysis.
✅LIKE AND COMMENT MY IDEAS✅

USD/CAD BEARISH BIAS RIGHT NOW| SHORT
USD/CAD SIGNAL
Trade Direction: short
Entry Level: 1.387
Target Level: 1.379
Stop Loss: 1.392
RISK PROFILE
Risk level: medium
Suggested risk: 1%
Timeframe: 12h
Disclosure: I am part of Trade Nation's Influencer program and receive a monthly fee for using their TradingView charts in my analysis.
✅LIKE AND COMMENT MY IDEAS✅

USD/CHF BEST PLACE TO SELL FROM|SHORT
Hello, Friends!
USD/CHF pair is trading in a local downtrend which know by looking at the previous 1W candle which is red. On the 3H timeframe the pair is going up. The pair is overbought because the price is close to the upper band of the BB indicator. So we are looking to sell the pair with the upper BB line acting as resistance. The next target is 0.789 area.
Disclosure: I am part of Trade Nation's Influencer program and receive a monthly fee for using their TradingView charts in my analysis.
✅LIKE AND COMMENT MY IDEAS✅

USD/JPY BEARS ARE STRONG HERE|SHORT
Hello, Friends!
We are targeting the 147.228 level area with our short trade on USD/JPY which is based on the fact that the pair is overbought on the BB band scale and is also approaching a resistance line above thus going us a good entry option.
Disclosure: I am part of Trade Nation's Influencer program and receive a monthly fee for using their TradingView charts in my analysis.
✅LIKE AND COMMENT MY IDEAS✅

AUD/CHF BULLS ARE GAINING STRENGTH|LONG
Hello, Friends!
The BB lower band is nearby so AUD-CHF is in the oversold territory. Thus, despite the downtrend on the 1W timeframe I think that we will see a bullish reaction from the support line below and a move up towards the target at around 0.525.
Disclosure: I am part of Trade Nation's Influencer program and receive a monthly fee for using their TradingView charts in my analysis.
✅LIKE AND COMMENT MY IDEAS✅

USDX: demand zone holds but downside pressure remainsThe US dollar index remains under pressure, trading within a descending channel. The recent bounce from the support zone around 96.30–96.90 stalled at the EMAs and the supply zone near 98.30–98.60, where sellers reappeared. On the 4H chart, price has failed to sustain above 97.80, keeping the bearish scenario in play.
It is also important to note that the index is trading below the 200 EMA, reinforcing the bearish bias and signaling that sustainable recovery is less likely without strong fundamental catalysts.
If 96.90 breaks, the next downside target is 96.30, followed by 95.40. Stronger bearish momentum could even push the index toward 94.00, signaling further dollar weakness. For now, 96.30 acts as the key support barrier.
From a fundamental perspective, the dollar index remains weighed down by expectations of a dovish Fed and lower yields. Any hawkish surprise from Fed officials could lift price back toward 98.50, but the structure still favors bearish continuation.
This is exactly the kind of situation where market expectations diverge from reality, and the longer it lasts the more it feels like a trend reversal is near. But as always, emotions must be set aside — we wait for clear signals, not illusions.

GBPUSD overhead supply keeps pressure, downside targets in focusGBPUSD once again tested the main supply zone around 1.3740, from where the market has repeatedly reversed lower. On the daily chart, the pair shows a series of lower highs, and the close below local support signals growing seller pressure.
The first downside target is near 1.3350, where initial profit-taking may occur. The next area is 1.3175, a stronger support level established earlier in the year. If bearish momentum develops further, 1.2900 becomes the key downside target to watch.
From a fundamental perspective, the pound remains under pressure due to Bank of England policy uncertainty, weak UK economic data, and the relatively hawkish stance of the Federal Reserve supporting the dollar. As long as the market trades below 1.3740, the bias remains toward the downside.

LiamTrading – XAUUSD H1LiamTrading – XAUUSD H1: Adjustment structure formed, awaiting confirmation below 3685
After a surge to 375x, gold is entering a correction phase, aligning with the structural pattern. On H1, the price is clinging to the upper edge of the rising wedge, with RSI cooling off from overbought territory, indicating a growing supply pressure. Today's plan focuses on the adjustment structure, prioritizing selling upon confirmation signals.
Key price zones (refer to the attached chart)
Sell strong resistance 3775–3785: confluence of channel peak + 2.618 extension. Look for weakening reactions to enter short/medium-term sell orders.
Buy zone volume 3726–3720: a thin support area providing momentum for a rebound. Holding this zone could push prices to retest 3750–3775; conversely, losing 3720 may lead to a deeper decline.
Resistance + FVG 3715–3698: as prices drop, this area turns into supply; a failed retest here is an early signal for further decline.
Confirm sell 3688–3685: closing H1 below this zone confirms a short-term downtrend, targeting a lower buy zone.
BuyZone 3652–3646: confluence of channel bottom + old liquidity, expecting a strong upward reaction if revisited.
Trading scenarios for reference (adhere to risk management)
Sell reaction at peak: 3778–3783, SL 3792, TP 3755 → 3738 → 3722.
Sell upon confirmation: wait for H1 to close below 3685, enter sell 3684–3682, SL 3696, TP 3673 → 3656 → 3648.
Buy scalp based on volume: 3726–3720, SL 3715, TP 3738 → 3750 (only short-term if the larger structure remains corrective).
Buy swing at strong zone: 3652–3646, SL 3639, TP 3673 → 3698 → 3712 → 3740.
Operational notes
Prioritize waiting for rejection/closing signals at the mentioned zones; avoid chasing orders in between.
Order volume should be allocated based on confirmation levels (confirmation zone < breakdown < failed retest).
Avoid excessive leverage; adjust SL according to structure when in profit.
This is a personal perspective, not investment advice. If you want the fastest updates on the next XAUUSD scenarios, follow me and join my community for discussions.

XAUUSD 09/24 – Scenario after the Fed's Key SpeechXAUUSD 09/24 – Scenario after the Fed's Key Speech
Hello everyone,
Gold continues its consecutive upward momentum in recent sessions. Yesterday, the price touched the 1.618 Fibonacci level on the H4 chart and then pulled back, indicating a slight rejection right after the PMI news.
Technical Perspective
The Wolfe Waves structure remains intact, not yet broken.
If the price returns inside the trendline, the signal confirming the Wolfe pattern will become clearer.
Current key resistance zone: 3790 – 3825, coinciding with the 361.8 Fibonacci.
Noteworthy short-term support zone: 3650 – 3647.
Fundamental Perspective
In yesterday's speech, Chairman Powell emphasized: “If monetary policy is loosened too quickly, efforts to curb inflation will fail.”
This indicates that the Fed continues to prioritize price stability over the market's expectations for rate cuts. This is a factor to consider when trading gold in the current phase.
Today's Trading Scenario
Sell Setup
Entry: 3825 – 3827
SL: 3833
TP: 3810 – 3790 – 3768 – 3755
Buy Setup
Entry: 3650 – 3647
SL: 3642
TP: 3672 – 3688 – 3695 – 3710 – 3750
Summary
In the short term, gold is in a correction phase after hitting resistance. Prioritize observing signals around 3790 – 3825 to find Sell opportunities, while the 3650 zone is a notable buying point for a recovery scenario.
This is today's XAUUSD trading scenario according to the Wolfe Waves pattern. You can refer and adjust according to your personal strategy.
Follow me for the latest analysis updates as the market changes.
Wishing you successful trading!

NZD/CHF BEARISH BIAS RIGHT NOW| SHORT
NZD/CHF SIGNAL
Trade Direction: short
Entry Level: 0.466
Target Level: 0.464
Stop Loss: 0.468
RISK PROFILE
Risk level: medium
Suggested risk: 1%
Timeframe: 1h
Disclosure: I am part of Trade Nation's Influencer program and receive a monthly fee for using their TradingView charts in my analysis.
✅LIKE AND COMMENT MY IDEAS✅

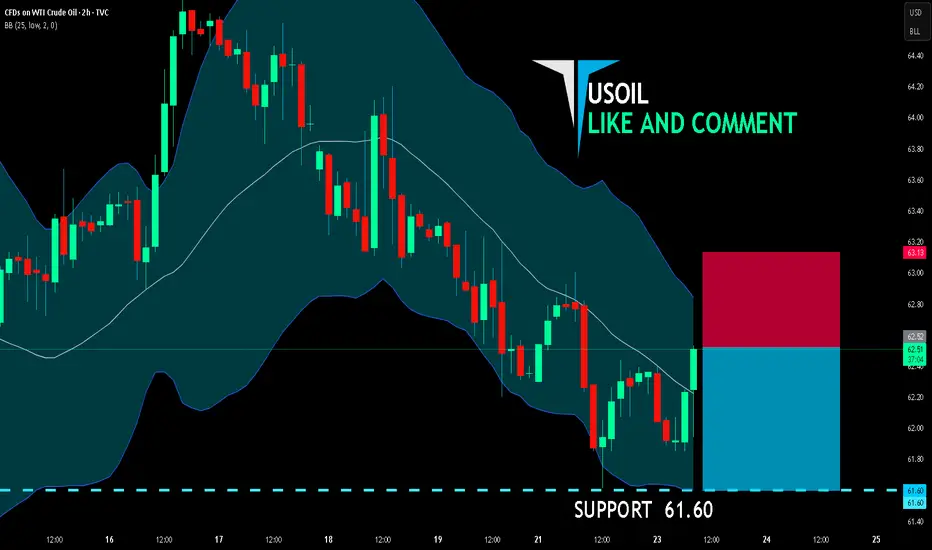
USOIL SHORT FROM RESISTANCE
USOIL SIGNAL
Trade Direction: short
Entry Level: 62.52
Target Level: 61.60
Stop Loss: 63.13
RISK PROFILE
Risk level: medium
Suggested risk: 1%
Timeframe: 2h
Disclosure: I am part of Trade Nation's Influencer program and receive a monthly fee for using their TradingView charts in my analysis.
✅LIKE AND COMMENT MY IDEAS✅
AUD/USD BEARS WILL DOMINATE THE MARKET|SHORT
AUD/USD SIGNAL
Trade Direction: short
Entry Level: 0.660
Target Level: 0.657
Stop Loss: 0.661
RISK PROFILE
Risk level: medium
Suggested risk: 1%
Timeframe: 1h
Disclosure: I am part of Trade Nation's Influencer program and receive a monthly fee for using their TradingView charts in my analysis.
✅LIKE AND COMMENT MY IDEAS✅

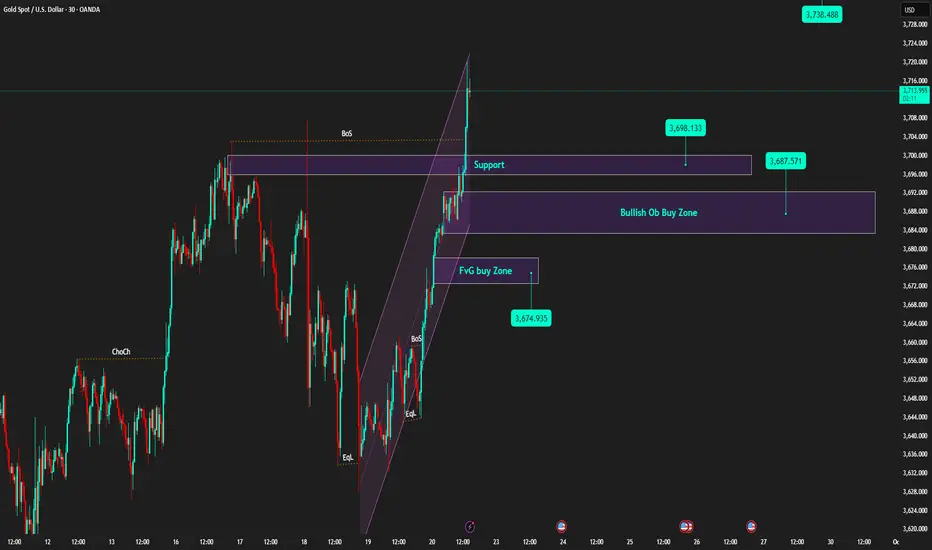
Weekly Candle High | Buy on Pullbacks to Support🟡 XAU/USD – 09/22 | Captain Vincent ⚓
🔎 Captain’s Log – Quick Overview
Last week, gold closed around 3,685, paving the way for further advances and the creation of a new ATH.
After the FED cut 25bps, Powell's 'brake' comments tempered the rise, but the overall trend remains bullish.
This morning, prices surged to 3,697.xx, currently adjusting slightly around 3,692 – 3,690 → a sensible strategy: wait for a pullback to continue Buying.
⏩ Captain’s Summary: The gold voyage still heads North, Buying remains the main choice, but wait for a pullback to board.
📈 Captain’s Chart – Technical Analysis
Golden Harbor (Support / Buy Zone):
Thin support: ~3,698 (recently broken old range peak).
OB Dock: 3,687 – 3,690.
FVG Dock: 3,672 – 3,676 (liquidity check on deep adjustments).
Storm Breaker (Resistance / Sell Zone):
3,714 – 3,720 (supply cluster / old ATH – likely to react).
Price Structure:
Continuous BoS series, price breaks out of short-term rising channel and creates higher highs → bullish remains the main trend.
🎯 Captain’s Map – Trading Plan (before US session)
✅ Buy (trend priority)
Buy Zone 1
Entry: 3,698 – 3,701
SL: 3,688
TP: 3,706 – 3,714 – 3,720+
Buy Zone 2 (OB)
Entry: 3,687 – 3,690
SL: 3,680
TP: 3,698 – 3,706 – 3,714 – 3,72x
Buy Zone 3 (FVG)
Entry: 3,672 – 3,676
SL: 3,664
TP: 3,687 – 3,706 – 3,714
⚡ Sell (only scalp when overbought)
Sell Zone (ATH test)
Entry: 3,740 – 3,738
SL: 3,750
TP: 3,730 – 3,720 – 3,695
Captain’s Note ⚓
“The new week opens with a high-closing candle, the gold ship continues its bullish course. Golden Harbor 🏝️ (3,690 – 3,672) is a safe anchorage for the crew to watch for Buys. Storm Breaker 🌊 (3,714 – 3,720) is a wave peak prone to gusts, suitable for Quick Boarding 🚤 short-term scalps. Before the US session, the sea might be choppy – hold the wheel tight and manage volume wisely.”
XAUUSD – Wolfe Waves Forming on H4 ChartHello Trader,
On the H4 chart, gold is forming a fairly classic Wolfe Waves pattern. The fifth wave has completed, and the price is entering the critical resistance zone of 3760 – 3770, which is also a potential Sell Zone. With the current structure, the preferred scenario is a short-term downward correction before the main trend resumes.
Technical Analysis
The price has touched the 2.618 Fibonacci Extension and reacted downward, indicating profit-taking pressure.
The MACD still shows strong previous buying momentum, but the histogram is starting to weaken, aligning with the potential for a corrective wave.
Area 3760 – 3770: a critical resistance zone, coinciding with the fifth wave of the Wolfe Waves.
Trading Scenario
Sell Order According to Wolfe Waves
Entry: 3760 – 3770
SL: 3782 (above resistance zone)
TP: 3710 -3660 -3610 – 3620 (key level Wolfe target)
Sell when price confirms below the trendline
Entry 3727-3730
sl 3735
tp 3715-3700-3686-3665
Short-term Buy Scalping
Entry: 3705 – 3708
SL: 3700
TP: 3720-3730 – 3745- 3766
Note: This is just a short-term retracement strategy, counter to the correction, so risk management is crucial.
Conclusion
Short-term: Prioritize observing reversal signals at 3760 – 3770 for a Sell.
Medium-term: Wait for Buy opportunities around 3564 – 3574 to align with the main trend.
The market is entering a distribution and correction phase, so patiently waiting for candle confirmations at key areas will be key to optimizing entry.
This is the Wolfe Waves scenario I propose for gold during this period. Feel free to refer and adjust according to your own strategy.
Follow me for the fastest updates when the price structure changes.

EURUSD – H1 Trading Scenario
EURUSD is currently testing the rising trendline resistance, which also coincides with a prior liquidity accumulation zone during the previous bearish leg. A reaction from this area is highly likely.
That said, the corrective phase is not yet over, and several Fibonacci retracement levels remain untested. This leaves room to continue expecting further upside momentum.
The plan is to look for buy opportunities at zones where liquidity gaps (FVG) appear, with stops placed at nearby support levels. On the other hand, sell setups will be considered at Fibonacci retracement levels, prioritising short-term profit taking through scalping.
Trading Scenarios
Buy Setup
Entry: 1.1750 – 1.1760
Stop Loss: 1.1720
Take Profit: 1.1785 – 1.1810 – 1.1855
Sell Setup
Entry: 1.1820 – 1.1830
Stop Loss: 1.1860
Take Prfit: 1.1790 – 1.1765 – 1.1730 – 1.1710
You can use this scenario as a reference to shape your own trading plan. Stay tuned for my next updates to catch new setups in real time.

GBPUSD – Technical Analysis on H1GBPUSD – Technical Analysis on H1
On the GBPUSD chart, the Elliott Wave count suggests that wave 5 may have already completed, and the final ABC corrective cycle is now in progress. While this remains a corrective expectation, it aligns with the broader downward channel currently in play.
Price action at the termination of wave 5 coincided with a prior resistance zone, adding further weight to the expectation of a pullback from this level.
The plan now is to look for buying opportunities on minor retracements as price seeks liquidity, while also keeping an eye on short setups around resistance.
Trading Scenarios
Buy Setup
Entry: 1.3480 – 1.3490
Stop Loss: 1.3450
Take Profit: 1.3510 – 1.3535 – 1.3560 – 1.3600
Sell Setup
Entry: 1.3530 – 1.3540
Stop Loss: 1.3570
Take Profit: 1.3515 – 1.3490 – 1.3460 – 1.3430
I hope this trading outlook proves useful for you. Stay tuned for more updates and let’s follow the market closely together.

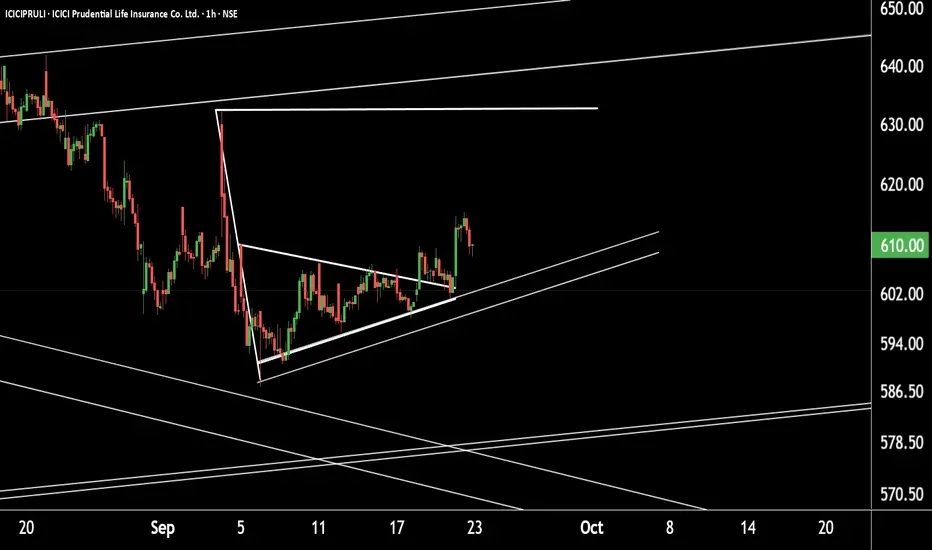
Securing growth with ICICI Prudential Life –A BUY for the futureTechnical Update: ICICI Prudential Life Insurance (1H Timeframe)
ICICIPRULI is currently moving in a Higher High – Higher Low (HH-HL) structure, indicating a strong uptrend. The stock is taking support near the ₹595–600 zone.
f this level is sustained, we may see the stock move towards its pattern target at ₹632–640.
Thank you!
EURUSD: wedge narrowing with downside targets in sightOn the daily chart, EURUSD has formed a rising wedge pattern, and the current price action indicates readiness for a decline. Attempts to hold above 1.1800 have failed, pressure has increased, and last week’s close can be viewed as a potential false breakout.
The first downside target is at 1.1413, where a strong support level lies. Further targets may shift to 1.0750 and 1.0480 levels that have accumulated significant volume over the past few months. A full breakdown of the wedge would give momentum to the bearish scenario and increase pressure on the euro.
From a fundamental perspective, the picture remains mixed: the 200 EMA capping from above and the sideways movement in the dollar index confirm the likelihood of euro weakness, but every pullback continues to be aggressively bought, preventing a collapse. If the dollar gains additional support from US macroeconomic data or Federal Reserve policy, the bearish scenario will become dominant.
