GBP/AUD SENDS CLEAR BEARISH SIGNALS|SHORT
GBP/AUD SIGNAL
Trade Direction: short
Entry Level: 1.971
Target Level: 1.964
Stop Loss: 1.975
RISK PROFILE
Risk level: medium
Suggested risk: 1%
Timeframe: 1h
Disclosure: I am part of Trade Nation's Influencer program and receive a monthly fee for using their TradingView charts in my analysis.
✅LIKE AND COMMENT MY IDEAS✅
Technical Analysis

CHF/JPY LONG FROM SUPPORT
CHF/JPY SIGNAL
Trade Direction: long
Entry Level: 199.294
Target Level: 200.072
Stop Loss: 198.773
RISK PROFILE
Risk level: medium
Suggested risk: 1%
Timeframe: 1h
Disclosure: I am part of Trade Nation's Influencer program and receive a monthly fee for using their TradingView charts in my analysis.
✅LIKE AND COMMENT MY IDEAS✅

AUD/NZD BEARISH BIAS RIGHT NOW| SHORT
Hello, Friends!
AUD/NZD is trending down which is evident from the red colour of the previous weekly candle. However, the price has locally surged into the overbought territory. Which can be told from its proximity to the BB upper band. Which presents a beautiful trend following opportunity for a short trade from the resistance line above towards the demand level of 1.157.
Disclosure: I am part of Trade Nation's Influencer program and receive a monthly fee for using their TradingView charts in my analysis.
✅LIKE AND COMMENT MY IDEAS✅

CAD/CHF BEST PLACE TO BUY FROM|LONG
CAD/CHF SIGNAL
Trade Direction: long
Entry Level: 0.568
Target Level: 0.570
Stop Loss: 0.567
RISK PROFILE
Risk level: medium
Suggested risk: 1%
Timeframe: 1h
Disclosure: I am part of Trade Nation's Influencer program and receive a monthly fee for using their TradingView charts in my analysis.
✅LIKE AND COMMENT MY IDEAS✅

ADAUSDT - 1H - WHAT TO EXPECT TODAY ? 03-02-2026ADAUSDT - still kinda on the "move" and after some "INSTITUTIONAL" manipulations will continue DOWN...
Sadly any Set- Ups for trades "mutated " and multiply to 5m failed set ups, developed institutional "accumulation" and SL sweep range .
I'm not going to repost a pretty much similar charts for the most crypto pairs. After some analysing by your self you will find a plenty of Institutional manipulations today...
Stay "SAFE" today, don't rush with entering trades, seems going to be Loss Stop "hunting" day...
Educational "piece":
An Institutional Stop Loss (SL) Sweep (also known as a liquidity sweep or stop hunt)
is a trading concept within Smart Money Concepts (SMC)
where large financial institutions deliberately drive prices beyond well-defined support or resistance levels to trigger the clustered stop-loss orders of retail traders
Chart is itself explaining. Kept a "KISS" approach all the way ( "Keep It Simple, Stupid") & beginners friendly... ;)
I do hope that nobody ignoring SL ( Stop Loss) ! Without it, It is a fastest way to loose hard earned money...
;)
Trade safe & don't do "gambling". In the end it never pays, not worth it to risk loose all your $...
PS: above technical analysis is done for the community & educational purpose only! It is not a financial advice. Just share my very own insight to it.

AUDUSD: Aussie Resumes Higher After RBA Lifts RatesThe Australian dollar is rebounding strongly as the RBA’s rate hike reinforces the bullish Elliott Wave structure and supports further upside momentum.
AUDUSD is posting strong gains after bouncing today in response to the RBA’s decision to lift the key interest rate. From a technical perspective, price has been trending higher since breaking out of the base channel in mid-January, and this type of breakout confirms that the market remains in an extended impulsive phase. This suggests that wave three, or wave C, is still unfolding.
Importantly, the larger black wave three cycle is not complete yet and should continue to subdivide into five waves. Therefore, after the current retracement phase, further upside is expected into wave 5 of 3/C. Ideally, price should hold above the 0.69–0.70 support zone, which also represents a key psychological level and an important technical floor.

BTCUSDT - "GAME " ON 2m CHART, A QUICK SELL SET UP - 02-02-2026BTCUSDT - G-Money's short version analysis based purely on technical analysis only, no nonsense or "BS". I do totally ignore any fundamental analysis, technical analysis only
BTCUSDT - still kinda on the "move" and continue DOWN... (2m TRADE, RISKY...)
Who did enter this trade earlier congratulations! Who missed it... See you next time! ;)
Chart is itself explaining. Kept a "KISS" approach all the way ( "Keep It Simple, Stupid") & beginners friendly... ;)
I do hope that nobody ignoring SL ( Stop Loss) ! Without it, It is a fastest way to loose hard earned money...
;)
Trade safe & don't do "gambling". In the end it never pays, not worth it to risk loose all your $...
PS: above technical analysis is done for the community & educational purpose only! It is not a financial advice. Just share my very own insight to it.

BTCUSDT - 2m UPDATE, EXIT WITH PARTIAL PROFIT 03-02-2026BTCUSDT - still kinda on the "move" and after some "INSTITUTIONAL" manipulations will continue DOWN...
Who did enter this trade earlier congratulations! Who missed "BE" Stop Loss... See you next time! ;)
Sadly 2m "quick" trade "mutated " and multiply to 5m failed set ups, developed institutional "accumulation" and SL sweep range .
"BE" Stop Loss exits from 2 trades ( Leverage * 50 = +60%P/L and LEV.*20=+6% P/L )
Stay "SAFE" today, don't rush with entering trades, seems going to be Loss Stop "hunting" day...
Educational "piece":
An Institutional Stop Loss (SL) Sweep (also known as a liquidity sweep or stop hunt)
is a trading concept within Smart Money Concepts (SMC)
where large financial institutions deliberately drive prices beyond well-defined support or resistance levels to trigger the clustered stop-loss orders of retail traders
Chart is itself explaining. Kept a "KISS" approach all the way ( "Keep It Simple, Stupid") & beginners friendly... ;)
I do hope that nobody ignoring SL ( Stop Loss) ! Without it, It is a fastest way to loose hard earned money...
;)
Trade safe & don't do "gambling". In the end it never pays, not worth it to risk loose all your $...
PS: above technical analysis is done for the community & educational purpose only! It is not a financial advice. Just share my very own insight to it.

GBPUSD Bearish Breakdown | Smart Money Targets 1.3500GBPUSD has shifted from a strong bullish impulse into a clear corrective and distribution phase, signaling potential bearish continuation in the near term.
Price previously respected a rising structure, creating higher highs and higher lows. However, after tapping into a major supply zone near 1.3850, bullish momentum weakened significantly. Multiple rejections from this premium area confirm the presence of strong institutional selling pressure.
📉 Market Structure Breakdown
Price has broken below internal support around 1.3720–1.3700
Bearish candles with momentum show loss of bullish control
Structure now favors lower highs → bearish bias
🧱 Key Zones to Watch
Supply Zone (Resistance): 1.3800 – 1.3850
Broken Support / Flip Zone: 1.3720 – 1.3740
Major Demand Zone (Target): 1.3500 – 1.3480
📊 Indicator Confirmation
Histogram shows increasing bearish momentum
Momentum divergence aligns with the downside projection
Volume fades on pullbacks, favoring continuation lower
🔮 Price Outlook
A corrective pullback toward the 1.3740–1.3780 zone could offer selling opportunities. If price fails to reclaim this level, a strong bearish move toward 1.3500 demand is likely, as illustrated in the projected path.

Angel One Ltd | Weekly Chart | Compression Phase AnalysisAngel One has transitioned from a strong impulsive uptrend into a prolonged consolidation and compression structure. Price is currently trading inside a symmetrical triangle, indicating balance between demand and supply after a volatile expansion phase.
This is a classic volatility contraction setup on a higher timeframe.
Trend & Market Structure:
The stock witnessed a sharp vertical rally followed by heavy profit booking.
Post the top, price has been forming lower highs and higher lows, converging into a symmetrical triangle.
This structure reflects institutional digestion, not weakness.
The broader trend remains structurally bullish, but momentum is paused.
Pattern Insight
Pattern: Symmetrical Triangle (Weekly)
Nature: Continuation / Expansion setup
Implication: Directional move expected once price exits the structure decisively
Compression on a weekly timeframe often leads to large directional moves.
Key Price Zones:
Major Supply Zone (Upper): ₹3,700 – ₹3,850
→ Strong historical rejection
→ Long-term supply / distribution area
Intermediate Supply: ₹3,200 – ₹3,300
→ Multiple failed attempts
→ Acts as a trend-deciding zone
Triangle Support: ~₹2,200 – ₹2,300
→ Buyers consistently defending this area
Current Equilibrium Price: ~₹2,550
→ Midpoint of the structure
→ Decision zone
Final View
Angel One is coiling on the weekly chart after a massive expansion.
Such structures usually resolve with force, but direction is decided by breakout, not bias.
📌 Compression = Energy storage
📌 Breakout = Direction
📌 Volume = Confirmation
Educational analysis only. Not a buy/sell recommendation.

GBPJPY: Important Breakout 🇬🇧🇯🇵
I see a confirmed breakout of a major daily horizontal resistance on GBPJPY.
The market will continue rising and reach 213.7 level soon.
❤️Please, support my work with like, thank you!❤️
I am part of Trade Nation's Influencer program and receive a monthly fee for using their TradingView charts in my analysis.

Gold Breaks Its Trend – Sellers Take ControlAfter a sharp rally to record highs, XAUUSD has officially entered a structural weakening phase , no longer just a normal corrective pullback. Pressure from a stronger USD, expectations that the Fed will maintain a hawkish stance, and aggressive profit-taking in the derivatives marke t have all combined to drain gold of its short-term bullish momentum.
On the chart, the downtrend is becoming increasingly clear . Price has been rejected repeatedly at higher resistance zones, forming a sequence of lower highs, while the descending trendline continues to act as a key ceiling. The fact that price is trading below the Ichimoku cloud signals that sellers are firmly in control of the short- to medium-term trend.
The current rebound toward 4,850 is purely technical in nature. If price fails to break above this area and gets rejected again, selling pressure is likely to resume . In that case, the 4,350 zone becomes the next logical target, where the market may pause and react.
Overall, both the news backdrop and price structure are aligned to the downside . In this environment, the more appropriate strategy is to prioritize trend-following trades, patiently waiting for pullbacks to look for sell opportunities, rather than trying to catch a falling knife while sellers remain dominant.

#NIFTY Intraday Support and Resistance Levels - 03/02/2026Nifty is expected to open with a strong bullish gap-up of around 500–800+ points, which clearly reflects positive sentiment and aggressive buying interest in the market. Such a gap-up generally indicates overnight strength driven by global cues or strong domestic triggers, and it often puts immediate pressure on short positions. However, traders should stay alert during the opening minutes, as large gap-ups can initially show volatility or brief profit booking before the real directional move unfolds.
From a technical view, the zone around 25550 will be the first crucial level to watch. If Nifty sustains above this level after the opening, it will confirm bullish continuation. In that scenario, the index can gradually move towards 25750, 25800, and 25950+. Further strength above 26050 will signal a higher breakout, opening the path for extended targets around 26150, 26200, and 26250+, keeping the broader trend decisively positive.
On the downside, despite the gap-up bias, traders must remain cautious of false breakouts. The level near 25450 will act as an important support. If Nifty slips below this zone and fails to reclaim it, it may indicate early profit booking after the gap-up. In such a case, a corrective move towards 25350, 25300, and 25200 cannot be ruled out, especially if selling pressure increases near resistance zones.
Overall, the structure remains bullish as long as Nifty holds above key support levels, and buying on dips is likely to be the preferred strategy. Traders are advised to avoid chasing prices at the open, wait for confirmation near important levels, and manage risk strictly, as gap-up sessions often bring sharp intraday swings along with strong trending opportunities.

#BANKNIFTY PE & CE Levels(03/02/2026)Bank Nifty is expected to witness a very strong gap-up opening, potentially in the range of 1000+ points, indicating a sharp bullish sentiment at the start of the session. This kind of opening usually reflects aggressive short covering combined with fresh long build-up, especially after the heavy selling pressure seen in the previous sessions. However, such large gap-ups are often followed by high volatility, so traders should avoid impulsive entries in the first few minutes and instead observe price behavior near key levels.
From a technical perspective, the immediate focus will be on how Bank Nifty behaves above the 59550–59600 zone. If the index sustains above this region after the opening volatility, it will confirm bullish strength. In that case, a continuation move towards 59750, 59850, and 59950+ can be expected. A clean breakout and hold above 60050 would further strengthen the bullish structure, opening the gates for higher upside targets around 60250, 60350, and even 60450+ in the coming sessions.
On the flip side, traders must remain cautious despite the positive opening. The zone around 59450–59400 will act as a crucial intraday support. If the index fails to hold above this level and starts slipping back, it may indicate profit booking after the gap-up. In such a scenario, a pullback towards 59250, 59150, and 59050 is possible. A sustained move below 59050 would weaken the bullish momentum and may shift the market back into a consolidation or corrective phase.
Overall, the broader sentiment for the day remains bullish, supported by the expected massive gap-up opening. Still, the key lies in sustainability above major resistance-turned-support zones. Traders are advised to trade with discipline, wait for confirmation near important levels, and manage risk strictly, as gap-up days often bring sharp intraday swings in both directions.

XAGUSD -WHO IS GOOD IN "TRIANGLES"? ?? COMMENT PLEASE 02-02-2026XAGUSD - G-Money's short version analysis based purely on technical analysis only, no nonsense or "BS". I do totally ignore any fundamental analysis, technical analysis only
I was always not so good with triangle, any ideas ??? Just wonder... 5m/15m/30m charts...
XAGUSD - still not in my technical analysis range...
Chart is itself explaining. Kept a "KISS" approach all the way ( "Keep It Simple, Stupid") & beginners friendly... ;)
I do hope that nobody ignoring SL ( Stop Loss) ! Without it, It is a fastest way to loose hard earned money...
;)
Trade safe & don't do "gambling". In the end it never pays, not worth it to risk loose all your $...
PS: above technical analysis is done for the community & educational purpose only! It is not a financial advice. Just share my very own insight to it.

ADAUSDT - ACCUMULATION/INSTITUTIONAL/RETAIL SL 03-02-2026ADAUSDT - G-Money's short version analysis based purely on technical analysis only, no nonsense or "BS". I do totally ignore any fundamental analysis, technical analysis only
ADAUSDT - still kinda on the "move" and continue DOWN...All the way down to 0.2000-0.1880 ....
ACCUMULATION PHASE, Institutional traders gonna to "clear up" a plenty retail stop loses again....
Thought of the day: sometimes you can "win" much more money by not trading...
Wisdom of G-Money2022 :)
Chart is itself explaining. Kept a "KISS" approach all the way ( "Keep It Simple, Stupid") & beginners friendly... ;)
I do hope that nobody ignoring SL ( Stop Loss) ! Without it, It is a fastest way to loose hard earned money...
;)
Trade safe & don't do "gambling". In the end it never pays, not worth it to risk loose all your $...
PS: above technical analysis is done for the community & educational purpose only! It is not a financial advice. Just share my very own insight to it.

BTCSince my first forecast regarding the BINANCE:BTCUSDT.P decline 2 months ago, the asset has dropped by 27%.
As of today, my global outlook on the market remains bearish. The first significant target is 78,200.2. Once reached, it will be necessary to assess the character of the price movement there.
While we move toward this target, the entire market will also likely head down. This creates excellent opportunities to profit, as the market is moving rather than standing still.
Subscribe to not miss updates.

CCUSDT.P: long setup from daily resistance at 0.18270BINANCE:CCUSDT.P has been in a prolonged accumulation phase. Notably, it did not crash to the lows after listing, indicating the asset is liquid and supported.
Yesterday's daily candle closed right at its High, near the resistance level. This is a very strong signal that the trend is likely to continue. Today, we have been consolidating below the level all day, and right now, the price is hugging it closely. The 4H timeframe also closed at its highs.
The probability of a breakout is extremely high.

AXSUSDT.P: short setup from 4h support at 2.043BINANCE:AXSUSDT.P has entered a consolidation phase following a strong rally. This range is wide enough to allow for trading inside the structure.
I have identified a local level, relying primarily on the 4H timeframe. The asset has been trading just above this support for an extended period. Recently, there was a tap on the level, and now we are seeing a close retest developing — this is a strong bearish (Short) signal.
Since this is an intra-range trade and not a breakout from the major consolidation channel, we might not see a massive move. However, securing a solid 5R (5 to 1) risk-to-reward ratio is highly feasible.

ENSOUSDT.P: long setup from daily resistance at 1.6399BINANCE:ENSOUSDT.P is in a bullish trend. After a strong rally, it consolidated for a few days. Now, a solid pre-breakout base is forming right under the 1.6399 resistance, which acts as the upper boundary of the trading channel.
I have mixed feelings about the Daily timeframe because the asset has already extended significantly today. However, on the 4H timeframe, we see clear price compression towards the level with decreasing volatility. On the 5m chart, the price tested the level multiple times without a deep rejection or correction, which would be the normal reaction here.
The logic: When we don't see the expected reaction (a pullback), that catches my attention. If an asset rallies hard and still has the strength to hold highs and consolidate right under resistance, it signals a strong buyer.
Conditions: Volatility must not increase before the breakout. The entry must strictly follow the system rules. Given the overextended Daily chart (which is the primary one), I will be extremely cautious with this trade, or might skip it entirely if the setup isn't perfect.

ENSOUSDT: short setup from daily support at 1.2632BINANCE:ENSOUSDT.P is correcting as expected following the pump.
The initial decline halted at the 1.2632 level. The following day, we witnessed a False Breakout relative to this price, which confirms the level's validity (as a False Breakout can only occur relative to a significant level). Essentially, a False Breakout represents the asset's inability to sustain a price below or above a certain point.
What do we see next? weakness. The asset failed to take out yesterday's High. Since we cannot go up, we are now seeing a gradual approach — a slow bleed — back toward our established support at 1.2632.
This gradual approach is clearly visible on the 4H timeframe and signals a strong bearish intent. This is not a panic dump; it is a methodical move where every limit buy order standing in the way is being slowly and confidently absorbed. Such clarity and precision in price action suggest that strong capital is driving this move.
Therefore, the breakdown of this level is simply a matter of time. Disclaimer: This is the crypto market. Anything can happen at any moment, and even the most professional analysis can be invalidated instantly. Always remember this.

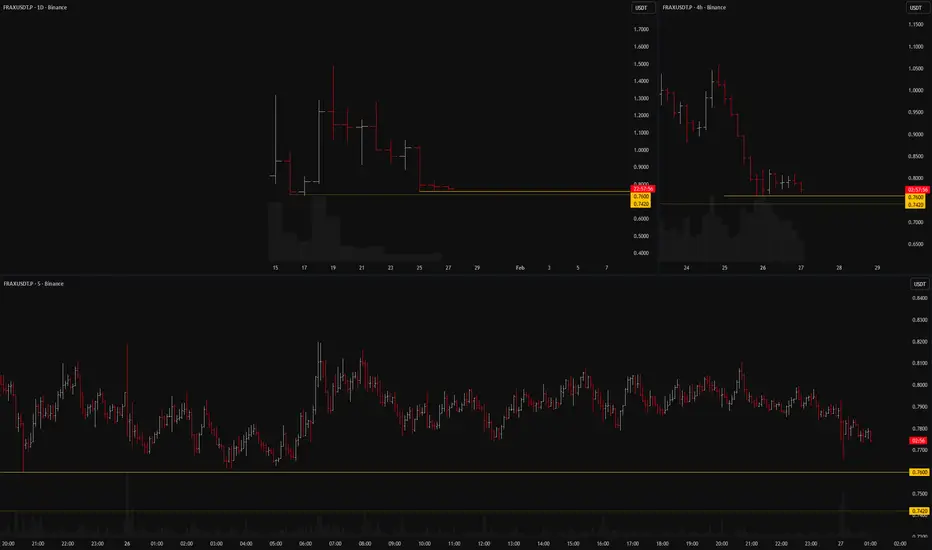
FRAXUSDT: short setup from daily support at 0.76BINANCE:FRAXUSDT.P is confidently approaching its all-time lows.
Right now, the price is consolidating above the 0.76 level, positioning itself, in my view, for further downside. What caught my attention is the massive drop on Jan 25, followed by the asset simply "hanging" just above the support with minimal volatility. Normally, volatility decreases gradually. Here, we saw a ~25% crash, and the very next day, volatility dropped by a factor of 3.5. This is abnormal.
Two negative factors:
High volatility on the working timeframe (5m).
Immediately below 0.76 lies the historical low (ATL) of 0.742, which could act as an obstacle to a free fall.
My Plan:
Given these factors, I am waiting for the character of the movement to change. Before the breakout, a clean entry point must form on low volatility. I need to see abnormal calmness for this asset — no large, erratic bars.
Looking at the 4H timeframe, observing how cleanly the asset is consolidating and how many times it has hit the 0.76 support, I would still look to initiate a Short from this level.
SILVER BULLS ARE STRONG HERE|LONG
Hello, Friends!
SILVER pair is in the downtrend because previous week’s candle is red, while the price is obviously falling on the 4H timeframe. And after the retest of the support line below I believe we will see a move up towards the target above at 10,123.0 because the pair oversold due to its proximity to the lower BB band and a bullish correction is likely.
Disclosure: I am part of Trade Nation's Influencer program and receive a monthly fee for using their TradingView charts in my analysis.
✅LIKE AND COMMENT MY IDEAS✅
