NASDAQ doesn’t move randomly. It hunts liquidity.CAPITALCOM:US100 Price is currently trading inside a broken OG zone, after a clear distribution phase from the premium area.
Market structure remains bearish, with lower highs and weak upside reactions.
Short-term outlook (15M)
• Price failed to hold above the broken OG zone
• No strong bullish displacement or acceptance above resistance
• Liquidity is still resting below current price
• Expectation: continuation to the downside to sweep short-term liquidity
Mid-term outlook (1H)
• Overall structure remains bearish
• Previous OG zone acting as resistance
• Unfilled liquidity remains below the range lows
• As long as price stays below the broken zone, shorts remain valid
My expectation
I expect price to take the liquidity below and deliver a minimum 50-point drop from the current levels.
Any pullback into the broken OG zone can be considered a sell opportunity, as long as structure does not shift.
Technical Analysis

TAKEUSDT: short setup from daily support at 0.11000This case study highlights the critical significance of the asset's Listing Price level. At a minimum, it acts as a strong psychological barrier. At best, after 118 days of trading, we witnessed a pixel-perfect retest of this exact level — just look at how powerful the subsequent drop was.
I prioritize such setups because they heavily tilt the scales from a standard 50/50 toss-up to a solid statistical advantage in my favor. Several other confluence factors also strengthened this scenario, boosting the trade's profitability above the baseline. Clean charts like this are a rarity.
Relative to the 72% crash, the BINANCE:TAKEUSDT.P displays zero intent to correct, at least for now. The longer the accumulation continues above this support, the higher the likelihood of a breakdown. This market anomaly signals either a total vacuum of buyers or overwhelming selling pressure.
The scenario I expect:
Price void / low liquidity zone beyond level
Asset decoupled from the market (relative strength/weakness vs. BTC)
Momentum stall at the level
No reaction after a false break
Closing near the level
Closing near the bar's extreme
The chart displays negative factors:
Lack of consolidation
Was this analysis helpful? Leave your thoughts in the comments and follow to see more.

AUDUSD: Bullish Pullback Within Uptrend!!Hey Traders,
In today’s trading session, we are monitoring AUDUSD for a potential buying opportunity around the 0.66500 zone.
Technically, AUDUSD continues to trade within a well-defined uptrend and is currently in a healthy correction phase. Price is approaching the 0.66500 support zone, which coincides with trend support and a key structure level — an area where buyers have previously stepped in.
As long as this level holds, the broader bullish bias remains valid, with pullbacks seen as potential continuation setups rather than reversals.
Trade safe,
Joe

4 Continuation Patterns Every Trader Must KnowWelcome back to another Mubite educational guide.
In trading, trends rarely move in a straight line. They pause, take a breath, and consolidate
before pushing forward. Unfortunately, many amateur traders mistake these healthy pauses for
reversals and panic-sell their positions too early.
To maximize your profits, you must learn to identify Continuation Patterns . These specific formations signal that the market is simply resting and the prevailing trend is about to resume.
Mastering these allows you to ride the trend to its full potential.
Here are the top 4 patterns you need to master.
1. The Rising Three Methods (Bullish)
This is a powerful pattern that occurs during a sustained uptrend. It represents a pause where
bulls take a break, but bears fail to push the price down significantly.
Structure:
1. Long Bullish Candle: A large green candle in line with the uptrend.
2. Three Small Bearish Candles: Three small red bodies that stay within the high
and low range of the first candle.
3. The Breakout Candle: A final large bullish candle that closes above the close of
the first candle.
● Psychology: The small pullback tricks weak hands into selling, but buyers step back in
with force, confirming the uptrend is still alive.
2. The Falling Three Methods (Bearish)
The opposite of the Rising Three, this pattern occurs in a downtrend and signals that selling
pressure is far from over.
Structure:
1. Long Bearish Candle: A large red candle in line with the downtrend.
2. Three Small Bullish Candles: Three small green bodies that retrace slightly but
stay within the range of the first candle.
3. The Breakout Candle: A final large bearish candle that closes below the close of
the first candle.
● Psychology: Sellers take profits, causing a small bounce, but buyers lack the conviction
to reverse the trend. Sellers return to push prices to new lows.
3. The Tasuki Gap (Upside & Downside)
Gaps are significant in price action. The Tasuki Gap is a unique continuation pattern that uses a
gap to confirm trend strength.
Upside Tasuki Gap (Bullish): A bullish candle is followed by another bullish candle that
"gaps up." The third candle is bearish and closes into the gap but does not close it
completely.
Signal: If the gap remains open, it acts as support. The trend is still up.
Downside Tasuki Gap (Bearish): A bearish candle is followed by another bearish
candle that "gaps down." The third candle is bullish and closes into the gap but does not
fill it.
Signal: The unfilled gap acts as resistance. The trend is still down.
4. Mat Hold Pattern (Bullish)
This is arguably one of the strongest continuation signals in Crypto and Forex trading. It is very
similar to the Rising Three Methods but shows even stronger bullish pressure.
● Structure: A long bullish candle is followed by a gap up and three small candles that
drift lower but stay well above the open of the first candle. A final large candle
continues the uptrend.
● The Difference: In a Mat Hold, the pullback is shallow (usually staying in the upper half
of the first candle's range), showing that bears have almost no power to push price
down.
3. The Tasuki Gap (Upside & Downside)
Gaps are significant in price action. The Tasuki Gap is a unique continuation pattern that uses a
gap to confirm trend strength.
● Upside Tasuki Gap (Bullish): A bullish candle is followed by another bullish candle that
"gaps up." The third candle is bearish and closes into the gap but does not close it
completely.
○ Signal: If the gap remains open, it acts as support. The trend is still up.
● Downside Tasuki Gap (Bearish): A bearish candle is followed by another bearish
candle that "gaps down." The third candle is bullish and closes into the gap but does not
fill it.
○ Signal: The unfilled gap acts as resistance. The trend is still down.
4. Mat Hold Pattern (Bullish)
This is arguably one of the strongest continuation signals in Crypto and Forex trading. It is very
similar to the Rising Three Methods but shows even stronger bullish pressure.
● Structure: A long bullish candle is followed by a gap up and three small candles that
drift lower but stay well above the open of the first candle. A final large candle
continues the uptrend.
● The Difference: In a Mat Hold, the pullback is shallow (usually staying in the upper half
of the first candle's range), showing that bears have almost no power to push price
down.
__________________________________________________________________________________
TRADING TIP: Context is King
Just like reversal patterns, continuation patterns must be traded with intent.
1. Volume Analysis: Look for lower volume during the "pause" (the small middle candles)
and exploding volume on the breakout candle.
2. Trend Confirmation: These patterns only work if there is an established trend. Do not
look for them in a chopping/ranging market.
__________________________________________________________________________________
Disclaimer: This analysis by Mubite is for educational purposes only and does not constitute
financial advice. Always manage your risk.
Which of these 4 patterns do you see most often on the Bitcoin chart? Let us know in the
comments below!

Welcome 2026 — A New Year for Better TradesHappy New Year 2026, Traders.
2025 has been a year that truly tested every trader strong volatility, constant macro shifts, and markets that rewarded discipline while punishing emotional decisions. This year reminded us that profitability does not come from being right once, but from managing risk correctly over hundreds of trades. There were winning trades that built confidence, and losing trades that reinforced an essential truth: the market is always right, and our job is to adapt.
As we step into 2026, I wish every trader a strong and stable mindset. Trade with a plan, respect your stop-loss without hesitation, and never let emotions override structure. May you stay calm during sudden spikes, remain disciplined during winning streaks, and trust your system during drawdowns. Consistent profits are the result of patience and execution not speed or prediction.
May 2026 be a year of clean trading: fewer impulsive trades, less FOMO, more high-quality setups, and a steadily rising equity curve over time. Wishing you good health, mental clarity, and continuous growth as a trader. Happy New Year 2026.

USDCHF – Demand Zone Bounce & Bullish Continuation SetupUSDCHF – H4 Technical Analysis
USDCHF prices have been moving sideways / range-bound on the H4 timeframe for quite some time. The chart clearly shows an upper Supply zone and a lower Demand zone, with price reacting between these two key areas.
Demand Zone Reaction:
Yesterday’s candlestick showed a strong reaction from the Demand zone. From this area, bullish momentum has developed, confirming the presence of buyers. Price has bounced from demand and started moving upward.
Momentum Outlook:
The current market structure suggests that buyers are gaining control. As long as price holds above the Demand zone, the probability of further upside continuation remains strong.
Expected Move:
If this bullish momentum continues, price is likely to move toward the upper Supply zone.
Confirmation (Lower Timeframe):
If a strong candle closes above the Supply zone on the H1 timeframe, then the probability of price reaching the next higher target increases significantly.

Gold After the Flush — Stabilization, Not ReversalOn the 1H timeframe, Gold (XAU/USD) has just completed a sharp impulsive sell-off, breaking the prior short-term structure and accelerating downside momentum. The decline was fast and vertical, suggesting liquidity-driven selling rather than a controlled trend transition. This type of move typically exhausts sellers in the short term but does not automatically signal a trend reversal.
After the sell-off, price is now stabilizing above a clearly defined support zone around 4,300–4,320. The current candles show smaller bodies and overlapping ranges, indicating that bearish momentum has slowed. However, this behavior should be interpreted as temporary absorption, not confirmation of bullish control. Structurally, the market remains below the descending trendline that guided the sell-off.
From a price action perspective, the rebound from support is corrective in nature. The market is forming a sequence of short-term higher lows, but these are developing inside a broader bearish leg, not as part of a confirmed trend change. Until price reclaims and holds above the prior breakdown area near 4,380–4,400, upside moves should be treated as pullbacks rather than trend continuation.
In terms of market context, this type of reaction is typical after a high-volatility flush, especially ahead of low-liquidity periods and year-end positioning. With no immediate macro catalyst forcing aggressive dollar weakness, gold lacks the conditions for a clean upside expansion at this stage. As a result, price is likely to rotate between support and the first supply reaction zone before the next directional decision.
In summary, gold is currently in a post-selloff consolidation phase. The support zone is holding for now, but the broader structure remains vulnerable. A sustained recovery would require acceptance back above key resistance levels, while failure to build continuation could expose price to another test of support or a deeper retracement. Patience and level-based execution remain critical in this environment.

Bitcoin Is Compressing — Range Control Before the Next ExpansionOn the 1H timeframe, Bitcoin remains locked in a well-defined range structure, capped by a strong resistance zone around $89,800–$90,500 and supported by demand between $86,800–$87,200. Price has repeatedly failed to achieve acceptance above resistance, while sellers also lack follow-through below support. This behavior confirms that the market is not trending, but rotating liquidity within a controlled environment.
From a market structure perspective, the repeated swing highs into resistance followed by sharp pullbacks suggest distribution rather than breakout pressure. Each push toward the upper boundary has been met with aggressive selling, indicating that larger participants are using higher prices to offload positions instead of initiating continuation. Until resistance is decisively reclaimed, upside moves should be treated as range highs, not trend signals.
The area labeled as the accumulation zone in the mid-range reflects prolonged consolidation with overlapping candles and reduced volatility. This is typical of a market waiting for external confirmation. Price acceptance here shows balance between buyers and sellers, but importantly, balance is not direction. A breakout from such zones requires volume expansion and structural follow-through, neither of which is currently present.
On the downside, the support zone around $86,500–$87,000 continues to act as a reliable demand pocket. Each test has produced a reaction, confirming short-term buyer interest. However, below this lies a stronger macro support near $85,200, which represents the level where bullish structure would be meaningfully threatened if broken. A clean loss of this zone would shift the broader bias toward downside continuation.
In summary, Bitcoin is in a classic range-bound environment. The market is compressing energy between clearly defined levels, and directional conviction remains absent. Until price breaks and holds above $90,500 or loses $86,500 with momentum, the optimal approach remains range-based execution and patience. The next impulsive move will come from resolution — not prediction.

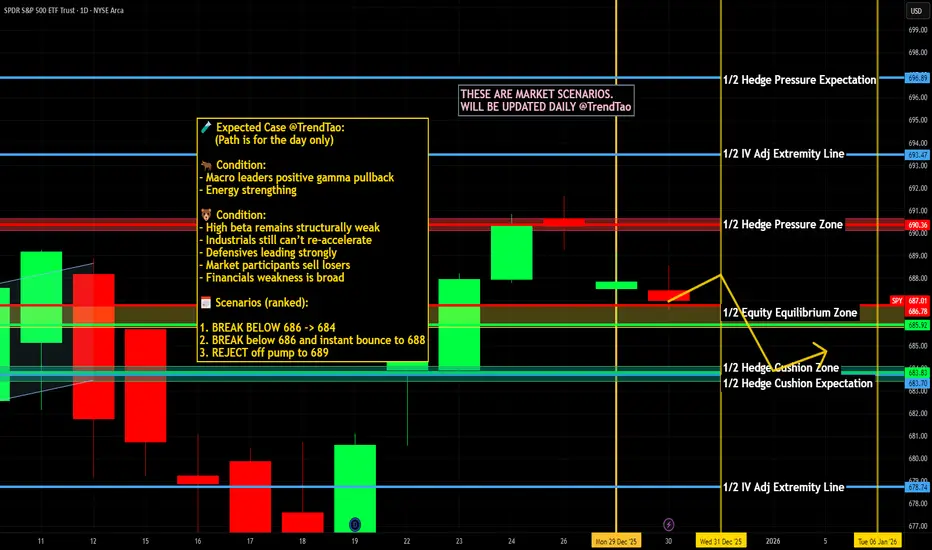
$SPY & $SPX Scenarios — Wednesday, Dec 31, 2025🔮 AMEX:SPY & SP:SPX Scenarios — Wednesday, Dec 31, 2025 🔮
🌍 Market-Moving Headlines
• Thin year-end liquidity: Last full trading day of the year — moves can look exaggerated on light volume.
• Labor data check-in: Jobless claims remain one of the few real-time macro reads as markets close out 2025.
• Positioning over fundamentals: Window dressing, tax considerations, and book-closing flows matter more than narratives today.
📊 Key Data & Events (ET)
8 30 AM
• Initial Jobless Claims (Dec 27): 220,000
⚠️ Disclaimer: For informational use only — not financial advice.
📌 #SPY #SPX #JoblessClaims #YearEnd #Markets #Trading
EUR/USD Pressed Under Descending Resistance — Break or BreakdownOn the 1H timeframe, EUR/USD is trading within a compressed range, capped by a descending resistance trendline and a broader horizontal resistance zone around 1.1800–1.1820. Multiple attempts to push higher have failed, producing lower highs and confirming that sellers remain active on rallies. Price acceptance below this declining structure indicates bearish pressure dominating the short-term order flow.
Structurally, the market has transitioned from a prior impulsive bullish leg into distribution and rotation. The inability to reclaim the descending resistance with momentum suggests that upside moves are corrective rather than impulsive. Each rejection from the trendline has been followed by sharp pullbacks, highlighting a lack of sustained buying interest at higher prices.
On the downside, the support zone around 1.1740–1.1760 is the key area currently preventing further weakness. This zone has absorbed selling pressure multiple times, but reactions have been relatively weak and overlapping, signaling defensive buying rather than accumulation. If price revisits this area with increased bearish momentum, the probability of a clean breakdown increases.
In conclusion, EUR/USD is trapped between descending resistance and a fragile support base. As long as price remains below the downward trendline and the 1.1800 resistance zone, the technical bias favors further downside rotation toward support. A confirmed break below 1.1740 would open the door for deeper continuation, while only a decisive reclaim above the descending resistance would invalidate the current bearish structure.

thereum Is Not Trending — It’s Being NegotiatedCOINBASE:ETHUSD is currently trading inside a well-defined sideways range, with price repeatedly oscillating between a strong resistance zone near 3,050–3,080 and a support zone around 2,900–2,920. The chart clearly shows that neither buyers nor sellers have been able to establish sustained control, resulting in rotational price behavior rather than a directional trend.
From a price action standpoint, the recent impulsive rally into the upper resistance zone was met with immediate and aggressive selling pressure. The sharp rejection from this area confirms that supply remains dominant at higher prices, and the market has not yet accepted value above this resistance. Importantly, the rejection was followed by a fast retracement back into the range, a classic sign of failed continuation rather than a healthy breakout.
Structurally, COINBASE:ETHUSD continues to form overlapping highs and lows, which is characteristic of consolidation. There is no clear sequence of higher highs or lower lows on the 1H timeframe. Instead, price is rotating around the mid-range equilibrium near 2,940–2,960, where liquidity is actively exchanged. This reinforces the idea that the market is in a balance phase, not a trend phase.
The moving averages (EMA 34 and EMA 89) further support this neutral bias. Both averages are flattening and converging, with price frequently crossing above and below them. This behavior typically reflects compression and indecision, not momentum. Until price can hold decisively above the EMAs with expansion, or break below them with follow-through, directional conviction remains weak.
On the macro side, COINBASE:ETHUSD is currently lacking a strong catalyst. BITSTAMP:BTCUSD is consolidating, U.S. yields are relatively stable, and there is no immediate Fed driven volatility pushing risk assets decisively in one direction. As a result, COINBASE:ETHUSD is trading more on technical liquidity levels than on macro narrative, which explains the repeated range-bound reactions.
In summary, COINBASE:ETHUSD remains neutral and range-bound, capped by strong resistance overhead and supported by a well-defended demand zone below. The market is waiting for acceptance outside the range, not reacting to anticipation. Until a clean breakout or breakdown occurs with volume and follow-through, COINBASE:ETHUSD should be approached as a mean-reverting market, where patience and level-based execution matter more than directional bias.

EUR/USD Ends 2025 in a Box — Range Trading Dominates Into 2026EUR/USD on the 1H timeframe is clearly trading inside a well-defined sideways range, capped by a strong resistance zone near 1.1805–1.1820 and supported by a demand area around 1.1755–1.1765. Price has tested both boundaries multiple times without achieving a clean breakout, confirming that the market is currently balanced rather than trending.
From a technical structure perspective, price action is characterized by overlapping highs and lows. Each push toward the resistance zone is followed by rejection, while sell-offs into the support zone consistently attract buyers. This repeated rotation between the two zones highlights a liquidity-driven environment, where neither bulls nor bears have established directional control.
The EMA 34 and EMA 89 are relatively flat and closely aligned, with price oscillating around them. This behavior reinforces the absence of momentum and signals mean-reversion conditions, typical of consolidation phases. In trending markets, price tends to respect one side of key moving averages; here, frequent crossovers indicate indecision and short-term trading dominance.
From a macro standpoint, EUR/USD lacks a strong catalyst to break this range. The Federal Reserve and ECB are both expected to maintain cautious policy stances into early 2026, with rate expectations largely priced in. U.S. dollar strength has stabilized, while Euro-side data has not provided sufficient divergence to drive a sustained directional move. As a result, price continues to respond primarily to technical support and resistance, rather than macro expansion.
In summary, EUR/USD remains range-bound and neutral, trading between clearly defined liquidity zones. Until price achieves a decisive breakout with acceptance and volume above resistance or below support, sideways conditions are likely to persist. In this environment, disciplined execution around key levels is more effective than directional bias, as the market continues to reward patience over prediction.

Gold at a Crossroad: Correction Phase Still in ControlHello Traders,
OANDA:XAUUSD is currently trading in a critical transition zone following a sharp rejection from the all-time high (ATH) near 4,550. The sell-off from this level was impulsive and decisive, indicating strong profit-taking and distribution at premium prices. However, the subsequent price action shows stabilization rather than continuation, suggesting the market has entered a rebalancing phase after extreme volatility.
From a market structure perspective, the breakdown below the former support zone around 4,430–4,450 marked a short-term structural shift. This zone now acts as a key resistance, where prior demand has turned into supply. Price is currently trading below this level, confirming that the market has not yet regained bullish control. At the same time, sellers have failed to extend price significantly lower after the initial breakdown, which limits immediate downside momentum.
The rebound from the 4,300–4,320 support zone is technically significant. This area aligns with a higher-timeframe demand zone where buying interest has previously emerged. The reaction here shows that buyers are still active at discounted prices, but the recovery remains corrective in nature, characterized by overlapping candles and measured upside moves rather than impulsive expansion.
Dynamic indicators support this neutral view. Price remains below the 34 EMA and 89 EMA, both of which are flattening after a prior bullish slope. This behavior typically reflects a loss of directional momentum and the development of a range. A sustained move above these moving averages would be required to shift momentum back to the upside, while rejection below them would reinforce resistance.
From a macro standpoint, gold is currently influenced by mixed drivers. U.S. Treasury yields have stabilized after recent volatility, while the U.S. dollar is holding firm but not accelerating. This macro balance reduces the probability of an immediate directional breakout and instead supports range-bound price behavior, especially as markets approach year-end liquidity conditions.
In conclusion, gold is not confirming a bullish continuation, nor signaling a bearish expansion at this stage. The market is trading between defined support at 4,300–4,320 and resistance at 4,430–4,450, with ATH supply overhead near 4,550. Until price either reclaims resistance with strong acceptance or breaks support with follow-through, gold remains in a neutral, level-driven environment, where discipline, confirmation, and risk management are more important than directional bias.

EUR/USD Is Compressing — The Breakout Direction EUR/USD – 1H MARKET ANALYSIS
Market Context
EUR/USD is currently trading inside a clear range structure, bounded by a defined support zone below and a major resistance zone above. The market is transitioning from a corrective phase into a potential re-accumulation leg.
1. Price Structure
Price recently reacted strongly from the support zone, confirming this area as active demand.
The pullback held above EMA 89, while price is attempting to reclaim EMA 34, suggesting selling pressure is weakening.
The overall structure remains higher low–based, meaning the bullish structure is still valid unless support fails.
2. Moving Average Context
EMA 34 (short-term): Acting as dynamic resistance; a clean reclaim would signal momentum shift.
EMA 89 (mid-term): Continues to act as dynamic support, confirming that the market is not bearish.
Compression between price and EMAs indicates energy building for the next expansion.
3. Key Zones
Support Zone: Strong buyer reaction area; loss of this zone would invalidate the bullish setup.
Resistance Zone: Previous supply area where sellers previously stepped in; this is the main upside objective.
4. Scenarios & Outlook
Primary Scenario – Bullish Continuation (Preferred)
Price holds above the support zone.
Gradual push higher with higher lows.
Upside targets:
First: reclaim mid-range liquidity
Final: test of the resistance zone
Alternative Scenario – Range Extension
Price consolidates between EMA 34 and support.
Sideways movement before expansion.
Invalidation Scenario
Strong H1 close below the support zone.
This would open the door for deeper downside and trend reassessment.
5. Trading Bias
Bias: Mild bullish
Strategy: Buy pullbacks near support, avoid chasing price mid-range
Risk Note: Confirmation is required near resistance — do not anticipate breakouts blindly
Summary
EUR/USD is stabilizing after a pullback, showing signs of renewed demand. As long as price remains above the support zone, the market favors a push toward the resistance area. Discipline and patience remain key in this range-based environment.

Bitcoin Isn’t BREAK — It’s Being Trapped Between Liquidity WallsHi Traders,
BITSTAMP:BTCUSD is currently trading inside a clearly defined consolidation range between $85,000 and $90,000, with price repeatedly rotating between a strong resistance zone overhead and a well-defended support zone below. The chart shows that every attempt to push higher into the upper boundary has been met with aggressive selling, while downside moves stall once price reaches the lower demand area. This behavior confirms that the market is range-bound rather than directional.
From a price action perspective, the recent impulsive move into the $89,500–$90,000 resistance zone failed to gain acceptance. The sharp rejection that followed indicates the presence of strong supply and profit-taking at higher levels. Importantly, this was not followed by continuation selling, but instead by a drift back toward the middle of the range, a typical characteristic of balanced market conditions.
Structurally, BITSTAMP:BTCUSD is printing overlapping highs and lows on the 1H timeframe. There is no consistent sequence of higher highs or lower lows, which means neither buyers nor sellers have control. Price continues to rotate around the mid-range equilibrium near $87,500–$88,000, an area where liquidity is actively exchanged and where short-term traders dominate order flow.
The EMA 34 and EMA 89 are flat and tightly compressed, with price frequently crossing above and below them. This flattening of moving averages reflects momentum exhaustion and indecision, not trend strength. In trending markets, price typically respects one side of key EMAs; here, they act more as mean-reversion magnets.
From a macro standpoint, BITSTAMP:BTCUSD is lacking a strong directional catalyst. U.S. yields remain relatively stable, the USD is not making decisive moves, and there is no immediate Federal Reserve policy shift driving risk appetite. As a result, Bitcoin is responding primarily to technical liquidity zones rather than macro narrative, reinforcing the ongoing consolidation.
In conclusion, BITSTAMP:BTCUSD remains neutral and range-controlled, capped by heavy resistance near $90,000 and supported by demand around $85,000–$86,000. Until the market achieves a clean breakout with acceptance and volume, price is likely to continue oscillating within this range. In this environment, patience and discipline matter more than prediction, and trading decisions should be based on reaction at key levels, not directional bias.

Happy New Year 2026 TRADERSAs we close the chapter on 2025, it’s worth acknowledging what this year truly tested — not just strategies, but discipline, patience, and emotional control. The market offered moments of clarity and long stretches of uncertainty, sharp trends followed by brutal consolidations, and powerful macro moves that rewarded preparation while punishing impulse. Every win came from respecting structure, and every loss carried a lesson for those willing to learn from it.
To all traders who stayed committed to the process managing risk, protecting capital, and waiting for high-probability setups this year has strengthened you more than any single trade ever could. Progress in trading is built quietly, over time, through consistency and self-control.
As we step into 2026, may your decisions be calm, your risk disciplined, and your confidence grounded in experience rather than emotion. May you trade with clarity, adapt quickly, and continue evolving with the market. Wishing every trader health, resilience, and a year ahead filled with focus, growth, and sustainable profitability.
HAPPY NEW YEAR 2026

EURUSD Is Not Breaking Out Yet — It’s Still Balancing Hello everyone,
On the H1 timeframe, the key focus right now is not an immediate bullish breakout, but the fact that EURUSD remains locked inside a clearly defined range, rotating between strong resistance and a well-respected support base.
After multiple attempts into the upper resistance zone around 1.1800–1.1820, price has repeatedly failed to gain acceptance above this area. Each push higher has been met with selling pressure, resulting in sharp rejections and a return back into the range. This behavior confirms that supply remains active overhead and that buyers are not yet strong enough to force a directional expansion.
From a structural perspective, the market is printing overlapping highs and lows, which is a classic sign of balance rather than trend. There is no clean sequence of higher highs to validate an uptrend, and at the same time, sellers have been unable to drive price decisively below support. This tells us that both sides are active, but neither is in control.
The support zone around 1.1750–1.1760 continues to act as a demand area. Every test into this zone has been absorbed, leading to short-term rebounds rather than continuation lower. As long as this support holds, downside risk remains contained, and the market stays in a consolidation phase.
The projected path on the chart reflects this logic well: a possible dip into support to test demand, followed by another rotation higher toward resistance. Only a clean breakout and acceptance above the resistance zone would confirm bullish continuation and open the door for a move toward higher levels. Conversely, a decisive breakdown below support would invalidate the range structure and shift the bias bearish.
Until one of those scenarios plays out, EURUSD is not trending. It is rebalancing and building liquidity inside the range, and patience remains essential.
Wishing you all effective and disciplined trading.

Silver Already Showed The Playbook – Bitcoin Might Be Next!When you compare OANDA:XAGUSD and COINBASE:BTCUSD side by side, the similarity in structure is hard to ignore. Silver spent time consolidating, respected its higher lows, absorbed supply, and then expanded aggressively once the structure was confirmed. Bitcoin now appears to be in a very similar phase.
At the moment, Bitcoin is trading around $88,000. The previous all-time high sits near $126,000. The most recent major November low was formed around $80,700.
Importantly, price has not violated the $74,000 macro support, which remains a key level. This alone keeps the higher-timeframe structure intact and bullish.
What we are seeing right now is not panic or distribution. Pullbacks are corrective, momentum remains controlled, and price continues to hold above key demand zones. This behavior suggests compression and energy build-up, not exhaustion.
Silver already executed this sequence cleanly. Bitcoin has not broken down yet, and structurally, it is still behaving like an asset preparing for continuation rather than reversal.
There is, however, a macro risk that cannot be ignored. Rising geopolitical tensions, especially the risk of escalation between Iran and Israel with potential U.S. involvement, could change market dynamics very quickly. Events like these can override any technical structure.
That said, this analysis is based strictly on current price action and confirmed data, not on hypothetical scenarios. As long as price respects structure, the technical bias remains valid.
From a long-term perspective, if Bitcoin continues to respect its macro supports and resumes expansion, the broader upside zone I am watching lies between $200,000 and $280,000.
This is not a buy or sell signal. This is a structural comparison and a technical roadmap.
The market often looks uncertain right before the next major leg begins.
The real question is simple:
Does Bitcoin follow Silver’s playbook, or does macro risk step in first?
Let me know your view below.


BIDU – Weekly Structure BreakoutContext
- Weekly timeframe
- Long corrective phase since 2021
- Recent transition from downtrend to base and breakout
What I see
- Clean breakout from the long-term descending channel
- Successful retest of the channel and rising support
- Price holding above the 200-week moving average
- Consolidation formed directly on long-term support
- Recent advance from a higher low confirms support acceptance
What matters now
- Holding above the 200-week MA keeps the reversal structure intact
- Continuation requires sustained trade above former resistance
Buy / Accumulation zone
- Pullbacks toward the 200-week MA and former channel resistance acting as support
Targets
- Primary upside reference at the 1.618 Fibonacci extension ($211 area)
- Higher extensions remain possible toward prior cycle projections if trend continues
Risk / Invalidation
- Sustained weekly loss of the 200-week MA would invalidate the support confirmation

EUR/USD Is Not Trending — This Is a Controlled Liquidity RangeMarket Analysis (EUR/USD – H1)
EUR/USD is currently trading inside a well-defined sideways range, with price repeatedly rotating between support around 1.1760–1.1770 and resistance near 1.1804, while the upper extension at 1.1819 remains untouched. The structure is clear: lower highs capped by resistance and consistent demand absorption at support, signaling balance rather than directional conviction.
From a technical perspective , the repeated rejections at 1.1804 confirm the presence of resting sell liquidity, while buyers continue to defend the support zone aggressively, preventing a breakdown. Volume remains relatively stable without expansion, reinforcing that this is range rotation driven by liquidity sweeps, not trend continuation.
Macro-wise, EUR/USD remains sensitive to USD yield stability and expectations around Fed policy normalization. With no fresh catalyst shifting rate differentials, price action reflects indecision and positioning cleanup, not a new macro leg. Until either USD strength accelerates or Euro demand improves via data surprise, this range is likely to persist.
Key takeaway:
As long as price holds above 1.1760, downside remains limited. However, a clean breakout above 1.1804–1.1819 with volume is required to unlock bullish continuation. Until then, EUR/USD remains a mean-reversion environment, favoring patience over prediction.

What the Market Is Actually Doing Right NowBitcoin continues to trade inside a clearly defined horizontal range, and the latest 1H price action reinforces that this market is still in distribution–accumulation rotation rather than trend continuation.
Price is currently reacting just below the $90,000–$90,500 resistance zone, an area that has repeatedly capped upside attempts over the past sessions. Every impulsive move into this zone has been met with immediate rejection, indicating that sell-side liquidity remains heavy and that larger players are using this level to offload positions rather than chase breakout momentum. Importantly, these rejections are occurring without follow-through volume, confirming the absence of strong bullish commitment.
On the downside , Bitcoin continues to respect the $86,500–$86,000 support zone , with a deeper strong support area around $85,200–$85,500 . Each rotation lower into these zones has attracted responsive buying, but notably buyers are not pushing price to new highs, only back toward range highs. This behavior confirms a mean-reversion environment , where price oscillates between liquidity pools instead of forming a directional trend.
Structurally, Bitcoin is printing lower highs within the range, while lows remain defended. This creates internal compression and signals that the market is waiting for a catalyst. Until either side of the range breaks decisively, both bullish and bearish narratives remain incomplete. A clean hourly and daily close above $90,500 would invalidate the range and open the path toward higher continuation targets. Conversely, a break and acceptance below $85,200 would expose downside expansion toward lower demand zones.
From a macro perspective, this consolidation aligns with the broader market context. Risk assets are currently lacking fresh drivers as Federal Reserve rate-cut expectations remain uncertain , and liquidity conditions are stable but not accelerating. Without a strong shift in macro liquidity or a surge in institutional inflows, Bitcoin is behaving exactly as expected rotating, absorbing orders, and building a larger move.
In summary, Bitcoin remains neutral and range-bound , not weak, but not ready for sustained upside yet. Traders should respect the range, remain patient, and avoid chasing moves in the middle. The real opportunity will come only after a confirmed breakout , not before.

Bitcoin Rejects the Ceiling — Liquidity Is Pulling Price BTCUSD (1H) — Market Outlook
Bitcoin is currently rejected from a major resistance zone near 90,000, confirming that sellers remain active at premium prices.
Key Market Structure
The recent impulsive move up failed to hold above resistance, signaling a lack of breakout strength.
Price is still trading inside a broader range, not a confirmed trend.
This rejection suggests bullish momentum is weakening short term.
Probable Scenario
The higher-probability path is a pullback toward the support zone around 86,500–87,000.
This move would allow the market to rebalance liquidity and test real demand.
Only strong buyer reaction at support would justify renewed upside attempts.
Invalidation
A clean H1 close above the resistance zone with follow-through would invalidate the pullback scenario.
Macro Context
Strong USD and elevated bond yields continue to cap risk assets.
With no immediate bullish macro catalyst, Bitcoin rallies into resistance are likely to be sold.
Bottom Line:
Bitcoin remains range-bound. Until resistance is clearly broken and accepted, expect downside probing before any sustainable upside continuation.
