Potential outside week and bullish potential for IMAXEntry conditions:
(i) higher share price for NYSE:IMAX above the level of the potential outside week noted on 7th November (i.e.: above the level of $35.60).
Stop loss for the trade would be:
(i) below the low of the outside week on 3rd November (i.e.: below $31.27), should the trade activate.
Technology

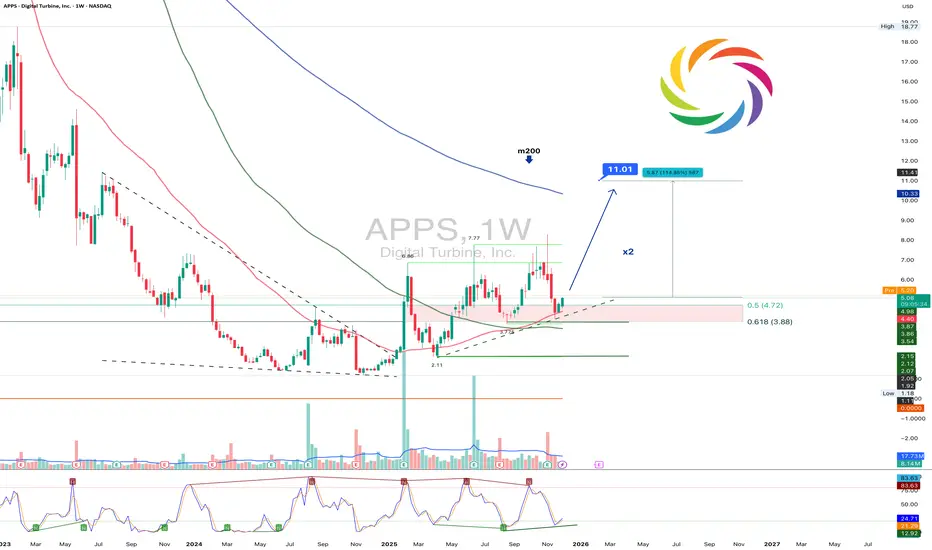
APPS 1W: warms up the stage again or is this only a teaserAPPS is trading at 5.08 and holding above the demand zone between 3.88 and 4.72. These levels correspond with Fibonacci 0.5 and 0.618 and continue to attract buyers. A golden cross between ma50 and ma100 has formed and the ma200 above creates a clean technical structure for a potential breakout. The chart suggests a move toward 7.77 while a confirmed break above it may open the way toward 11.01.
The fundamental picture has strengthened. Revenue grew 18 percent in the latest quarter and adjusted EBITDA increased 78 percent. The business acceleration comes from a sharp rise in ad impressions, wider SDK penetration, stronger non gaming activity and expansion into the Asia-Pacific region. Margin improvement and stronger cash flow support the bullish scenario as the advertising market stabilizes.
As long as price holds above the demand zone between 3.88 and 4.72 the bullish setup remains active. Losing this zone would lead to deeper consolidation yet the combination of technical strength and improving fundamentals favors upside continuation.
Advertising is all about timing and Digital Turbine seems to know exactly when to turn the spotlight on.
Is Europe's Industrial Crown Jewel Being Quietly Dismantled?Volkswagen Group, once the symbol of German engineering dominance and post-war European recovery, is experiencing what can only be described as a structural dismantling rather than a cyclical downturn. The company faces a perfect storm of challenges: geopolitical vulnerability exposed by the Nexperia semiconductor crisis, where China demonstrated escalation of dominance over critical supply chains, catastrophic labor cost disadvantages ($3,307 per vehicle in Germany versus $597 in China), and a complete failure of its CARIAD software division that consumed €12 billion with little to show for it. The result is unprecedented: 35,000 German job cuts by 2030, the first factory closures in 87 years, and Golf production moving to Mexico.
The technological surrender is perhaps most revealing. VW is investing $5.8 billion in American startup Rivian and $700 million in Chinese EV maker XPeng—not as strategic partnerships, but as desperate attempts to acquire the software and platform capabilities it failed to develop internally. The company that once provided technology to Chinese joint ventures now buys entire vehicle platforms from a Chinese startup founded in 2014. Meanwhile, its profit engine has collapsed: Porsche's operating profit plummeted 99% to just €40 million in Q3 2024, while VW's China market share eroded from 17% to under 13%, with only 4% share in the critical EV segment.
This isn't just corporate restructuring—it's a fundamental transfer of power. VW's "In China, For China" strategy, which moves 3,000 engineers to Hefei and creates a separate technological ecosystem under Chinese jurisdiction, effectively places the company's intellectual property and future development under the control of a systemic rival. The patent analysis confirms the shift: while BYD has built a moat of 51,000 patents focused on battery and EV technology, much of VW's portfolio protects legacy internal combustion engines—stranded assets in an electric future. What we're witnessing is not Germany adapting to competition, but Europe losing control of its most important manufacturing sector, with the engineering and innovation increasingly done by Chinese hands, on Chinese soil, under Chinese rules.

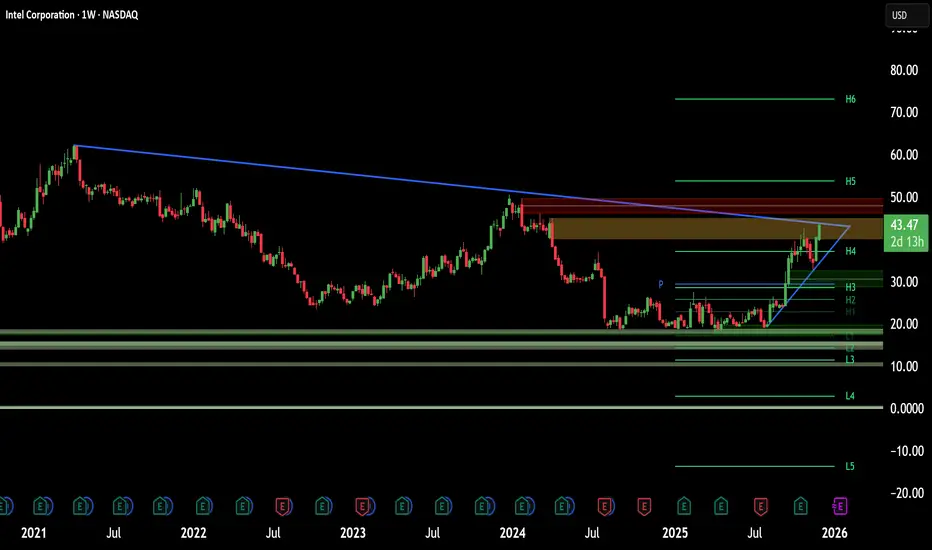
Is Intel’s Apple Deal the Ultimate Pivot?Intel (NASDAQ: INTC) stock soared over 116% this year. Reports suggest Apple may use Intel’s foundry by 2027. We analyze the drivers behind this potential resurrection.
Geopolitics & Geostrategy: The Stability Premium
In a volatile world, Intel offers a "stability premium." TSMC’s concentration in Taiwan risks Western supply chains. The US government now holds a ~10% stake in Intel. This actively incentivizes domestic production to secure the grid. Apple chooses Intel to hedge against geopolitical friction. This move aligns with US strategic interests, treating Intel as a sovereign asset.
Management & Leadership: The Tan Effect
CEO Lip-Bu Tan drives a massive cultural shift. He replaced Pat Gelsinger’s engineering vision with operational discipline. Tan prioritizes customer listening, an area where Intel historically struggled. This pivot is paying off. Securing Apple proves Intel is shedding its "arrogant" legacy. It is becoming a true service-oriented foundry.
Technology & Innovation: The 18A-P Advantage
The deal relies on Intel’s **18A-P process technology**. Apple aims to use this for entry-level M-series chips. This validates Intel's aggressive manufacturing roadmap. Additionally, the Trump administration invested $150 million in xLight. This startup develops next-gen lithography lasers to aid chipmaking. It reinforces the ecosystem surrounding Intel’s manufacturing capabilities.
Business Models: The Foundry Pivot
Intel is transforming from a product company to a hybrid foundry. Analysts estimate the Apple deal could generate ~$1 billion annually. However, the "Apple Seal of Approval" is worth far more. It signals to giants like Qualcomm that Intel is ready. It also creates leverage against TSMC’s pricing power.
Final Verdict: The Apple rumors convert Intel into a legitimate turnaround play. US geopolitical interests align with the new leadership. Validated technology suggests Intel’s worst days are likely over.
folks (FOLKS)This kraken listed cryptocurrency is performing well since being added to tradable tokens.
Folks is built on Algorand for DeFi.

NVIDIA Trading plan from $100 to $1000. Is it plausible?Exactly a month ago, we called the end of the rally on NVIDIA Corporation (NVDA), essentially the end of its multi-year Bull Cycle and the beginning of an aggressive Bear Cycle correction.
** The 10 year Channel Up **
So far this is paying dividends as the stock just completed a 4-week red streak. The essence of NVIDIA's trend has been a decade long Channel Up, as you can see on this chart and that's the basis of all the buy entries and sell exits we've made over the years.
** Bull and Bear Cycles **
Since early 2025, the stock started that Channel Up, whose first Bull Cycle (as well as the next ones with the exception of one breaking) was supported by the 1W MA50 (blue trend-line). Once that Bear Cycle (in the form of the Channel's Bullish Leg) ended, the subsequent Bear Cycle (Bearish Leg) broke below both the 1W MA50 and 1W MA100 (green trend-line) and bottomed exactly on its 1W MA200 (orange trend-line), marginally above the 0.382 Fibonacci retracement level.
The following Bull Cycle as well as the Bear Cycle followed the same structure only, the bottom was this time marginally below the 0.382 Fib. Then the Bull Cycle that just ended started, with only basic difference that its early 2025 correction broke below the 1W MA50 but found Support on the 1W MA100. Every Bull Cycle had such pre-Top correction (blue ellipse). Note also that this last Bull Cycle as been the strongest Leg on +1881% rise and the one before it, the 'weakest' at +1004%.
** The RSI **
Notice also that the 1W RSI has made the same Double Top rejection pattern on the Lower Highs Zone that both previous Bull Cycle Tops did. Strong confirmation therefore of the emerging Bear Cycle.
** The next bottom **
Technically, we expect the market to bottom yet again on the 1W MA200, which by a fair projection of its current trajectory, we expect that to be around $100. That would still be considerably above the 0.382 Fib, which can only get hit if the Bear Cycle falls very aggressively. Note here that historically within this Channel Up, the most optimal buy signal was given when the 1W RSI hit 42.00. Use that in combination with the 1W MA200.
** Future Targets **
So after the Bear Cycle bottoms, what Target can we pursue? Well the 'minimum' projection based on the 2.618 Fibonacci extension of the Bull Cycle that just ended is $700. At the same time, if it rises by again the 'minimum' % of the weakest +1004% Bullish Leg of the Channel, we are looking potentially at a 4-year Target of $1100. It is also worth noting the valuable use of the Sine Waves that have so far accurately grasped the peak formations of the Bull Cycles. We can use this to time our market exits in 2029.
Realistic or not subjectively, the $100 to $1000 path is what the pure technicals and historical data support and clearly show is a very likely probability for a long-term investment.
---
** Please LIKE 👍, FOLLOW ✅, SHARE 🙌 and COMMENT ✍ if you enjoy this idea! Also share your ideas and charts in the comments section below! This is best way to keep it relevant, support us, keep the content here free and allow the idea to reach as many people as possible. **
---
💸💸💸💸💸💸
👇 👇 👇 👇 👇 👇

Palantir reversal underway.Here is the #PLTR chart compared to Silver.
We can observe a softness in this ratio.
This has formed a minor head and shoulders pattern, initiating a downward trend.
In the end, I truly believe that the significant inverse head and shoulders breakout is probably going to be tested.
Michael Burry's puts might very well yield substantial returns as a lot of the AI trade experiences a retracement or backing and filling following some massive upward movements.

AUD/USD – Bullish Reversal from Demand Zone | 2H Chart Analysis Busy: 🔹 AUD/USD – Bullish Reversal from Demand Zone | 2H Chart Analysis 🔹
Price has respected a key demand zone with support from the Ichimoku cloud.
Bullish price action suggests a potential breakout & retest setup targeting 0.6580 and 0.6615.
- Entry Zone: 0.6530 – 0.6540
- Stop Loss: 0.6490
- TP1: 0.6580
- TP2: 0.6615
- Risk:Reward: 1:2 or better
📊 If the price confirms breakout above 0.6550 with a retest, this setup can play out cleanly.
#AUDUSD #Ichimoku #ForexAnalysis #TradingView #BreakoutSetup
Busy: AUD/USD – Bullish Reversal from Demand Zone | 2H Chart Analysis

BROADCOM 6-year Channel Up in need of a correction.Broadcom Inc. (AVGO) has been trading within a 6-year Channel Up since the start of the COVID crash with the price is currently on its top (Higher Highs trend-line).
Our point of interest currently is the 1W RSI Bearish Divergence, being on Lower Highs since September against the price's Higher Highs. This kind of Bearish Divergence that high inside such a long-term pattern is an indication of a potential trend reversal.
The last correction (January - March 2025) pulled back all the way to the 1W MA100 (green trend-line) and the one before (January - October 2022) to the 1W MA200 (orange trend-line). The former was more aggressive (-44.72% against -38.65%) and faster. Both reached the bottom of the Channel Up.
As a result, even a -38.65% correction from the current levels would come very close to the bottom of the pattern by Q3 2026, approaching also the 1W MA200, which fulfils most prior pull-back conditions of the Channel Up.
Given this data, our long-term Target on Broadcom from now on is $240. The most optimal buy signal for our next long-term buy will be when the 1W RSI hits its 6-year Support Zone, which happened both on the March 2025 and October 2022 bottoms.
---
** Please LIKE 👍, FOLLOW ✅, SHARE 🙌 and COMMENT ✍ if you enjoy this idea! Also share your ideas and charts in the comments section below! This is best way to keep it relevant, support us, keep the content here free and allow the idea to reach as many people as possible. **
---
💸💸💸💸💸💸
👇 👇 👇 👇 👇 👇

META entering Bear Cycle territory.Meta Platforms (META) has been on a steady decline since its August All Time High (ATH) that is lately accelerating. The reason the breaking below its 1W MA50 (blue trend-line) last week for the first time since April 2025. That was the time that the market formed the bottom of the Tariff War Crisis.
The key characteristic here (and most worrisome) is the Huge Bearish Divergence of the 1W RSI (Lower Highs) against the price's Higher Highs since February 2024. This indicates a loss of strength for the bullish trend and potential reversal.
The same kind of RSI Bearish Divergence was seen in 2017 - 2018, leading to the eventual July 2018 market Top and strong multi-month correction to the 0.236 Fibonacci retracement level that found Support exactly on the 1W MA250 (red trend-line).
Just like then, the stock price has reached now the top of its historic Channel Up, the pattern that has been trading within since its IPO and only broke once marginally at the bottom of the 2022 Inflation Crisis.
As a result, given the strong similarities between the two fractals, META may be entering a Bear Cycle (since the 1W MA50 break) that could last for about a year. Our 0.236 Fibonacci Target is $480.
---
** Please LIKE 👍, FOLLOW ✅, SHARE 🙌 and COMMENT ✍ if you enjoy this idea! Also share your ideas and charts in the comments section below! This is best way to keep it relevant, support us, keep the content here free and allow the idea to reach as many people as possible. **
---
💸💸💸💸💸💸
👇 👇 👇 👇 👇 👇

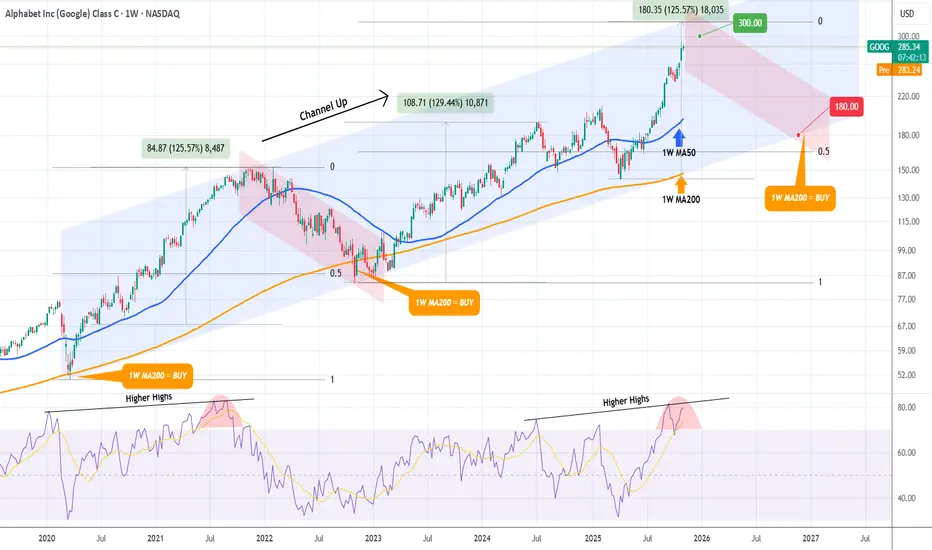
GOOGLE Bull Cycle running out of steam. Be ready to sell.It's been exactly 2 months (September 05, see chart below) when we last had a look at Google (GOOG) giving a strong break-out Buy Signal that methodically hit our $275 Target:
This time we look at the stock from a much longer term perspective on the 1W time-frame, where it is approaching the top (Higher Highs trend-line) of the Channel Up that started on the COVID crash (March 2020).
This is a major Sell Alert as the 1W RSI is also printing a Double Top formation similar to the November 15 2021 Top. Given that +125% rallies have been the most common long-term sequences of this pattern, we believe that any price above $300 is a major Sell for Google.
The strongest long-term Support and Target of correction sequences/ Bearish Legs has been the 1W MA200 (orange trend-line) and this is our Target for 2026. We estimate that a potential contact with the 1W MA200 can be made at around $180 (also marginally above the 0.5 Fibonacci level from the bottom of the previous correction). A contact with the 1W MA200 will be our next long-term Buy on Google.
-------------------------------------------------------------------------------
** Please LIKE 👍, FOLLOW ✅, SHARE 🙌 and COMMENT ✍ if you enjoy this idea! Also share your ideas and charts in the comments section below! This is best way to keep it relevant, support us, keep the content here free and allow the idea to reach as many people as possible. **
-------------------------------------------------------------------------------
💸💸💸💸💸💸
👇 👇 👇 👇 👇 👇
AMAZON flashing a massive 5-year Sell Signal.More than 5 months ago (May 28, see chart below), we gave a strong buy signal on Amazon Inc. (AMZN), which last Friday hit our $255 Target:
This time we come across a massive Sell Signal on the 1W time-frame as the price hit (and is so far being rejected on) the 5-year Higher Highs trend-line that started back on the August 31 2020 Top.
We can see that during that period of time, Amazon had started a Triple Top formation that eventually led to the final rejection and the start of the 2022 Bear Cycle. Until we can talk about such a correction, we can expect at least a pull-back to its 1W MA50 (blue trend-line) as all of those 2020/21 rejections did. As a result, our medium-term Target on Amazon is $220.
Notice also the similarities between the 1W RSI sequences between the two fractals (2020/21 and 2024/25), both forming Lower Highs patterns.
-------------------------------------------------------------------------------
** Please LIKE 👍, FOLLOW ✅, SHARE 🙌 and COMMENT ✍ if you enjoy this idea! Also share your ideas and charts in the comments section below! This is best way to keep it relevant, support us, keep the content here free and allow the idea to reach as many people as possible. **
-------------------------------------------------------------------------------
💸💸💸💸💸💸
👇 👇 👇 👇 👇 👇

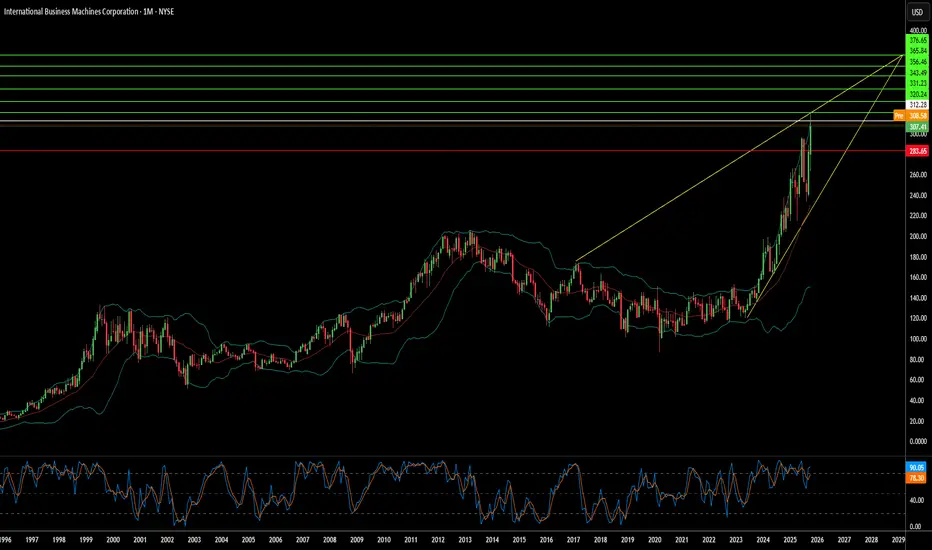
Is IBM Building an Unbreakable Cryptographic Empire?IBM has positioned itself at the strategic intersection of quantum computing and national security, leveraging its dominance in post-quantum cryptography to create a compelling investment thesis. The company led the development of two of the three NIST-standardized post-quantum cryptographic algorithms (ML-KEM and ML-DSA), effectively becoming the architect of global quantum-resistant security. With government mandates like NSM-10 requiring federal systems to migrate by the early 2030s, and the looming threat of "harvest now, decrypt later" attacks, IBM has transformed geopolitical urgency into a guaranteed, high-margin revenue stream. The company's quantum division has already generated nearly $1 billion in cumulative revenue since 2017—more than tenfold that of specialized quantum startups—demonstrating that quantum is a profitable business segment today, not merely an R&D cost center.
IBM's intellectual property moat further reinforces its competitive advantage. The company holds over 2,500 quantum-related patents globally, substantially outpacing Google's approximately 1,500, and secured 191 quantum patents in 2024 alone. This IP dominance ensures future licensing revenue as competitors inevitably require access to foundational quantum technologies. On the hardware front, IBM maintains an aggressive roadmap with clear milestones: the 1,121-qubit Condor processor demonstrated manufacturing scale in 2023, while researchers recently achieved a breakthrough by entangling 120 qubits in a stable "cat state." The company targets deployment of Starling, a fault-tolerant system capable of running 100 million quantum gates on 200 logical qubits, by 2029.
Financial performance validates IBM's strategic pivot. Q3 2025 results showed revenue of $16.33 billion (up 7% year-over-year) with EPS of $2.65, beating forecasts, while adjusted EBITDA margins expanded by 290 basis points. The company generated a record $7.2 billion in year-to-date free cash flow, confirming its successful transition toward high-margin software and consulting services. The strategic partnership with AMD to develop quantum-centric supercomputing architectures further positions IBM to deliver integrated solutions at exascale for government and defense clients. Analysts project IBM's forward P/E ratio may converge with peers like Nvidia and Microsoft by 2026, implying potential share price appreciation to $338-$362, representing a unique dual thesis of proven profitability today combined with validated high-growth quantum optionality tomorrow.
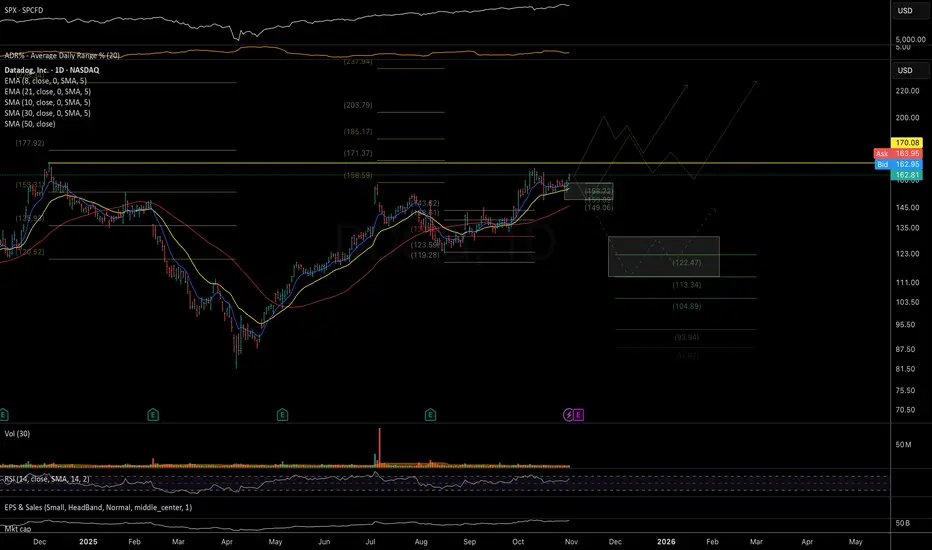
DDOG: interesting macro potential Interesting large multi-year VCP formation. Earnings are on Nov 6. While there’s still a chance that the correction from the June highs isn’t fully complete and that price is currently in a higher-degree bounce (running flat correction), I’ll be on the lookout for a potential (gap-up) earnings breakout.
If such a move occurs—especially if supported by a strong and positive catalyst—I’ll be watching for a delayed-reaction setup for a possible entry.
Chart:
Macro view:
Bullish potential detected for QOREntry conditions:
(i) breach of the upper confines of the Darvas box formation for ASX:QOR
- i.e.: above high of $0.705 of 14th August (most conservative entry), and
(ii) swing up of indicators such as DMI/RSI.
Stop loss for the trade (based upon the Darvas box formation) would be:
(i) below the support level from the low of 5th September (i.e.: below $0.565).

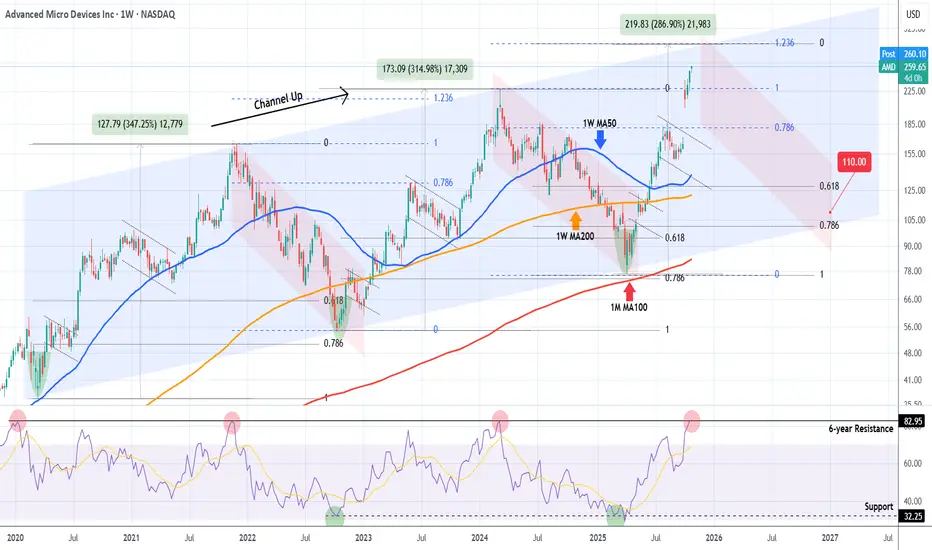
AMD Is it approaching a multi-year top and turning into a Sell ?Almost 8 months ago (March 07, see chart below) we made a bold call (for the time) on Advanced Micro Devices (AMD), expecting it to bottom on its 1M MA100 (red trend-line) and then rebound, targeting $320:
Well the Bullish Leg of its 6-year Channel Up had been even more aggressive than we expected and is already approaching its top (Higher Highs trend-line), much earlier than we expected.
This is technically the right time to book the amazing +240% profits from the April 07 bottom, as the 1W RSI just hit its 6-year Resistance, which has marked the Channel's two Tops.
Even though the Bullish Leg can technically extend as high as +287% on the 1.236 Fibonacci extension (like the previous did), the focus of a long-term investor should now be to buy (much) lower, preferably as close to the 1M MA100 as possible.
The last two Higher Lows of the Channel Up have been priced just above the 0.786 Fibonacci retracement level, so our fair long-term Target is currently at $110.00.
So do you also think AMD is approaching the end of the (long-term) road and is gradually turning into a Sell?
-------------------------------------------------------------------------------
** Please LIKE 👍, FOLLOW ✅, SHARE 🙌 and COMMENT ✍ if you enjoy this idea! Also share your ideas and charts in the comments section below! This is best way to keep it relevant, support us, keep the content here free and allow the idea to reach as many people as possible. **
-------------------------------------------------------------------------------
💸💸💸💸💸💸
👇 👇 👇 👇 👇 👇
PALANTIR sitting on a Buy Zone. Target $220.Palantir (PLTR) has been trading within a Channel Up since early May and is currently consolidating on its bottom (Higher Lows trend-line). while holding he 1D MA50 (red trend-line). The 4H MA50 (blue trend-line) - 1D MA50 range has been technically the most optimal buy zone of this pattern.
With the 4H RSI exhibiting a Bull Flag similar to May - June, we expect the stock to aim for at least its 2.618 Fibonacci extension at $220.00. If broken, it may extend for an end-of-year rally to $255.00 completing a +80% Bullish Leg similar to the Channel's first.
-------------------------------------------------------------------------------
** Please LIKE 👍, FOLLOW ✅, SHARE 🙌 and COMMENT ✍ if you enjoy this idea! Also share your ideas and charts in the comments section below! This is best way to keep it relevant, support us, keep the content here free and allow the idea to reach as many people as possible. **
-------------------------------------------------------------------------------
💸💸💸💸💸💸
👇 👇 👇 👇 👇 👇

Tech & Rates: The Unstoppable Force Driving USD/JPY SkywardThe USD/JPY exchange rate has exhibited a clear upward trend, recently touching a one-week high before a slight pull-back to around 151.74. This sustained yen weakness reflects a convergence of factors across global finance, domestic Japanese policy, and international relations. Traders must analyze these multi-faceted pressures to accurately forecast future movements.
Domestic Japanese Fiscal Expansion
Japan's new Prime Minister, Sanae Takaichi, is preparing an aggressive economic stimulus package likely exceeding last year's $13.9$ trillion yen ($92.19$ billion). This expansionary fiscal policy aims to counter rising inflation and support household incomes. Markets anticipated this policy shift, contributing to the yen's $2.6\%$ decline this month, its biggest monthly drop since July. A combination of significant fiscal spending and a challenging relationship with the central bank typically weighs heavily on a currency.
Geopolitical Instability and Safe Havens
Global political risk typically favors the U.S. dollar, cementing its position as the world's primary reserve currency. The ongoing $\mathbf{U.S.}$ $\mathbf{government}$ $\mathbf{shutdown}$, now into its third week, injects domestic uncertainty. This standoff complicates the Fed’s data-driven decision-making, potentially reinforcing expectations for rate cuts, which can weaken the dollar. Despite this, the dollar index (DXY) remains resilient at $98.84$. A brief drop in gold prices recently triggered market volatility and a rebalancing of safe-haven assets, briefly allowing the yen to climb. Yet, the persistent US political gridlock maintains a background risk premium that supports the dollar as the ultimate haven.
Geostrategy and Technology Competition
Geostrategic competition, especially involving China, supports the USD through capital flow redirection. Diversification and resilience strategies in global supply chains lead to investment shifts toward Southeast Asia and other strategic areas, often bypassing the yen. Furthermore, the dollar benefits from the High-Tech sector's dominance. High-tech and cyber security, and the associated intellectual property (IP), including patent families, are key drivers of economic growth. A country's strength in technology, quantified by international patents, significantly impacts its currency's global competitiveness and valuation, often bolstering the dollar’s perceived "soft power" relative to the yen. (www.worldscientific.com)
Conclusion and Outlook
The primary drivers of the USD/JPY's ascent are the widening interest rate differential and Japan’s expansionary fiscal outlook. While a short-term correction occurred due to safe-haven rebalancing, the structural forces remain dollar-positive. The US government shutdown presents a risk, but its historical impact on the dollar has typically been modest and short-lived. Traders should expect USD/JPY to test new highs, especially if the new Japanese fiscal policy exacerbates bond market concerns.

TESLA New Bullish Leg to $600 has started.Last time we took a look at Tesla (TSLA) more than a month ago (September 11, see chart below), we gave a massive buy signal that worked out instantly, as we saw the resemblances between the recent Triangle accumulation pattern and that of late 2024, setting a $600 long-term Target:
This time we take a better look at the Channel Up that has emerged. Technically it looks like a Bearish Leg (red Channel Down) has ended and with the 1D MA50 (blue trend-line) holding, a new Bullish Leg has been initiated.
The previous Bullish Leg, which by the way started after a 1D MA100 (green trend-line) hold, rose by +59.26%. This puts the next Higher High technically above our $600 long-term Target.
Notice also how the 1D MACD is about to form a new Bullish Cross, with all previous ones being a strong Buy Signal. At the same time, the 1D RSI found support and bounced on its 5-month Higher Lows trend-line.
-------------------------------------------------------------------------------
** Please LIKE 👍, FOLLOW ✅, SHARE 🙌 and COMMENT ✍ if you enjoy this idea! Also share your ideas and charts in the comments section below! This is best way to keep it relevant, support us, keep the content here free and allow the idea to reach as many people as possible. **
-------------------------------------------------------------------------------
💸💸💸💸💸💸
👇 👇 👇 👇 👇 👇

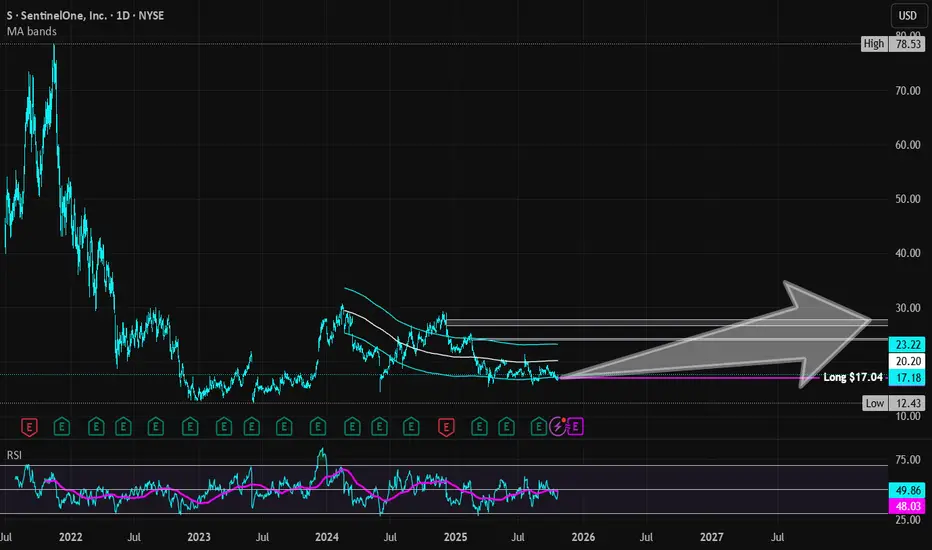
SentinelOne | S | Long at $17.04SentinelOne NYSE:S : a cybersecurity company that uses an autonomous AI-powered platform to performs real-time threat detection, prevention, and remediation across endpoints, cloud, and IoT.
Technical Analysis
Price is consolidating along my historical simple moving average (a regression to the mean). This is after a meteoric rise in 2021 to $78.53 (just after the IPO) and then collapse to $12.43 in 2023. While near-term ups and downs may persist for a bit, usually a price consolidation near the historical simple moving average eventually leads to a major move. The simple moving average band is getting tighter, signaling the potential for a move out of the zone "soon". Given the grow, niche, and need, the future may be bright with this one.
Growth
www.tradingview.com
820% growth expected in earnings per share between 2024 ($0.05) to 2027 ($0.46)
75% revenue growth projected between 2024 ($821 million) to 2027 ($1.4 billion)
Health
Debt-to-equity: 0 (perfection)
Altman's Z Score \ Bankruptcy Risk: 3.3 (extremely low risk)
Quick Ratio: 1.7 (they are able to pay current bills without relying on debt)
Insiders
Warning: Lots of selling and no buying...
openinsider.com
Action
SentinelOne NYSE:S is an extremely healthy company with very high-growth potential. However, the cybersecurity landscape is highly competitive, but NYSE:S is forming a niche with AI-powered tools. While insider selling is a red flag, that is all I can see here besides competition (or the company secretly falling apart behind the scenes). That's the risk we all take as investors. Thus, at $17.04, NYSE:S is in a personal buy zone.
Targets into 2028
$24.00 (+40.8%)
$27.50 (+61.4%)
Can Memory Chips Become Geopolitical Weapons?Micron Technology has executed a strategic transformation from commodity memory producer to critical infrastructure provider, positioning itself at the intersection of AI computing demands and U.S. national security interests. The company's fiscal 2025 performance demonstrates this pivot's success, with data center revenue surging 137% year-over-year to comprise 56% of total sales. Gross margins expanded to 45.7% as the company captured pricing power across both its advanced High-Bandwidth Memory (HBM) portfolio and traditional DRAM products. This dual-margin expansion stems from an unusual market dynamic: capacity reallocation toward specialized AI chips has created artificial supply constraints in legacy memory, driving price increases exceeding 30% in some segments. In contrast, HBM3E capacity through 2026 is already sold out.
Micron's technological leadership centers on power efficiency and manufacturing innovation that translate directly into customer economics. The company's HBM3E solutions deliver bandwidth exceeding 1.2 TB/s while consuming 30% less power than competing 8-high configurations—a critical advantage for hyperscale operators managing electricity costs across massive data center footprints. This efficiency edge is reinforced by scientific advances in manufacturing, particularly the mass production deployment of 1γ DRAM using Extreme Ultraviolet lithography. This node transition delivers over 30% more bits per wafer than previous generations while reducing power consumption by 20%, creating structural cost advantages that competitors must match through heavy R&D investment.
The company's unique position as America's sole HBM manufacturer has transformed it from a component supplier to a strategic national asset. Micron's $200 billion U.S. expansion plan, supported by $6.1 billion in CHIPS Act funding, aims to produce 40% of its DRAM capacity domestically within a decade. This geostrategic positioning grants preferential access to U.S. hyperscalers and government projects requiring secure, domestically sourced components, a competitive moat independent of immediate technological specifications. Combined with a robust intellectual property portfolio covering 3D memory stacking and secure boot architectures, Micron has established multiple defensive layers that transcend typical semiconductor industry cycles, validating an investment thesis for sustained high-margin growth through structural rather than cyclical drivers.

NVIDIA Next stop.. $200For a long time we've been calling for a $200 Target on NVIDIA Corporation (NVDA). That was our main Target for the Bull Cycle that started in November 2022. The stock is very close to this level and the short-term pattern that can get to it is this Channel Up.
Supported by the 1H MA100 (green trend-line), NVIDIA has been posting Bullish Legs of around +10% since the September 05 Low. The confirmation signal for those Legs has been a 1H MACD Bullish Cross.
Given that we formed one yesterday, we expect the price to be on such a Bullish Leg already. The 'weakest' of those sequences has been +9.58%, which if repeated, lands marginally above the $200 psychological level.
Time to hit it?
-------------------------------------------------------------------------------
** Please LIKE 👍, FOLLOW ✅, SHARE 🙌 and COMMENT ✍ if you enjoy this idea! Also share your ideas and charts in the comments section below! This is best way to keep it relevant, support us, keep the content here free and allow the idea to reach as many people as possible. **
-------------------------------------------------------------------------------
💸💸💸💸💸💸
👇 👇 👇 👇 👇 👇

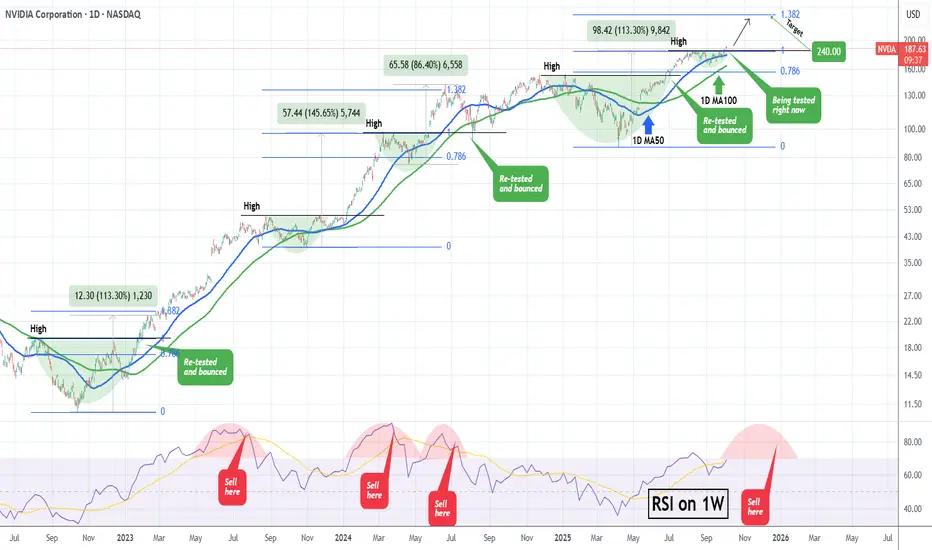
NVIDIA What happens when it retests a Resistance after a break?NVIDIA Corporation (NVDA) has been on a strong rise since the mid-term September 05 Low and this week finally broke above its previous $184 High. During the current Bull Cycle (since the October 2022 bottom), every time the price broke above a previous High and re-tested it as a Support, it started a secondary rally to new Highs.
Technically, as long as the 1D MA100 (green trend-line) holds, we should see at least a 1.382 Fibonacci extension test, similar to the February 2023 and June 2024 Highs. As a result, once the current former High / Resistance level finishes getting re-tested, we expect an end-of-the-year rally to $240.
Additionally, we will keep an eye on the 1W RSI. Typically, once it gets massively overbought above 85.00 and then starts to decline within an Arc peak formation, the time to Sell is after the middle of that Arc.
-------------------------------------------------------------------------------
** Please LIKE 👍, FOLLOW ✅, SHARE 🙌 and COMMENT ✍ if you enjoy this idea! Also share your ideas and charts in the comments section below! This is best way to keep it relevant, support us, keep the content here free and allow the idea to reach as many people as possible. **
-------------------------------------------------------------------------------
💸💸💸💸💸💸
👇 👇 👇 👇 👇 👇