RGTI: The Bullish Dragon Awakens for 2026
The Bull Case:
Technical Setup: The Dragon Pattern We are witnessing a textbook Bullish Dragon formation on the Rigetti chart, signaling a major trend reversal.
The Head: Formed at the previous swing high before the initial decline.
The Feet: We have two distinct lows—the "Left Foot" followed by a higher "Right Foot." This higher low indicates that selling pressure is exhausted and buyers are stepping in earlier than before.
The Hump: The mid-pattern peak that provides our primary resistance level.
The Trigger (Tail): A breakout above the trendline connecting the "Head" and the "Hump" confirms the pattern. With the stock recently showing resilience around the $23.60–$25.00 level, a move above the hump will confirm the "Tail" extension toward targets at $35.00 and $50.00.
Fundamental Bull Case:
2026 Technology Roadmap: Rigetti is on track to deploy its 150+ qubit system by late 2026, targeting a 99.7% median two-qubit gate fidelity. This is a critical step toward their 1,000+ qubit goal in 2027.
Strong Liquidity: As of late 2025, Rigetti fortified its balance sheet with roughly $600 million in cash and equivalents, providing a substantial runway for R&D without the immediate need for dilutive financing.
Strategic Partnerships: Recent support for NVIDIA’s NVQLink platform positions Rigetti at the intersection of AI supercomputing and quantum processing, a high-growth hybrid niche for 2026.
Commercial Momentum: The company secured $5.7 million in purchase orders for its Novera systems in late 2025, with deliveries scheduled for the first half of 2026, marking a shift from pure research to commercial hardware sales.
The Verdict: The confluence of a confirmed "Dragon" reversal pattern and a well-funded 2026 roadmap makes RGTI a high-conviction play for the next phase of the quantum revolution.
Techstocks

IonQ (NASDAQ: IONQ) – Strong Reversal Structure Forming Within WIonQ is showing strong signs of recovery, holding firmly within the Fib golden zone and an overlapping weekly FVG that aligns with an OTE retracement, which previously broke market structure to the upside.
This confluence zone has proven to be a solid base of support, and as long as price continues to respect this level, the bias remains bullish.
From a swing perspective, our primary target zone sits around $136, completing a full bullish swing structure. Notably, recent fundamental analysis supports this outlook — with sources such as Yahoo Finance projecting long-term growth potential and even forecasting possible $1,000 price targets in extended market cycles.
Technical View:
- Weekly structure: bullish BOS confirmed
- Price holding key FVG/OTE confluence
- Next major liquidity targets: $84 → $136
Disclaimer: This breakdown is for educational purposes only and does not constitute financial advice. Always DYOR (Do Your Own Research) before making investment or trading decisions.

MICRON scripted blue-print. More than -50% sell-off expected.Micron Technology (MU) is on an amazing long-term rally since the April 2025 Low, currently on the 6th straight green month (1M candle) and 8th in the last 9 months. Its historic price action however shows that this remarkable uptrend may be coming to an end as the price is approaching the top of its 17-year Channel Up (started after the 2008 U.S. Housing Crisis).
Technically, this post April 2025 rally, is the Bullish Leg of this Channel Up and it already broke above the 0.786 Channel Fibonacci, a level that has only broken 3 times in total, with the last being in June 2018.
At the same time, it is close to completing a +601.35% rise, which despite being unusually high, Micron has done such rally 3 times in the past. The remarkable feat is that all those rallies where exactly +601.35%!
Last but not least, the 1M RSI is massively overbought and is approaching Resistance 2 (89.00), which was last seen on the June 2014 High.
All those factors collectively, force a huge bearish dynamic long-term. At best, we may see this rally exhaust near $440 on the short-term, thus fulfilling the +601.35% Bullish Leg blue-print but on the long-term the value of selling give much higher return.
And as far as a potential Target for this upcoming Bear Cycle is concerned, the 0.236 Channel Fibonacci level is the strongest candidate as virtually all major corrections since 2011 have hit that trend-line before the market bottomed. As this chart shows, the 0.236 Fib level has been touched 6 times since 2011, with the market hitting at least its 1M MA50 (blue trend-line) in the process on a minimum -50% decline. The 1M MA100 (green trend-line) has been its true long-term Support since July 2016.
As a result, it is highly probable that Micron drops below the 1M MA50 and hits the 0.236 Fib at around $140 before the market bottoms and turns into a long-term Buy again. At the same time, it is useful to keep an eye on the 1M RSI and Support Zone 1. This has given the last 3 major Buy Signals since December 2018. As a result, if the stock hits that level before reaching $140, we will turn into long-term buyers regardless of the price.
---
** Please LIKE 👍, FOLLOW ✅, SHARE 🙌 and COMMENT ✍ if you enjoy this idea! Also share your ideas and charts in the comments section below! This is best way to keep it relevant, support us, keep the content here free and allow the idea to reach as many people as possible. **
---
💸💸💸💸💸💸
👇 👇 👇 👇 👇 👇

TTD: might be starting a new uptrend Watching for the start of a new swing uptrend, with scope to at least re-test the Aug/Oct highs and potentially begin a new macro uptrend that could take price above ATHs in the coming years.
Chart:
Monthly view:
Possible risk levels for at least 3-5 days swing trade long:
1. LOD: bellow 37.85
2. Bellow 36.79.

ADBE, Second BEAR-Fractal, SHORT-Momentum DOOMSDAY Incoming!Hello There!
Welcome to my new analysis of ADBE. This stock has been massively battered by the major bear market decline setup in the gigantic bear channel. This stock did not exceed any new highs and did not have the potential to emerge with new bull momentum. The bears are still present within this stock and this is exactly why the bear momentum for this stock can accelerate heavily any time soon. There are several major bearish indications that are underlining the bearish scenario for the stock in an overwhelmingly precarious way.
Three reasons why the bear doomsday scenario for the stock is present, starting any time soon:
1.) Massive Liquidations: Over 250 Billion positions have been liquidated within the previous bearish doomsday market decline wave towards the downside.
2.) Weak Momentum: The momentum with which the recent meager recovery wave setup is highly fragile and is likely to turn anytime soon.
3.) Major Short-Side Positioning: A vast amount of institutional and smart money operators are positioning their selves on the short side. Always an important indication especially with retail traders positioned in the other direction.
Why shorting the stock through the upcoming second bear doomsday scenario will be the best approach in the current and upcoming market conditions:
1.) Second bearish ascending wedge fractal: The stock is going to complete exactly the same bearish ascending wedge fractal towards the downside once again.
2.) Total-Return Approach: By shorting the stock a trader has the candidature to a total-return approach, the trader is profiting when prices fall and at other times when they go up.
3.) Liquidation Acceleration: Once the whole ascending fractal has been completed it will trigger a fast-paced bearish wave making profits much faster than in an uptrend.
The most prevalent determining indications that are going to activate the upcoming bear market scenario wave for the stock:
As it is seen in my chart ADBE completed the huge bearish ascending triangle fractal exactly by moving into the upper distribution zone from where it emerged with the pullback towards the downside and set up the massive 250 Billion bearish liquidation wave towards the downside. This wave developed very fast and by positioning oneself before this huge bearish wave and completion of the fractal towards the downside a trader could make a big load of profit in the market.
Now, ADBE is still trading within the gigantic descending channel formation in which it has the most prevalent upper resistance distribution channel which has been the origin of the massive bearish waves towards the downside before and is now already setting up the upcoming 300 Billion bearish liquidation wave towards the downside which is going to activate the completion of the second ascending wedge fractal and the preceding wave C towards the bearish direction.
In the next times, the whole bearish ascending wedge fractal will be completed with the breakout below the lower boundary followed by the breakout below the 65EMA and 100EMA from where the bearish trend acceleration is going to unfold huge accelerations towards the downside and the severe bearish continuations towards the lower target zones. Especially, in this case, the market could still continue beyond this level in the bearish direction.
Upcoming Perspectives and the major underlying factors that are primarily important for consideration on the short side for the stock, the sector, and the economic field:
It has to be mentioned that an economic field with high interest rates, spreading inflation, a stagnation within the sector is setting up the determination to increase this whole bearish wave development, especially with a more bearish volume moving into the market. Also, highly determining in this case is the actual technology developments because when they reverse in an economic field this will have massive bearish effects on the stock as well.
Now, for traders it is highly important to follow such market situations with the appropriate setup within the market, especially in such times it is necessary to have the right positioning within the market because a massive bearish pressure acceleration can start anytime soon considering a huge acceleration in the inflation, a smart money operator bearish market making in which the bearish conclusion will be inevitable, an expiring futures market in which a lot of futures turn to an bearish volatility in the market. This is why traders need to position their selves before all these heavy bearish scenarios are set up.
In this manner, thank you everybody for watching my analysis of ADBE. Support from your side is greatly appreciated.
VP

Robinhood (HOOD) – Consolidation After Strong Run🔍 Fundamental Highlights:
Cathie Wood’s ARK Invest recently bought 124,427 shares of Robinhood NASDAQ:HOOD , valued at approx. $15.4M, reinforcing her bullish stance despite recent market volatility. This move aligns with ARK's broader rotation into crypto-adjacent and disruptive finance plays — including names like Coinbase, BitMine, and Circle. This kind of conviction buying often precedes major inflection points.
📉 Technical Setup:
After a strong rally, HOOD is now consolidating. Price action is tightening, volume is cooling, and a pullback into the $95–$98 zone offers a compelling risk-reward opportunity. This range has previously acted as demand, and a bounce here could trigger the next leg higher.
📌 Trade Plan (Illustrative Only):
Entry Zone: $95 – $98
Take Profit Targets: $117, then $153
Stop Loss: $85 (invalidates support zone)

SMCI Loss of this Support can result into crash to $10.Supermicro Computer Inc. (SMCI) has been under heavy pressure since its March 2024 ATH and last month hit and held its 1M MA50 (blue trend-line). This is a key Support level, which even though it broke on the November 2024 crash, the price managed to recover and close the month back up above it. In fact, the last time SMCI closed a month below it was in March 2020 during the COVID flash-crash.
As a result, loss of this level can result into an accelerated sell-off, technically the second Bearish Leg of the long-term Channel Up, towards the 1M MA200 (orange trend-line). If it is as strong as the first Bearish Leg, then we should be expecting a -86% decline to $10.00, which would technically make contact with the 1M MA200.
Notice also how similar the current 1M RSI structure is with SMCI's last Channel Down correction in 2015 - 2018.
---
** Please LIKE 👍, FOLLOW ✅, SHARE 🙌 and COMMENT ✍ if you enjoy this idea! Also share your ideas and charts in the comments section below! This is best way to keep it relevant, support us, keep the content here free and allow the idea to reach as many people as possible. **
---
💸💸💸💸💸💸
👇 👇 👇 👇 👇 👇

SkyWater (SKYT) — Trusted U.S. Specialty Foundry Scaling UpCompany Overview
SkyWater NASDAQ:SKYT is a U.S.-based specialty semiconductor foundry serving defense, aerospace, and advanced computing with radiation-hardened, mixed-signal, and MEMS technologies—delivering secure, domestic manufacturing.
Key Catalysts
Onshoring Tailwind: DoD Trusted Foundry status + Fab 25 (Texas) acquisition position SKYT to capture CHIPS Act–driven demand.
Record Results: Q3’25 revenue $150.7M (record) on strong wafer demand and Texas contributions; margin trend improving with mix and scale.
Strategic Edge: Early leadership in quantum computing manufacturing adds long-term, high-margin optionality.
Investment Outlook
Bullish above: $13.50–$14.00
Target: $30–$32 — supported by secure supply positioning, Fab 25 ramp, and expanding defense/advanced-compute programs.
📌 SKYT — the secure U.S. foundry levered to defense, CHIPS, and next-gen compute.

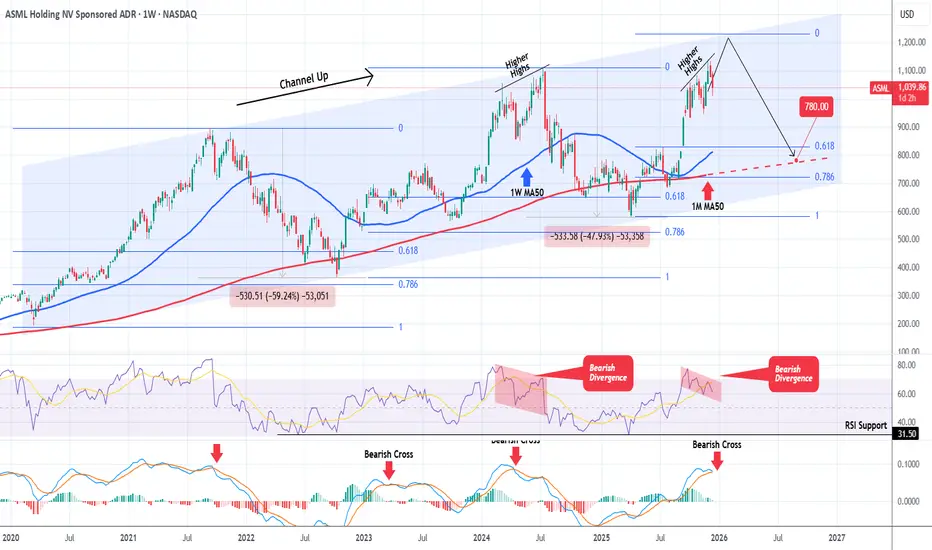
ASML is at or very close to its cyclical Top.ASML Holding (ASML) has been trading within a Channel Up since the March 2020 COVID Low and is currently approaching its Top. With the 1W RSI on a Bearish Divergence (Lower Highs against the price's Higher Highs) and the 1W MACD about to form a Bearish Cross, the stock doesn't have much room left to rise before peaking.
Assuming the maximum peak extension to be at 1235, and since both previous Bearish Legs declined to at least within the 0.618 - 0.786 Fibonacci Zone, we expect the price to drop to $780 (at least), which will also be a contact with the 1M MA50 (red trend-line).
---
** Please LIKE 👍, FOLLOW ✅, SHARE 🙌 and COMMENT ✍ if you enjoy this idea! Also share your ideas and charts in the comments section below! This is best way to keep it relevant, support us, keep the content here free and allow the idea to reach as many people as possible. **
---
💸💸💸💸💸💸
👇 👇 👇 👇 👇 👇
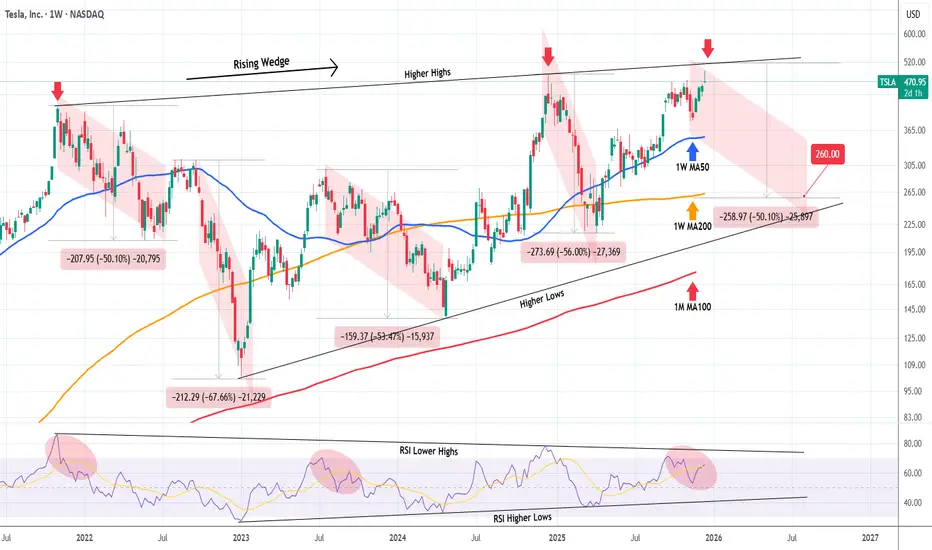
TESLA Did it just get rejected on its 4-year Resistance?Tesla (TSLA) has been trading within a Rising Wedge pattern since the November 01 2021 High. The current weekly (1W) candle almost hit this pattern's top (Higher Highs trend-line) yesterday and today got rejected.
That is the 4-year Higher Highs Resistance that initiated Tesla's last major correction of -56% during December 16 2024 - April 07 2025. Technically this pattern has provided another 3 such major correction events, with all declining by at least -50.10%.
With the 1W RSI also trading within its own Wedge, displaying a similar peak pattern, we expect the price to start a strong decline of at least 6 months. The minimum -50.10% decline projection from the Higher Highs trend-line, gives a $260.00 Target estimate. If the 1W RSI hits its Higher Lows (bottom) trend-line first, we can consider taking the profit on this one earlier.
---
** Please LIKE 👍, FOLLOW ✅, SHARE 🙌 and COMMENT ✍ if you enjoy this idea! Also share your ideas and charts in the comments section below! This is best way to keep it relevant, support us, keep the content here free and allow the idea to reach as many people as possible. **
---
💸💸💸💸💸💸
👇 👇 👇 👇 👇 👇
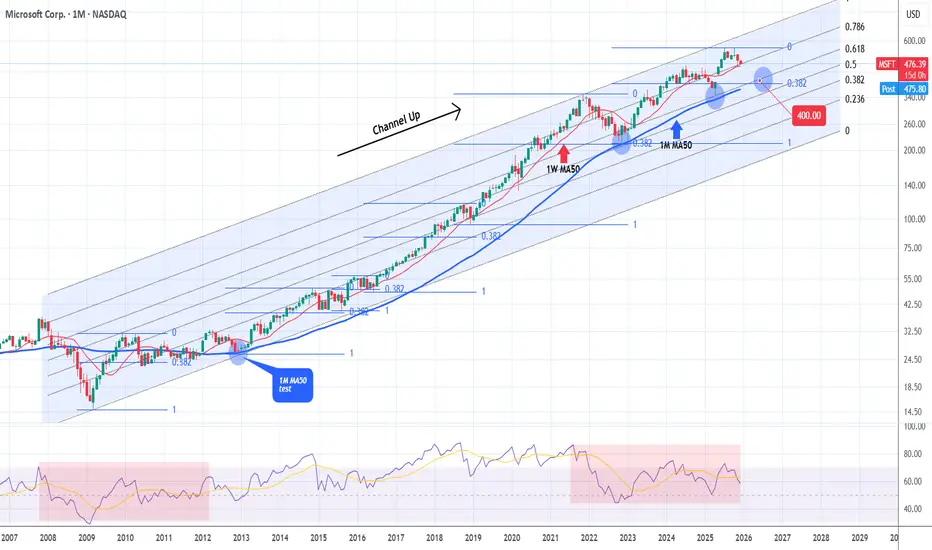
MICROSOFT testing the most important Support of the Cycle.Microsoft (MSFT) hit last month its 1W MA50 (red trend-line) and held. The rebound seems short-lived however as again half-way through December, the market is about to re-test that Support again.
This is a critical Support level for the Bull Cycle that started upon the November 2022 market bottom, as the last two times this broke, the price pulled-back to the 1M MA50 (blue trend-line).
That level has in fact been the ultimate long-term Support since 2012, the most important level of the Channel Up that started after the 2008 Housing Crisis.
We also see here that almost all of the strong bearish corrections within this pattern, hit the 0.382 Fibonacci retracement level and rebounded.
As a result, if 1W MA50 breaks again, we expect the subsequent correction / Bear Cycle to hit $400 at least.
---
** Please LIKE 👍, FOLLOW ✅, SHARE 🙌 and COMMENT ✍ if you enjoy this idea! Also share your ideas and charts in the comments section below! This is best way to keep it relevant, support us, keep the content here free and allow the idea to reach as many people as possible. **
---
💸💸💸💸💸💸
👇 👇 👇 👇 👇 👇
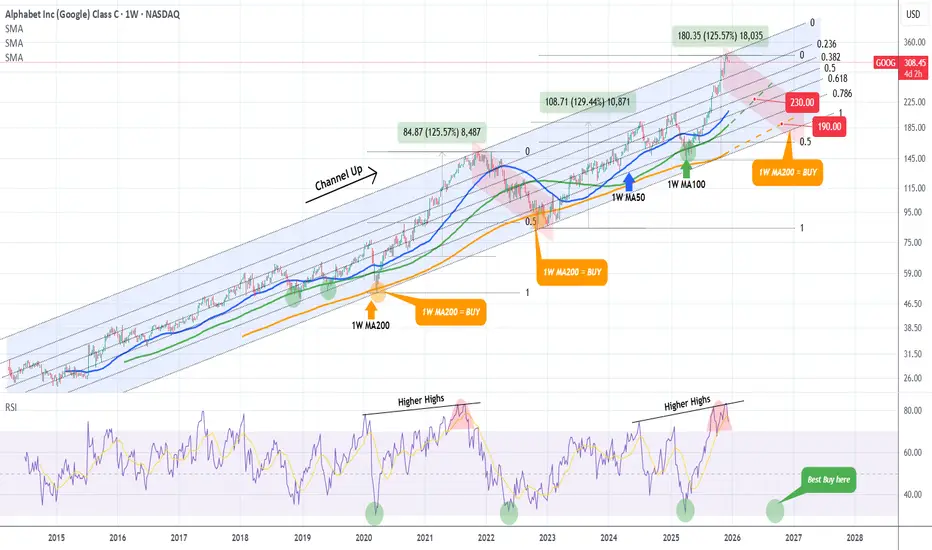
GOOGLE Bear Cycle has started and this is its ultimate blueprintWe made this chart on Google (GOOG) a little more than a month ago, warning of a potential market top on the Higher Highs trend-line of the multi-year Channel Up.
Well 3 weeks ago, the market hit that trend-line and we have a legitimate technical reason to expect that the Bull Cycle has topped. The 1W RSI has even printed the same kind of peak formation it did in September 2021.
We have extended the Channel Up on today's analysis all the way back to Google's IPO and the Fibonacci retracement levels serve absolute justice since the beginning to identify tops and bottoms.
You can see that the 1W MA200 (orange trend-line) has acted as the ultimate Support, thus best buy entry, on the last three major market corrections: the March 2020 COVID crash, the October 2022 Inflation Crisis bottom and the April 2025 (almost) Tariff War.
Before that, it was the 1W MA100 (green trend-line) that gave two excellent buy opportunities back-to-back.
As a result, even though the 2022 Bearish Leg correction bottomed on the 0.5 Fibonacci retracement level, this time we will 'limit' the new Bear Cycle to those MA trend-lines, the MA100 and MA200. If the price is contained on the MA100, its current trajectory shows a potential 'fair' contact around $230. If the market fails to rebound there, we expect a Q3 2026 bottom on the 1W MA200 around $190.
Regardless of that, we will also be looking closing at the 1W RSI. Since the 2020 COVID crash, and those 3 in total major corrections that the Alphabet stock had, when the RSI hit the 32.00 level, it presented an objective buy opportunity, even though in 2022 it dipped even lower.
---
** Please LIKE 👍, FOLLOW ✅, SHARE 🙌 and COMMENT ✍ if you enjoy this idea! Also share your ideas and charts in the comments section below! This is best way to keep it relevant, support us, keep the content here free and allow the idea to reach as many people as possible. **
---
💸💸💸💸💸💸
👇 👇 👇 👇 👇 👇
SNDK: at macro resistance Price broke out through the resistance zone highlighted in the September update and continued to show strong upside momentum. However, the trend structure now appears substantially extended at current levels.
As long as the price remains below the 207–225 resistance zone, I expect selling pressure to start building, potentially leading to a pullback toward the 130–100 support area.
Chart:
Previously:
On resistance level (Sep 26):
Chart:
www.tradingview.com

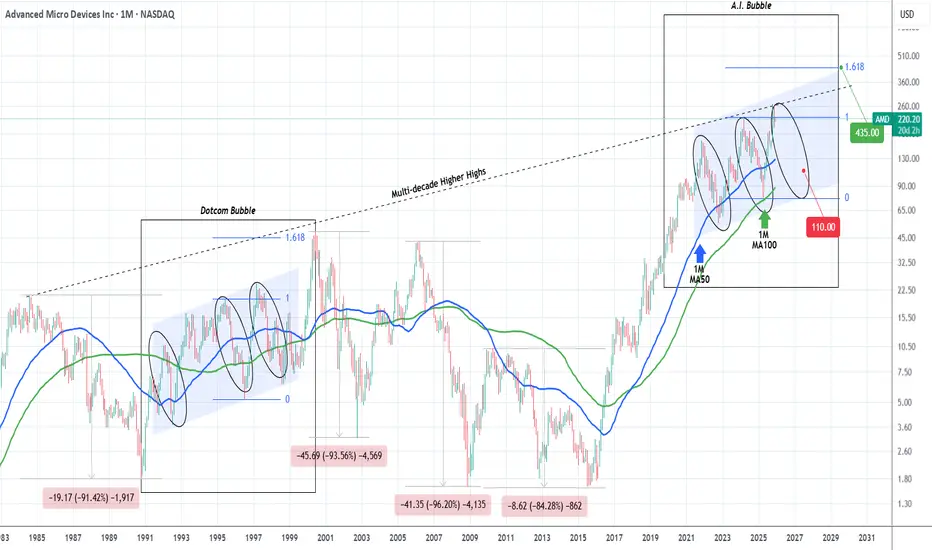
AMD started the A.I. Bubble's final Bear Cycle.2.5 months ago (October 27, see chart below), we gave a bold sell signal on Advanced Micro Devices (AMD), which at the time was against the prevailing bullish market sentiment but started to pay off immediately as the market topped and got rejected:
We still view that Top as the Higher High of its 6-year Channel Up, hence expecting the rejection to evolve into a technical Bearish Leg (Bear Cycle), targeting $110.00.
On today's analysis, we take the long-term horizon a step further as we go back to 1984 and the start of AMD's multi-decade Higher Highs trend-line, a Resistance level that has historically pushed the stock to its key market Tops.
On this 1M time-frame, we have pointed out the Dotcom (Internet) Bubble comparing it with the current A.I. Bubble. As you can see there are strong similarities between the two eras and more specifically the symmetry among their Bullish and Bearish Legs. As mentioned on the previous analysis, the current fractal has technically topped, and is now starting the new Bearish Leg towards $110 and the 1M MA100 (green trend-line).
During the Dotcom Bubble when that corresponding final Bearish Leg was completed, the market started is final parabolic rally that peaked marginally above the 1.618 Fibonacci extension and the Bubble burst.
For investors that have a long-term multi-year horizon, that translates for the A.I. Bubble into a $435 Target by 2030.
---
** Please LIKE 👍, FOLLOW ✅, SHARE 🙌 and COMMENT ✍ if you enjoy this idea! Also share your ideas and charts in the comments section below! This is best way to keep it relevant, support us, keep the content here free and allow the idea to reach as many people as possible. **
---
💸💸💸💸💸💸
👇 👇 👇 👇 👇 👇
SOFI 1D double checking the bill before the next moveSOFI is trading at 27.09 and may retrace toward 25.00, which is a strong demand area combining the 0.786 retracement level, a major VWAP node and a visible volume cluster. Since September 25 the price has been moving inside a broadening channel, signalling liquidity expansion. The 25.00 level remains a balance zone with proven buyers. The pullback from 32.73 looks like a structural retest.
Fundamentally SOFI stays strong as of December 11 2025. The company reports more than 8.2 million members and around 2.5 billion USD in annual revenue. The lending segment generates over 1.3 billion USD, and the banking division adds about 0.85 billion USD. Operating cash flow is positive. Recent news includes an expanded partnership with Mastercard, a new corporate credit platform and full Technisys integration.
As long as the price holds above 25.00, the bullish structure remains valid. A rebound from demand opens the path toward 29.20, 34.51 and 41.48. VWAP and volume behavior confirm buyer interest.
Fintech never avoids a plot twist. SOFI seems to be preparing one more dip before the next act.

TESLA Is December seasonality about to hit it hard?Tesla (TSLA) has been trading within a 3-year Channel Up and has been on a Bullish Leg since the April 07 market low. Not everything on its long-term outlook is positive though as December in the past 5 years, holds a bearish seasonality for the stock as it has aggressively declined.
A 1W MACD Bearish Cross was always present during these times and so is today. With the price trading under a familiar Lower Highs trend-line as in 2023, we see strong probabilities that Tesla starts a new long-term correction. The minimum drop on these corrections has been -50% so a repeat of that would put the price exactly at the bottom of the Channel Up at $236, with only the 1M MA100 (red trend-line) in support.
---
** Please LIKE 👍, FOLLOW ✅, SHARE 🙌 and COMMENT ✍ if you enjoy this idea! Also share your ideas and charts in the comments section below! This is best way to keep it relevant, support us, keep the content here free and allow the idea to reach as many people as possible. **
---
💸💸💸💸💸💸
👇 👇 👇 👇 👇 👇

AMAZON 's new Bear Cycle targets $125. And it can make you rich.Amazon Inc. (AMZN) has been trading within a massive 24-year Channel Up ever since its October 2001 bottom of the Dotcom crash. This pattern, as you can see, has been following a very distinct structure with its 1M MA100 (green trend-line) being the major Support level (and providing the most efficient buy opportunities) since November 2006.
What stands out here is the period from late 2020 until today and how it resembles the one from late 2003 to late 2007. Both traded under multi-year Higher Highs trend-lines and in October 2007 that formed a Top, causing a 2nd correction within that time-frame that bottomed once it hit the 1M MA100 within the Support Zone of the previous consolidation phase.
Today's fractal has already made the 1st correction in 2022, which not surprisingly also bottomed on the 1M MA100 and kick-started the rally towards the Higher Highs trend-line again. We are now at the point where there are high probabilities that the 2nd correction will take place.
If the market continues to follow the past pattern, we expect Amazon to bottom below the 1M MA100 this time and at the bottom of the Support Zone within the $130.00 - $125.00 range. This will make an ideal Higher Low right at the bottom of the 24-year Channel Up.
So what can make you rich on this? Making a long-term buy of course and keeping it until 2030 - 2032 as the new Bullish Leg that will start, will effectively be the new Bull Cycle. And as this chart shows, these Cycles have had similar rises, with the 'weakest' one being +1037%.
---
** Please LIKE 👍, FOLLOW ✅, SHARE 🙌 and COMMENT ✍ if you enjoy this idea! Also share your ideas and charts in the comments section below! This is best way to keep it relevant, support us, keep the content here free and allow the idea to reach as many people as possible. **
---
💸💸💸💸💸💸
👇 👇 👇 👇 👇 👇

NVIDIA This is how it can reach $100 and the Supports involved.NVIDIA Corporation (NVDA) had a strong red 1M candle last month, the first one after a rally of 7 straight green months. This is not the first time we present you this 12-year Channel Up, in fact we used this in late October to give a sell signal.
The reason is that Nvidia almost reached the top of that pattern, a technical Higher High, successive if you count the late 2024 one. Such Double Tops have been previously consistent with the start of strong corrections (Bearish Legs) which in both cases (2018 and 2022) bottomed on the 1W MA200 (orange trend-line).
The key element that we added on the chart this time is the (green) Support Zone, which stemmed every time from the last consolidation (blue circle) before the Top.
It is no surprise that this time it also falls on the 1W MA200 and a potential contact with the price towards Q3 2026 and beyond. Even then, it will still be above the 0.382 Fibonacci retracement level as in December 2018 and quite close to the bottom of the Channel Up for the first time since October 2022.
Our long-term Target and thus next long-term Buy Signal, remains $100.
---
** Please LIKE 👍, FOLLOW ✅, SHARE 🙌 and COMMENT ✍ if you enjoy this idea! Also share your ideas and charts in the comments section below! This is best way to keep it relevant, support us, keep the content here free and allow the idea to reach as many people as possible. **
---
💸💸💸💸💸💸
👇 👇 👇 👇 👇 👇

APPLE Just formed its Cycle Top. Best sell opportunity is here.Almost 3 months ago (September 19, see chart below), we gave a buy signal on Apple Inc. (AAPL), which recently hit our final $290 Target:
This week we go back to the long-term 1W time-frame as the Bullish Leg (green) since the April 07 bottom just hit the top (Higher Highs trend-line) of its 4-year Channel Up.
The 2023 Bullish Leg also peaked on its 1.236 Fibonacci extension and eventually corrected back to its 1W MA50 (blue trend-line), hitting its 0.382 Fibonacci retracement level at the same time. The 2022 and early 2025 Bearish Legs even broke below the 1W MA50 and bottomed after a minimum -32.05% decline. The April 2025 bottom even hit the 1W MA200 (orange trend-line).
All of those Channel Up (Cycle) Tops have taken place while the 1W RSI broke above the overbought level (70.00). This has already taken place since last week and we also se the 1W MACD to start reversing, which is something that has also happened every time after a Top.
Based on all the above evidence (1.236 Fib hit, Channel Up top hit, 1W RSI overbought, 1W MACD reversing), we expect Apple to start a long-term correction (Bear Cycle), technically the new Bearish Leg of the 4-year Channel Up and initially make contact with the 1W MA50 and the 0.382 Fibonacci retracement level at $236.00. If the price closes a 1W candle below the 1W MA50, then we expect a second Target to be fulfilled at the bottom of the Channel Up at $200, below the 1W MA200 but still almost -32.00% from the top.
The most efficient long-term buy signal is perhaps given by the 1W RSI again, when it hits the 33.20 Support. Use that to time your buy entry accordingly.
---
** Please LIKE 👍, FOLLOW ✅, SHARE 🙌 and COMMENT ✍ if you enjoy this idea! Also share your ideas and charts in the comments section below! This is best way to keep it relevant, support us, keep the content here free and allow the idea to reach as many people as possible. **
---
💸💸💸💸💸💸
👇 👇 👇 👇 👇 👇

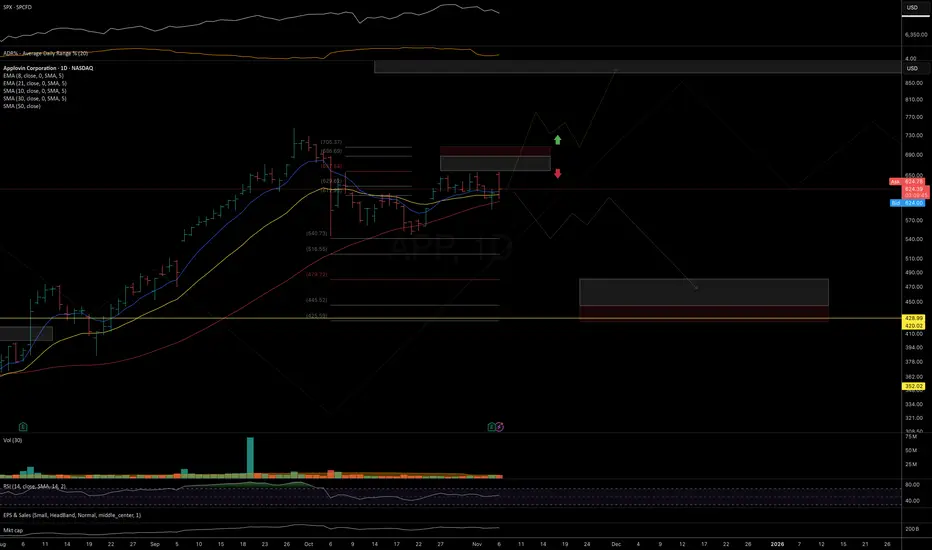
APP: at risk of deeper correctionAs long as price stays below today’s high and the 700 level, I’m watching for a deeper pullback toward 515–480 or a potential re-test of the June 2025 highs.
Alternatively, a sustained breakout above 700 would open the door for a continuation move toward the next macro resistance zone at 900–1100.
Chart:
Macro view:
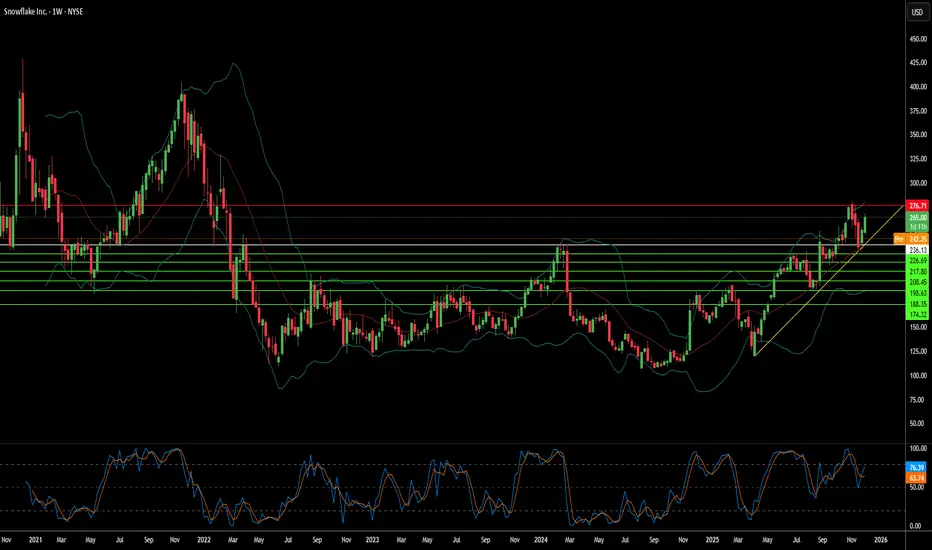
Can Data Giants Survive Their Own Success?Snowflake Inc. (NYSE: SNOW) stands at a critical crossroads, facing what the report describes as a "perfect storm of converging headwinds." Despite beating Q3 fiscal 2026 analyst estimates with $1.21 billion in revenue (up 29% year-over-year), the stock plummeted as investors focused on decelerating growth rates and concerning forward guidance. The company that once epitomized cloud data warehousing dominance is now fighting a multi-front war against aggressive competitors, shifting technological paradigms, and macroeconomic pressures that have fundamentally altered SaaS valuations.
The report identifies several structural threats eroding Snowflake's competitive position. Databricks has emerged as the ascendant force, recently valued at $100 billion compared to Snowflake's ~$88 billion market cap, while growing revenue at over 50% annually versus Snowflake's 29%. The rise of Apache Iceberg, an open table format that allows customers to store data in cheap object storage rather than Snowflake's proprietary system, threatens to cannibalize the company's high-margin storage revenue stream. Additionally, Net Revenue Retention has declined from peaks exceeding 150% to 125%, signaling saturation among enterprise customers and difficulty expanding usage within existing accounts.
Beyond competitive dynamics, Snowflake faces macroeconomic and geopolitical challenges that further complicate its challenges. The end of near-zero interest rates has compressed valuations for high-duration growth stocks. At the same time, enterprises have shifted IT spending from cloud migration to optimization and AI infrastructure budget dollars flowing toward GPUs and LLM training rather than traditional data warehousing. The 2024 credential-stuffing attacks on customer accounts, though not a platform breach, damaged Snowflake's "secure by design" reputation precisely when data sovereignty concerns and regulatory fragmentation are forcing costly infrastructure deployments across multiple jurisdictions. The company must execute a flawless pivot to AI-powered analytics while embracing open formats without destroying its business model, a classic innovator's dilemma that will determine whether Snowflake can reclaim its former market dominance or settle into mature, commoditized utility status.
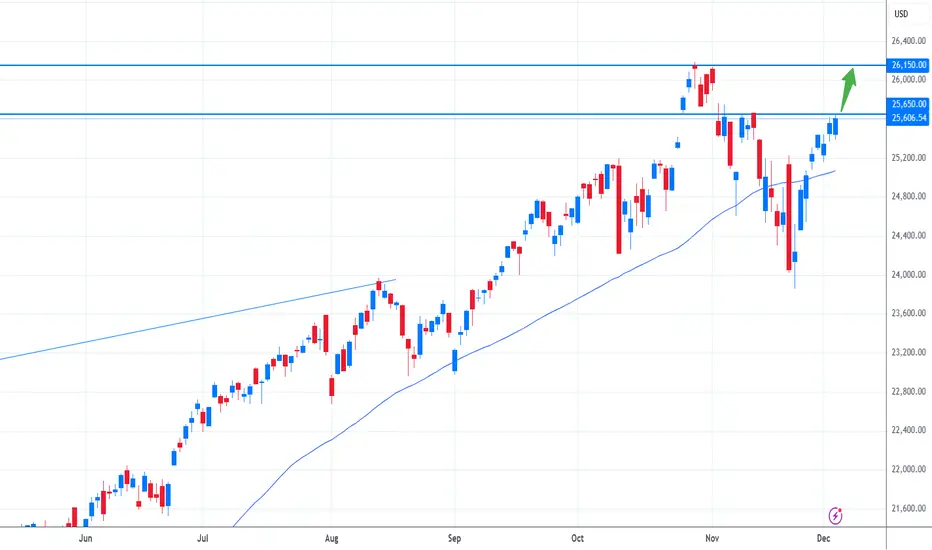
Nasdaq breakout around the corner?The Nasdaq is pushing higher as weaker US employment data boosts risk sentiment and fuels expectations that the Fed will move ahead with rate cuts. With softer labor figures reducing pressure on monetary policy, investors are rotating back into growth and tech names, supporting the broader index. The year-end rally narrative is strengthening as well, with many market participants positioning early for seasonal upside.
Lower Treasury yields are adding momentum, making equities relatively more attractive and encouraging capital to flow back into high-beta sectors. Corporate earnings remain solid in key industries, which helps stabilise sentiment after recent volatility. On top of that, easing geopolitical tensions and improved liquidity conditions are giving markets another tailwind. Market breadth has been expanding too, indicating that the upside is supported by more than just a handful of mega-caps.
From a technical perspective, the critical level to watch is the 25,700 zone. A clean break above this resistance could trigger further upside and potentially send the index toward its old all-time high. Until that breakout occurs, short-term pullbacks are still possible, but the broader setup continues to point toward a constructive outlook as long as the index holds above key support areas.
GOOGL Stock Forming a BIG Pattern — Key Levels You MUST Watch!In this video, I break down a clear chart pattern forming on GOOGL (Alphabet) stock, using detailed technical analysis.
You’ll see exactly how the pattern developed, what levels matter right now, and where the stock could move next.
🔍 What’s Covered in This Analysis:
GOOGL’s current chart structure
Clear pattern formation (triangle / channel / flag / wedge — based on your chart)
Key support & resistance zones
Breakout / breakdown levels
Trend strength and momentum
Short-term price targets
Medium-term technical outlook
Risk levels & invalidation points
📈 Why This Matters
Alphabet (GOOGL) is showing a highly tradable technical setup, and understanding this chart pattern can help you spot the next big move before it happens.
Perfect for:
Day traders
Swing traders
Long-term technical investors
Anyone following large-cap tech stocks
