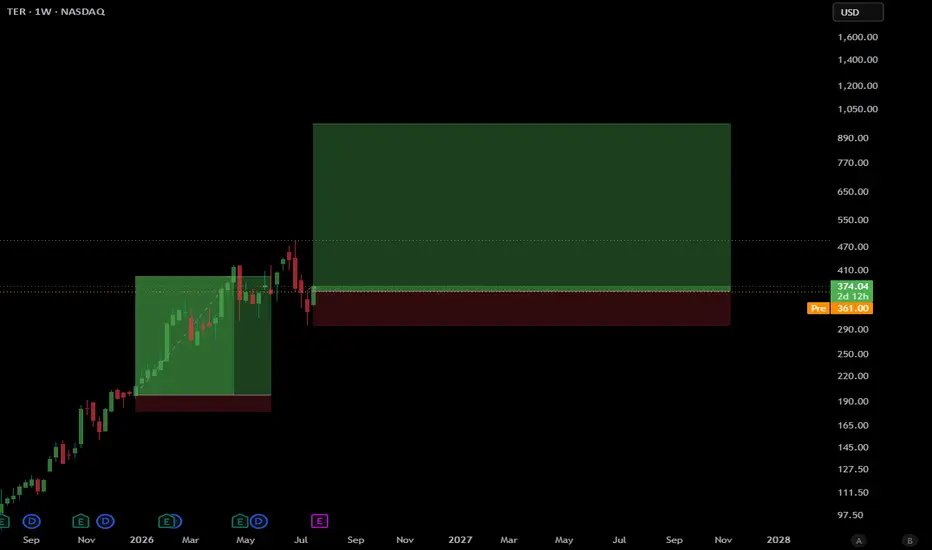
Bullish potential detected for TEREntry conditions:
(i) higher share price for NASDAQ:TER along with swing up of indicators such as DMI/RSI.
Depending on risk tolerance, the stop loss for the trade would be:
(i) below the rising 15 day EMA (currently $374.51), or
(ii) below the established support level of $358.55 from 11th June.
TER
$TER , IdeaTrade started on the 21/07.
ENTRY : CMP
TP1 : **
TP2 : **
TP3 : **
TP4 : **
SL : If you wish
** FULL SETUP AVAILABLE**
My SL is never a SELL, just an alarm to stop adding money and wait for better dca
Follow, Boost, Join, Thank You !
⚠️ Financial Disclaimer:
This post is not financial advice. I am not your financial advisor, your life coach, or your legally responsible adult.
Always do your own research and never trade based solely on internet comedy
Humanoid Robots: AI Gets Hands. Buy the Supply Chain
There is a post making the rounds right now. About the SOX index. The semiconductor index. It draws a comparison between the dot-com crash and what is happening now.
Visually, I will be honest, it looks convincing. The pattern is similar. The angle of the decline is similar. Everything lines up. But there is one very important detail that changes the entire picture - and that is where I am starting this post.
First, though - what is happening in the physical world.
AI completed its first sea
TER — Trend Continuation Long IdeaBias: Trend-continuation long with disciplined risk management to account for near-term consolidation risk.
Initiating a Buy on TER from the entry zone 302.81–305.82, as the broader technical structure remains orderly and trend strength is elevated (ADX ~54), indicating sustained directional momentum. The most recent pullback occurred on relatively light volume, suggesting limited distribution and reinforcing the case for continuation rather than reversal.
Price continues to trade above key l
TERADYNE (TER) a AI / Chip Sector Stock SHORTTER shown here on a 30 minute chart has asended in a diverging channel to the resistance of
January pivot high shown in the line and zone drawn onto the chart. My idea is to short it
from here targeting first about 106 which is the line drawn from a pivot before the
paradoxical fall with a decent earnings report. The lower target is the support trendline of
the channel or about 103.5. This is about a 6% potential trade and more with margin or
put options. I expect the trade to last two day
TER long (1-2 months) NASDAQ:TER Teradyne, Inc.
(tp: 120; sl: 88)
Reasons to buy:
- Bullish seasonality over the next 3 months
- Strong Earnings Growth
- Testing support trend line
Reasons to not to buy:
- -3.81% down last day, might keep going down until the next support lines
- Low trading volume
- High number of SELL recommendations from analysts
Reminder!
Will release financial results for the third quarter 2023 on Wednesday, October 25, 2023, at 5:00 p.m. Eastern Time (ET) or later.
Not recommendation!
Ab
Teradyne Inc. short-term LongMarket finished 1-5 Elliot wave pattern, but we are waiting for it to finish ABC correction, our forecast of where end of ABC will be is around 77 zone, since there is a strong demand zone and a 61.8 fib level where market should reverse and go bullish. Our target is the top of the gap that market made a few ago and the gap must be filled eventually.
Entry: 77
Invalidation: 69
Target: 136
Semiconductors ~ ascending triangle Technical Analysis
We have formed an ascending triangle (purple lines). If we make a measured move from the breakout, it takes us up to $275 target approximately.
21ema has been working very well as a trend following system.
OBV has been supportive of the trend.
Fundamental Analysis / News
1. Ongoing reports talking about demand for semiconductors outpacing supply, particularly from the auto makers.
2. A Reuters report that indicates CEOs of leading U.S. companies are urging the Biden ad
Index Reconstitutions: Is there a trade?A friend asked a very good trading idea question: Can we profit from additions and subtractions to stock indexes? The addition of NASDAQ:TSLA was a very public event this year and definitely led to a bull run in that stock. What about other stocks that were added and removed this year?
TER: Similar technical pattern to AMD, moving with momentumTER is one of the few stocks moving with momentum in an indecisive market condition. It is a semiconductor stock that has a similar technical pattern to AMD, with Dark Pool buying intermittently through the bottom formation. The stock recently pushed through strong resistance. With earnings in 3 weeks, this may be the start of a pre-earnings run. Watch the next levels of resistance around 45 and then 50 for profit-taking risk from professional technical traders.
Short TER to 20 and 16Cannot say more about this formation. Volume condensed at 16-20 area, there might be a support at 20 but target at 16. Thats more than half of the price drop if breaks the neckline.
P/L~50%
TShort
GBPAUD Expecting a RiseI have done some quite detailed analysis on this pair using price action, key levels and some intermediate patterns.
GBPAUD has been falling since it tapped the 1.8450 Resistance and after consolidation it finally broke down all the way back to the 1.76000 Support. This is where price currently stalls and I think multiple rejections of this current level will result in the bulls taking control. There is also some convergence on the RSI as you can see, the price is still downtrending but the RS
Teradyne longCrossing the R & S and giving a good opportunity. One more time making use of the positions in pyramid, for the risk that still exists of a rebound.
T