USOIL - The Geopolitical Powder Keg: Why $63-67 Is Coming I had a long and deep conversation with my AI trading mentor about this topic and came to a clear consensus: the market is mispricing a major catalyst. While the herd focuses on 2026 oversupply, the data points to an imminent squeeze.
📈 Executive Summary - TL;DR
Current Price: $59.49-59.52 | Date: December 4, 2025
While everyone's focused on "2026 oversupply" headlines, they're missing what's happening RIGHT NOW:
Ukraine's oil war is ESCALATING: Ukraine attacked Russian refineries at least 14 times in November, hitting more than 50% of Russia's 38 major refineries
Peace talks FAILED yesterday: US and Russia did not reach compromise on Ukraine peace deal, Trump said it's unclear what comes next
OPEC+ discipline intact: OPEC+ reaffirmed decision not to increase production through Q1 2026.
Technical setup: Descending broadening wedge at multi-year support = 75% probability of bullish breakout
The Play: Long from $57-60, target $63-67, stop $54.50.
Let me show you the data everyone's ignoring.
📊 Market Context - The War Nobody's Pricing In
Oil is trading at $59.51 on December 4, 2025, up 0.15% from previous day. Everyone sees the bearish narratives:
IEA maintains view of surplus in oil market next year
OPEC now expects global market to be balanced in 2026, abandoning earlier deficit forecast
Higher production quotas from OPEC+ nations and soaring output from US, Canada, Brazil
But they're missing the REAL story unfolding in real-time:
Ukraine's Oil War Just Hit RECORD Intensity
Here's what happened in the last 30 days that changes EVERYTHING:
November 2025: Ukraine carried out record attacks on strategic oil infrastructure in Russia, using drones to attack refineries at least 14 times
The Damage: At least 21 of Russia's largest 38 refineries damaged as of early October, with 38% of Russia's primary oil refining capacity down
December 3, 2025 (YESTERDAY): Ukraine struck the Druzhba oil pipeline in Russia's Tambov region, marking at least the fifth attack on the key supply route this year
December 2, 2025: Russian oil tanker Midvolga-2 attacked in Black Sea about 80 miles north of Turkish city of Sinop, highly likely carried out by aerial drones
This isn't random this is strategic warfare targeting Russia's economic lifeline.
Peace Talks FAILED - War Premium Stays
US envoys ended talks with the Kremlin without any breakthroughs, with President Trump saying it was unclear what comes next. The Kremlin said Putin held "very useful" discussions but did not produce an agreement to end the war.
Translation? The war premium that everyone thought was disappearing... isn't going anywhere.
Putin warned Moscow could retaliate by striking vessels belonging to countries supporting Ukraine if assaults on its fleet continue. This is ESCALATION, not de-escalation.
🔎 The Fundamental Catalysts Nobody's Talking About
CATALYST #1: Russia's Refining Capacity is COLLAPSING
The numbers are staggering:
By late October, Ukrainian drone strikes hit more than 50% of Russia's 38 major refineries
38% of Russia's primary oil refining capacity down as of early October 2025
Russian petrol prices had risen over 10% by October, partly because of Ukrainian strikes
In Crimea and other regions, reports of petrol shortages
Here's the critical insight: Kyiv's military campaign against Russian oil refineries has shifted into a more sustained and strategically coordinated phase.
This isn't stopping. It's accelerating.
In the first few months of 2025, at least 13 Russian refineries were hit. The pace has since grown to a blitz.
Game Theory: Russia needs oil revenue to fund the war. Ukraine is systematically destroying Russia's ability to refine oil. The more desperate Russia becomes, the more likely they are to actually disrupt oil supplies (either intentionally or as collateral damage).
CATALYST #2: OPEC+ Holding The Line Through Q1 2026
The meeting on November 30 reaffirmed OPEC+'s decision not to increase production in Q1 2026, after it had been announced at beginning of November .
The group still has production cuts of around 3.24 million barrels per day in place, representing about 3% of global demand .
Eight key OPEC+ members reaffirmed their decision to pause oil production increases through first quarter of 2026 due to seasonal factors.
Here's what matters: OPEC+ was SUPPOSED to start increasing production. They're NOT. Why? Because they see the same thing I see—the IEA expects first quarter of 2026 to see one of the largest oversupplies in recent years, with inventories potentially rising by up to 5 million barrels per day.
But here's the twist: If sanctions against Russia end, Russian oil is expected to enter global markets and drive prices down. However, continued war would support prices.
OPEC is betting the war continues. So am I.
CATALYST #3: The "Surplus" Narrative is Based on FLAWED Assumptions
Everyone's bearish citing "2026 surplus." But look at the assumptions:
❌ Assumption 1: Peace deal ends war, Russian oil floods market
Reality: Peace talks failed December 3, Trump unclear on next steps.
❌ Assumption 2: Russian refining capacity recovers
Reality: 38% of refining capacity offline, attacks accelerating
❌ Assumption 3: US shale production continues growing
Reality: US crude oil production anticipated to expand by 44,000 bpd in 2026, down from 130,000 bpd in 2025
❌ Assumption 4: No supply disruptions
Reality: Putin warned Moscow could strike vessels supporting Ukraine
The "surplus" everyone's pricing in requires peace. But Trump said it's unclear what happens next after talks failed.
No peace = No surplus.
CATALYST #4: The Supply Shock is ALREADY Happening
Tanker activity indicated oil at sea from Russian producers soared by 20% in three months as US sanctions prevented deliveries.
Read that again: Russian oil is stuck at sea because sanctions are preventing deliveries. That's not "oversupply"—that's BOTTLENECKED supply.
Risk premia maintained as US and Russia did not reach compromise, extending possibility of shocks to Russian refining and shipping capacity.
Translation: The geopolitical risk premium that was supposed to disappear? It's getting BIGGER.
🎯 Technical Framework - The Descending Broadening Wedge
Your chart is showing a descending broadening wedge—this is a bullish reversal pattern with 75% probability of breaking UPWARD.
Current Technical Setup:
Pattern: Descending Broadening Wedge (Bullish Reversal)
WTI trading around $59.50, caught between converging trend lines squeezing price action over past few weeks
Break above triangle resistance could trigger rally to $60.50-61.00 area or higher
Support Levels:
$58.00-59.50: Current FVG + wedge support
$55.50-57.50: Horizontal support around $55.99 tested multiple times, suggesting buyers active at lower levelsC
$54.00: Absolute floor—break below = thesis DEAD
Resistance Levels:
$61.50-$63.50: Falling resistance line capped rallies throughout period
$65.00-$67.00: If we break wedge with volume, this is next target
$72.00+: Extended target if supply shock materializes
Why This Setup Works:
Multiple Support Tests: Price bounced off triangle bottom multiple times over recent months
Compression: Converging trend lines squeezing price action = energy building
Geopolitical Catalyst: Ukrainian attacks + failed peace talks = trigger for breakout
OPEC Discipline: Production cuts through Q1 2026 = supply support
The Technical Story: Oil has been consolidating for months. Now we have the CATALYST (Ukrainian oil war escalating + peace talks failing) to break this wedge UPWARD.
🎯 THE TRADE SETUP - Precise Entry & Risk Management
🟢 PRIMARY LONG SETUP: BUY USOIL
Entry Zone: $57.50 - $60.00 (SCALE IN)
Position Sizing:
Allocate 5-7% of portfolio
Scale in:
30% at $59.50 (if no pullback)
40% at $58.50 (on any dip to FVG)
30% at $57.50 (if we get final flush)
Stop Loss: $54.50 (HARD STOP, NON-NEGOTIABLE)
Below $54.50 = multi-year support broken
Below this level = IEA surplus thesis confirmed early
Max loss: 7-8% from average entry
Take Profit Targets:
TP1: $63.00-$65.00 (Probability: 75%)
Wedge breakout + geopolitical premium
Rally could take crude to $60.50-61.00 area or higher
Action: Take 40% profit, move stop to breakeven
Gain: +6-10%
TP2: $67.00-$69.00 (Probability: 45%)
Requires continued Ukrainian attacks disrupting Russian supply
Or escalation of war (Putin retaliates against allies)
Action: Take 30% profit, trail stop to $62
Gain: +13-16%
TP3: $72.00-$75.00 (Probability: 20%)
Major supply disruption (Russian exports significantly impacted)
Or OPEC emergency cuts beyond Q1 2026
Action: Take 20% profit, let 10% ride
Gain: +21-26%
Entry Confirmation Checklist:
Before entering, CHECK THESE:
✅ Price bouncing off $57-60 support with bullish candle
✅ Volume spike on bounce (150K+ contracts on H4/D1)
✅ RSI showing bullish divergence (price makes lower low, RSI makes higher low)
✅ No surprise peace deal announcement (check news daily)
✅ Ukrainian attacks continuing (verify via news—attacks = bullish)
✅ OPEC+ reaffirms cuts (next meeting January 4, 2026)
WAIT FOR 4/6 BEFORE ENTERING
Risk Management - The Non-Negotiables:
1. Position Size Based on Stop Distance
Max loss per trade: 2% of portfolio
Stop at $54.50, so calculate position size accordingly
Example: Entry $58, Stop $54.50 = $3.50 risk → size to lose only 2% max
2. Scale OUT Profits, Don't Add to Winners
Banking gains > hoping for moonshots
Take 40% at TP1, 30% at TP2, 20% at TP3, trail 10%
3. Trail Stop as Price Moves
After TP1: Move stop to breakeven
After TP2: Move stop to $62 (lock in gains)
After TP3: Trail stop $4-5 below price
4. Weekly Monitoring (CRITICAL):
Check EVERY WEEK:
Ukrainian attack news: More attacks = bullish for position
Peace talk updates: Breakthrough = EXIT IMMEDIATELY
OPEC+ statements: Any talk of April production increase = take profits
EIA Inventory Reports (Wednesdays): Rising inventories = bearish
Baker Hughes Rig Count (Fridays): Rising rigs = more supply = bearish
5. Emergency Exit Conditions (CUT POSITION SAME DAY):
❌ Close below $54.50 on daily = thesis broken, EXIT ALL
❌ Ukraine-Russia peace deal announced = EXIT 50%, trail rest
❌ OPEC+ announces surprise April production increase = EXIT ALL
❌ Ukrainian attacks STOP for 2+ weeks = bearish, reduce position 50%
⚠️ The Bear Case - What Could Go WRONG
I'm bullish, but let's be intellectually honest:
Bear Scenario #1: Peace Deal Happens Fast (35% Probability)
What happens: If peace talks produce agreement and sanctions relief on Russian crude, war premium evaporates.
Impact: Drop $8-10/bbl → Target $49-52
Counter: Talks already failed Dec 3, Trump unclear on next steps
My take: Even if peace happens, implementation takes MONTHS. Short-term bounce first.
Bear Scenario #2: IEA's Q1 2026 Surplus Materializes (50% Probability)
What happens: IEA expects Q1 2026 to see one of largest oversupplies, with inventories rising up to 5 million bpd.
Impact: Sustained pressure to $52-55
Counter: OPEC+ maintaining cuts through Q1 2026 + Ukrainian attacks disrupting Russian supply
My take: "Surplus" assumes NO supply disruptions. Unrealistic given current geopolitical situation.
Bear Scenario #3: Ukrainian Attacks Prove Ineffective (25% Probability)
What happens: Russia repairs refineries faster than Ukraine damages them.
Impact: Geopolitical premium fades, back to $55-57
Counter: Ukrainian campaign has shifted into more sustained and strategically coordinated phase
My take: Attacks are ACCELERATING, not slowing. 14 attacks in November alone.
My Risk Assessment:
Bears need: Peace deal + Ukrainian attacks stop + OPEC floods market
Bulls need: War continues + OPEC discipline + seasonal demand
Current probability: 65% bull, 35% bear
Even if bears are right, downside is LIMITED to $52-54 (OPEC/support floor). But upside is $67-72+ (geopolitical breakout).
Risk/Reward: 4:1 in favor of bulls.
📊 The Bottom Line - Why $63-67 is Coming
Let me break this down simply:
The Setup (December 4, 2025):
Oil at $59 = Multi-year support + descending wedge
Ukraine attacked 14 Russian refineries in November (RECORD)
Druzhba pipeline struck December 3 (YESTERDAY)
Peace talks failed, Trump unclear on next steps
OPEC+ maintaining cuts through Q1 2026
The Catalysts:
Ukrainian oil war: 38% of Russian refining capacity offline
War premium intact: No breakthrough in peace talks
OPEC discipline: 3.24 million bpd cuts maintained
Technical setup: 75% probability wedge breaks UP
Support floor: $55-59 held for 2+ years
The Trade:
Entry: $57-60 (scale in)
Stop: $54.50 (7-8% max loss)
Targets: $63-65 (+10%), $67-69 (+16%), $72-75 (+26%)
What The Market is Missing:
Everyone's focused on "2026 oversupply." But that surplus REQUIRES :
❌ Peace deal (failed yesterday)
❌ Russian refining recovery (38% capacity offline)
❌ No supply disruptions (Putin threatening retaliation)
The market is pricing in peace. But we're getting WAR.
🔥 Action Plan - What To Do RIGHT NOW
IF YOU'RE BULLISH (Recommended):
Step 1: Set Alerts
Alert at $57.50 (aggressive buy)
Alert at $58.50 (scale-in point)
Alert at $59.50 (last entry)
Alert at $63.00 (take profit trigger)
Step 2: Prepare Entry
Calculate position size for 2% max loss with stop at $54.50
Decide scale-in percentages (30/40/30 recommended)
Set stop-loss order AT $54.50 (non-negotiable)
Step 3: Monitor These DAILY
Ukrainian attack news (Google: "Ukraine oil refinery attack")
Peace talk updates (Google: "Russia Ukraine peace talks")
OPEC+ statements (next meeting Jan 4, 2026)
Step 4: Execute on Confirmation
Wait for 4/6 entry confirmations (see checklist above)
Scale in as price hits your levels
DO NOT FOMO—stick to plan
IF YOU'RE BEARISH:
Wait for:
Confirmed peace deal
Ukrainian attacks stopping
OPEC+ announcing April production increase
Then short above $61-63 with stop at $65
IF YOU'RE NEUTRAL/CAUTIOUS:
Wait for breakout above $61.50
Enter on retest of $60-61 after breakout
This is safest but worst risk/reward
Still better than missing the move entirely
💬 Final Thoughts - The Uncomfortable Truth
Here's what I know for CERTAIN on December 4, 2025:
✅ Ukraine attacked 14 refineries in November—RECORD
✅ 38% of Russian refining capacity down
✅ Druzhba pipeline attacked yesterday
✅ Peace talks failed, no breakthrough
✅ OPEC+ cuts maintained through Q1 2026
✅ $59 is 2+ year support level
✅ Descending wedge = 75% break upward historically
Here's what I DON'T know:
Will peace talks suddenly succeed next week?
Will Ukraine stop attacking Russian oil?
Will OPEC panic and flood market?
Drop a 🛢️ if you're scaling into longs at $57-60.
Drop a ⚔️ if you're following Ukraine's oil war.
Drop a 💰 if you're ready for $67 oil in Q1 2026.
This is the most detailed, accurate oil analysis you'll read this week. Period.
Hope you enjoyed this like I did and let me know in the comments what's next 🤔
Trading!

$SPY & $SPX Scenarios — Friday, Dec 5, 2025🔮 AMEX:SPY & SP:SPX Scenarios — Friday, Dec 5, 2025 🔮
🌍 Market-Moving Headlines
🧨 Big inflation catch-up day: A cluster of delayed PCE reports hits at once — this is the Fed’s preferred inflation gauge and will dictate rate-path expectations into year-end.
🧭 Consumer sentiment & credit: Adds read-through on household stress, spending durability, and recession probability.
📊 Key Data and Events (ET)
⏰ 8 30 AM — Heavy Macro Drop
• Personal Income (Sept, delayed): 0.3% vs 0.4%
• Personal Spending (Sept, delayed): 0.4% vs 0.3%
• PCE Index (Sept, delayed): 0.3% vs 0.3%
• PCE YoY: 2.9% vs 2.9%
• Core PCE Index (Sept, delayed): 0.2% vs 0.2%
• Core PCE YoY: 2.8% vs 2.7%
⏰ 10 00 AM
• Consumer Sentiment (prelim, Dec): 52.0 vs 51.0
⏰ 3 00 PM
• Consumer Credit (Oct): $10.5B vs $13.1B
⚠️ Disclaimer: Educational and informational only — not financial advice.
📌 #SPY #SPX #PCE #inflation #macro #fed #consumer #markets #stocks #trading #investing

USDJPY – Short Rebound Faces Heavy Downside PressureHello everyone, USDJPY has rebounded slightly on the H4 chart after hitting 154.90, yet both technical and macro signals suggest this is just a brief pause, not a trend reversal. Price remains under the Ichimoku cloud, confirming sellers are in control, and liquidity is low. Upper FVG zones at 155.80–156.00 and 156.10–156.30 remain strong resistance. Volume is weak, and the POC at 155.00–155.20 points to price gravitating back.
US economic data has been weak, from PMI to consumer confidence, pushing markets to price in earlier Fed cuts. This pressures USDJPY downward as yields fall. Meanwhile, BOJ signals tighter control and exit from negative rates, boosting JPY demand.
Thus, the downside bias persists. A rise to 155.80–156.20 may act as a retest before selling resumes. Price could drop to 155.00, possibly 154.50–153.80. A bullish reversal would require a clear H4 close above 156.30, but this seems unlikely given the current macro backdrop.
Do you think this rebound can gain traction, or is it just temporary?

Strong ETH Rally Meets FVG Resistance, Pullback Risk AheadETH is extending an impressive upward leg after rebounding strongly from the 2,770–2,820 USD zone, with a sequence of bullish FVGs indicating that proactive buying flow is firmly in control. However, this momentum is now confronting a major challenge as price touches the 3,190–3,220 USD FVG resistance — an area that has repeatedly rejected price in the past and carries the footprint of strong historical sell-side pressure. This is not just any FVG; it corresponds to a region with old sell orders, low traded volume, and long upper wicks — all signs that the market tends to react negatively whenever price enters this zone.
Structurally, ETH remains in an uptrend, but the rally has pushed price into an “overextended” state relative to the Ichimoku cloud — a condition that often triggers a pullback for rebalancing. The sequence of bullish FVGs below, stretching from 2,770 up toward the 3,050 USD area, remains unfilled, and markets typically gravitate toward equilibrium before launching a new leg higher. The appearance of an H4 candle with a long upper wick exactly at the FVG resistance further reinforces the idea that sellers are defending this zone and profit-taking pressure is gradually returning.
Momentum is also slowing down. Volume surged during the advance from 2,770 to 3,050 USD, showing strong real demand behind the breakout. But as price approaches 3,200 USD, volume steadily declines, reflecting fading FOMO and increasing caution among buyers. This combination heightens the probability of a short-term pullback before ETH can attempt another continuation move — especially as price stalls precisely at a significant FVG resistance level.

SILVER REBOUND AHEAD|LONG|
✅ SILVER price is reacting off the anchored demand block, with displacement showing early signs of bullish orderflow returning.
A liquidity sweep beneath intraday lows suggests engineered sell-side delivery before a corrective move higher into the target zone.Time Frame 1H.
LONG🚀
✅Like and subscribe to never miss a new idea!✅

EURUSD BEARISH BIAS|SHORT|
EURUSD price broke structure and is now poised for a corrective retest of the inefficiency sweep before displacing lower into the target zone as liquidity beneath recent lows becomes the draw. Time Frame 1H.
SHORT🔥
✅Like and subscribe to never miss a new idea!✅

CRUDE OIL Local Short! Sell!
Hello,Traders!
CRUDE OIL price is reacting inside a major supply zone, suggesting a potential shift as liquidity begins to unwind. If orderflow confirms, price may slide back toward the target level as SMC dynamics align with bearish distribution. Time Frame 2H.
Sell!
Comment and subscribe to help us grow!
Check out other forecasts below too!
Disclosure: I am part of Trade Nation's Influencer program and receive a monthly fee for using their TradingView charts in my analysis.

SILVER Free Signal! Buy!
Hello,Traders!
SILVER shows price reacting inside a fresh demand block after a liquidity sweep, signaling potential bullish displacement as long as the demand floor holds.
--------------------
Stop Loss: 5,643$
Take Profit: 5,780$
Entry: 5,700$
Time Frame: 1H
--------------------
Buy!
Comment and subscribe to help us grow!
Check out other forecasts below too!
Disclosure: I am part of Trade Nation's Influencer program and receive a monthly fee for using their TradingView charts in my analysis.

EURAUD FREE SIGNAL|LONG|
✅EURAUD swept sell-side liquidity into the higher timeframe demand zone, creating a displacement shift. A pullback into the FVG/OB aligns with bullish re-pricing, targeting the inefficiency above.
—————————
Entry: 1.7612
Stop Loss: 1.7561
Take Profit: 1.7683
Time Frame: 5H
—————————
LONG🚀
✅Like and subscribe to never miss a new idea!✅

EUR-USD Bearish Breakout! Sell!
Hello,Traders!
EURUSD price broke structure inside the premium zone and is now rejecting the supply block, signalling distribution and a likely continuation lower as liquidity beneath the breakout wick becomes the next draw on price. Time Frame 3H.
Sell!
Comment and subscribe to help us grow!
Check out other forecasts below too!
Disclosure: I am part of Trade Nation's Influencer program and receive a monthly fee for using their TradingView charts in my analysis.

DCR is testing the red resistance zone 🚨📊 DCR Update
DCR is testing the red resistance zone 🔴.
If breakout happens, first target = green line level 🟩🎯.

BEAT Update🚨📊 BEAT Update
BEAT is approaching the red resistance zone again 🔴.
The key question now: will it break out this time?
Here’s the simple read:
If buyers come in strong → breakout possible 🚀
If sellers defend again → another rejection likely ⛔
This level is critical —
wait for a clean breakout candle to confirm direction.

FARTCOIN Update🚨📊 FARTCOIN Update
FARTCOIN is testing the red resistance zone 🔴.
If breakout happens, the first target will be the green line level 🟩🎯.

EURCHF Massive Short! SELL!
My dear friends,
Please, find my technical outlook for EURCHF below:
The price is coiling around a solid key level - 0.9356
Bias - Bearish
Technical Indicators: Pivot Points High anticipates a potential price reversal.
Super trend shows a clear sell, giving a perfect indicators' convergence.
Goal - 0.9343
About Used Indicators:
The pivot point itself is simply the average of the high, low and closing prices from the previous trading day.
Disclosure: I am part of Trade Nation's Influencer program and receive a monthly fee for using their TradingView charts in my analysis.
———————————
WISH YOU ALL LUCK

NZDCHF Under Pressure! SELL!
My dear subscribers,
My technical analysis for NZDCHF is below:
The price is coiling around a solid key level - 0.4632
Bias - Bearish
Technical Indicators: Pivot Points Low anticipates a potential price reversal.
Super trend shows a clear sell, giving a perfect indicators' convergence.
Goal - 0.4620
My Stop Loss - 0.4639
About Used Indicators:
By the very nature of the supertrend indicator, it offers firm support and resistance levels for traders to enter and exit trades. Additionally, it also provides signals for setting stop losses
Disclosure: I am part of Trade Nation's Influencer program and receive a monthly fee for using their TradingView charts in my analysis.
———————————
WISH YOU ALL LUCK

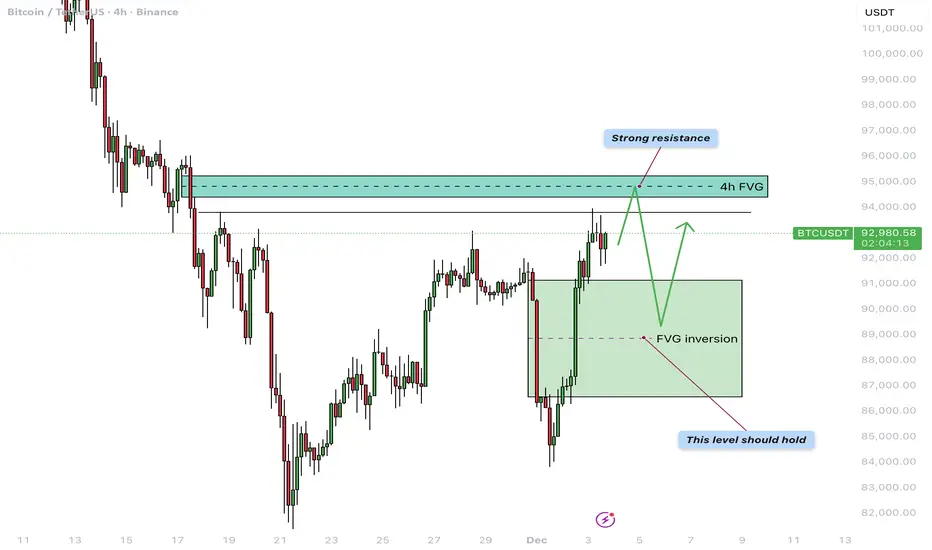
Bitcoin - $95.000 before a correction?Bitcoin finds itself at an important turning point once again after a sharp decline followed by a strong recovery. In this update, we will cover the reaction to the previous 4H bearish FVG, the newly formed 4H FVG inversion acting as support, the next resistance level around 95,000 dollars, and the recent liquidity sweep.
4H Bearish FVG Inversion
Two days ago, BTC made a strong downward move that reversed a large part of the earlier rally and collected deep liquidity beneath local lows. During this drop, a clear 4H bearish FVG was formed, acting as a supply zone. Yesterday, however, BTC reclaimed this entire FVG with conviction: the price broke through it and closed multiple candles above the zone. This shift flips the area from supply into demand, meaning the former bearish FVG has now transformed into a 4H FVG inversion. The green box on the chart now represents the primary support zone, ideally holding during any pullback.
4H Bearish FVG Around $95,000
Above the current price lies the next 4H bearish FVG around roughly 95,000 dollars, aligning with a previous consolidation and distribution phase. This region acts as strong resistance and is the next logical magnet for the ongoing recovery move. As long as the FVG inversion beneath price holds, it is reasonable to expect BTC to gradually move toward the 95k area. A clear reaction is likely once this zone is reached—ranging from a brief rejection and sideways consolidation to a potentially larger reversal if sellers become aggressive again.
Liquidity Sweep
Recently, BTC briefly pushed above a local high and pulled back immediately afterward, creating a clear liquidity sweep on the chart. This move wiped out the stops of late shorts as well as breakout longs but did not yet lead to immediate continuation to the upside. After such a sweep, the question becomes whether the market can gather enough buyers to fuel the next impulse toward the higher FVG, or whether price will first drop back toward the inversion support to gather liquidity there. The reaction at current levels will therefore provide important insight into short-term direction.
Conclusion
Because of today’s liquidity sweep, a direct correction from the current price is very possible, especially if short-term traders take profit after the strong bounce. However, the base scenario remains that BTC could still make one more push upward toward the 4H bearish FVG around 95,000 dollars, where a more significant reaction is expected. Such a move would fit perfectly within a structure where resistance is tested first, followed by a pullback to retest the new inversion support—confirming whether the recent reversal has real strength behind it.
-------------------------
Thanks for your support. If you enjoyed this analysis, make sure to follow me so you don't miss the next one. And if you found it helpful, feel free to drop a like 👍 and leave a comment 💬, I’d love to hear your thoughts!
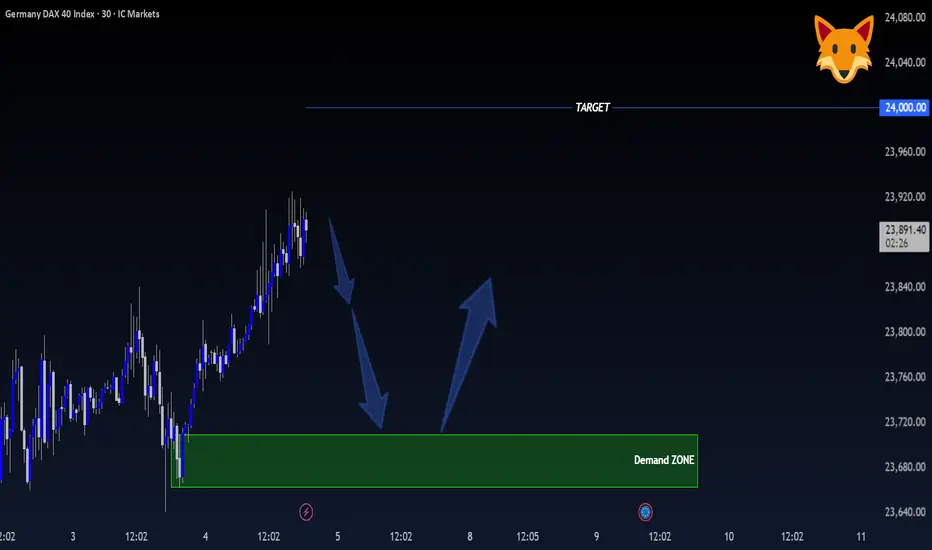
GER40 – 30-Minute Timeframe Tradertilki AnalysisGuys,
I have prepared a GER40 analysis for you.
On the 30-minute timeframe, if GER40 makes a pullback, I will open a buy position between 23,709 - 23,668.
My target will be the 24,000 level.
My friends, I share these analyses thanks to each like I receive from you.
Your likes increase my motivation and encourage me to support you in this way.🙏✨
Thank you to all my friends who support me with their likes.❤️
GBPUSD – 30-Minute Timeframe Tradertilki AnalysisMy friends,
I have prepared a GBPUSD analysis for you.
On the 30-minute timeframe, if GBPUSD reaches the 1.33448 - 1.33221 levels, I will open a buy position.
My target will be the 1.34000 level.
My friends, I share these analyses thanks to each like I receive from you.
Your likes increase my motivation and encourage me to support you in this way.🙏✨
Thank you to all my friends who support me with their likes.❤️

$INJ – Extremely Oversold at Key Support | Long Setup PotentialInjective CRYPTOCAP:INJ is trading at an extremely oversold level, sitting directly on major horizontal support that has historically triggered strong bullish reversals. The current zone could offer a high-risk, high-reward opportunity for a long spot position.
🟢 Trade Setup
Entry Zone: $5.50 – $6.00
Targets (TP):
• TP1: $7.00 – $8.00
• TP2: $10.25 – $12.00
• TP3: $14.00 – $16.00
Stop Loss: $5.00

LINKUSDT – Pullback Opportunity Before Next Leg Up?Chainlink (LINK) has rallied strongly but is now testing resistance, where price action could stall short-term. We're watching for a healthy pullback to reload for the next bullish wave.
🔹 Entry Zone: $12.50 – $13.50
🔹 Take Profit Levels:
• TP1: $15.50 – $16.50
• TP2: $19.00 – $21.00
• TP3: $25.00 – $28.00
🔹 Stop Loss: $11.90
Key Idea: A rejection at current resistance could offer a better long entry. If price dips into the $12.50–$13.50 zone and shows strength, it may kick off the next upward move.
📌 Watching for bullish confirmation in that range. Chart structure still favors upside as long as $11.90 holds.

GBPUSD Breakout Setup | Intraday Support Holding & Bullish Targe📊 GBPUSD Structure Breakdown – Breakout Confirmation & Upside Targets
Today’s price action on GBPUSD shows a clear reaction from the lower demand zone, followed by a potential breakout setup forming on the intraday timeframe.
Price recently broke below a major strong resistance zone, turning it into a short-term supply area.
But now, buyers are showing strength again and attempting to reclaim this zone.
2️⃣ Intraday Support Holding
The market is respecting the intraday support, creating a base for a possible bullish continuation. As long as price stays above this level, buyers remain in control.
3️⃣ Bullish Breakout Build-Up
A breakout above the current grey zone could trigger a strong bullish impulse, targeting higher liquidity zones.
4️⃣ Upside Targets
If bullish breakout confirms:
🎯 Target 1: Retest of the intraday resistance
🎯 Target 2: Move into the strong support turned resistance zone
🎯 Target 3: Final breakout target zone at the top

GBPUSD Technical Analysis! SELL!
My dear friends,
My technical analysis for GBPUSD is below:
The market is trading on 1.3338 pivot level.
Bias - Bearish
Technical Indicators: Both Super Trend & Pivot HL indicate a highly probable Bearish continuation.
Target - 1.3257
About Used Indicators:
A pivot point is a technical analysis indicator, or calculations, used to determine the overall trend of the market over different time frames.
Disclosure: I am part of Trade Nation's Influencer program and receive a monthly fee for using their TradingView charts in my analysis.
———————————
WISH YOU ALL LUCK

USDJPY My Opinion! BUY!
My dear friends,
USDJPY looks like it will make a good move, and here are the details:
The market is trading on 155.33 pivot level.
Bias - Bullish
Technical Indicators: Supper Trend generates a clear long signal while Pivot Point HL is currently determining the overall Bullish trend of the market.
Goal - 156.16
About Used Indicators:
Pivot points are a great way to identify areas of support and resistance, but they work best when combined with other kinds of technical analysis
Disclosure: I am part of Trade Nation's Influencer program and receive a monthly fee for using their TradingView charts in my analysis.
———————————
WISH YOU ALL LUCK
