GBP/JPY BEARS WILL DOMINATE THE MARKET|SHORT
Hello, Friends!
Previous week’s green candle means that for us the GBP/JPY pair is in the uptrend. And the current movement leg was also up but the resistance line will be hit soon and upper BB band proximity will signal an overbought condition so we will go for a counter-trend short trade with the target being at 200.420.
Disclosure: I am part of Trade Nation's Influencer program and receive a monthly fee for using their TradingView charts in my analysis.
✅LIKE AND COMMENT MY IDEAS✅
Trading

GBP/NZD SENDS CLEAR BEARISH SIGNALS|SHORT
Hello, Friends!
GBP/NZD is trending down which is evident from the red colour of the previous weekly candle. However, the price has locally surged into the overbought territory. Which can be told from its proximity to the BB upper band. Which presents a classical trend following opportunity for a short trade from the resistance line above towards the demand level of 2.296.
Disclosure: I am part of Trade Nation's Influencer program and receive a monthly fee for using their TradingView charts in my analysis.
✅LIKE AND COMMENT MY IDEAS✅

BITCOIN Will Go Lower! Sell!
Please, check our technical outlook for BITCOIN.
Time Frame: 5h
Current Trend: Bearish
Sentiment: Overbought (based on 7-period RSI)
Forecast: Bearish
The market is trading around a solid horizontal structure 102,798.30.
The above observations make me that the market will inevitably achieve 97,930.04 level.
P.S
Overbought describes a period of time where there has been a significant and consistent upward move in price over a period of time without much pullback.
Like and subscribe and comment my ideas if you enjoy them!

EURUSD Will Go Down! Short!
Here is our detailed technical review for EURUSD.
Time Frame: 1h
Current Trend: Bearish
Sentiment: Overbought (based on 7-period RSI)
Forecast: Bearish
The market is testing a major horizontal structure 1.151.
Taking into consideration the structure & trend analysis, I believe that the market will reach 1.149 level soon.
P.S
Please, note that an oversold/overbought condition can last for a long time, and therefore being oversold/overbought doesn't mean a price rally will come soon, or at all.
Like and subscribe and comment my ideas if you enjoy them!

GBPJPY Will Move Lower! Sell!
Take a look at our analysis for GBPJPY.
Time Frame: 1D
Current Trend: Bearish
Sentiment: Overbought (based on 7-period RSI)
Forecast: Bearish
The market is approaching a key horizontal level 201.166.
Considering the today's price action, probabilities will be high to see a movement to 197.887.
P.S
The term oversold refers to a condition where an asset has traded lower in price and has the potential for a price bounce.
Overbought refers to market scenarios where the instrument is traded considerably higher than its fair value. Overvaluation is caused by market sentiments when there is positive news.
Like and subscribe and comment my ideas if you enjoy them!

GBPCHF Is Bullish! Long!
Please, check our technical outlook for GBPCHF.
Time Frame: 1h
Current Trend: Bullish
Sentiment: Oversold (based on 7-period RSI)
Forecast: Bullish
The market is approaching a significant support area 1.058.
The underlined horizontal cluster clearly indicates a highly probable bullish movement with target 1.061 level.
P.S
We determine oversold/overbought condition with RSI indicator.
When it drops below 30 - the market is considered to be oversold.
When it bounces above 70 - the market is considered to be overbought.
Like and subscribe and comment my ideas if you enjoy them!

NZDUSD - Triple Confluence Zone in Play!NZDUSD has been in a steady bearish trend, but the pair is now reaching a major confluence area that could act as a strong turning point.
🔎The blue circle marks the intersection of two descending trendlines and a key demand zone, making it a massive area to look for long opportunities.
⚔️This triple intersection increases the probability of a bullish rebound, especially as the pair is also showing signs of being oversold. A potential rejection from this zone could trigger a short-term correction toward the upper orange trendline, aligning with the next resistance area.
🏹As long as this demand zone holds , the bulls have a chance to step in and shift short-term momentum upward.
⚠️ Disclaimer: This is not financial advice. Always do your own research and manage risk properly.
📊All Strategies Are Good; If Managed Properly!
~Richard Nasr

LiamTrading – Gold Confirms Medium-Term UptrendLiamTrading – Gold Confirms Medium-Term Uptrend
Gold has officially broken through the descending trendline, confirming a transition to a medium-term uptrend. After a prolonged accumulation phase, the market is beginning to show clear buying strength, and the potential for an extended rally is gradually forming.
Macroeconomic – Fundamental Analysis
The latest report from the World Gold Council (WGC) shows that central banks continued to increase their gold purchases significantly in September, totaling 39 tons, the highest level since the beginning of the year.
Most notably, the Central Bank of Brazil added 15 tons of gold to its national reserves for the first time this year.
Since the beginning of the year, net purchases by central banks have reached 200 tons, clearly reflecting a shift away from the USD amidst global economic and geopolitical instability. This capital flow provides a solid foundation for gold's medium- and long-term uptrend.
Technical Analysis
On the H2 chart, gold prices have broken the descending trendline, signaling a reversal and establishing a new upward structure.
The 3985–3988 zone is acting as dynamic support, potentially serving as a retest point before prices continue to rise.
The POC of the Volume Profile at the 4015–4017 zone is a short-term resistance, where the market may see profit-taking reactions before breaking higher.
The 4046 mark is considered a decisive area; if surpassed and maintained, the medium-term uptrend will be strongly reinforced.
Today's Trading Scenarios
Scenario 1 – Buy in line with the uptrend:
Entry: 3986–3988 (may wait for retest confirmation)
SL: 3980
TP: 4020 – 4045 – 4090
Scenario 2 – Short sell at resistance:
Entry: 4015–4017
SL: 4023
TP: 4002 – 3986
Summary
Gold is signaling a clear establishment of a medium-term uptrend, supported by central bank buying flows. Traders should prioritize buying positions at strategic support zones and observe price reactions around the POC to confirm the next direction.

GOLD Is Very Bullish! Buy!
Here is our detailed technical review for GOLD.
Time Frame: 1h
Current Trend: Bullish
Sentiment: Oversold (based on 7-period RSI)
Forecast: Bullish
The market is on a crucial zone of demand 3,965.68.
The oversold market condition in a combination with key structure gives us a relatively strong bullish signal with goal 3,993.60 level.
P.S
Overbought describes a period of time where there has been a significant and consistent upward move in price over a period of time without much pullback.
Like and subscribe and comment my ideas if you enjoy them!

AUD/USD – Smart Money Building Quietly at the BottomThe AUD/USD pair is trading around 0.6510, consolidating after an extended bearish move. From a Smart Money Concept (SMC) perspective, price action suggests that institutional players may be absorbing liquidity at discounted prices, hinting at a potential accumulation phase before driving price upward to collect liquidity at higher zones.
💭 1️⃣ Market Structure – When Price Pauses to “Take a Breath”
Following a series of bearish legs, AUD/USD has formed a Market Structure Shift (MSS) near the 0.6460 zone, signaling early signs of weakening bearish momentum.
Currently, price is holding within 0.6500 – 0.6510, forming a stable base of support. If this structure holds, it may serve as the foundation for a short-term bullish correction targeting the upper supply zones.
Each dip into the lower range has shown long lower wicks and narrow candle bodies — a classic footprint of Smart Money absorbing sell-side liquidity in preparation for accumulation.
🩶 2️⃣ Supply & Demand Zones – Footprints of Smart Money
Karina is closely monitoring three key structural zones:
Demand Zones:
0.6462 – 0.6432: A strong demand base where price has reacted multiple times — likely a zone of institutional accumulation.
0.6504: A short-term demand area currently being tested, acting as the first layer of support.
Supply Zones:
0.6570: A local supply zone where price may react upon retracement.
0.6642 – 0.6667: A higher supply zone filled with resting buy-side liquidity — potential target area for the next institutional move.
🧭 3️⃣ Liquidity Context – When Smart Money Buys Low to Sell High
The liquidity landscape shows that sell-side liquidity has already been swept near 0.6460, while buy-side liquidity remains untouched around 0.6618 – 0.6707.
This aligns perfectly with a common SMC narrative:
Smart Money absorbs liquidity below → builds structure → drives price upward to collect liquidity above.
If price maintains structure above 0.6504 – 0.6462, we could see a bullish displacement toward the next liquidity pools around 0.6570 and 0.6640 – 0.6660.
🌙 4️⃣ Trade Scenario – Follow Smart Money, Don’t Fight It
Karina’s current bias favors buying from discount zones once structure confirms a shift.
Entry: 0.6465 – 0.6500
Stop Loss: below 0.6430
Take Profit: 0.6570 – 0.6660
This setup aligns with institutional logic — buy where Smart Money accumulates, take profit where they distribute.
🌷 5️⃣ Reflection – When the Market Is Quiet, Institutions Are Working
The market doesn’t need loud volatility to tell a story — often, quiet accumulation speaks the loudest.
To Karina, this phase is about patience and observation — letting structure reveal its intent instead of rushing into noise.
Right now, the market feels like it’s taking a deep breath before its next move. Smart Money usually moves in silence — they buy low, and sell high. 🌸

AUDJPY: Short Term Bearish Movement 🇦🇺🇯🇵
AUDJPY may drop from the underlined intraday horizontal resistance.
We can expect a retracement at least to 99.9 level.
❤️Please, support my work with like, thank you!❤️
I am part of Trade Nation's Influencer program and receive a monthly fee for using their TradingView charts in my analysis.

Gold price analysis June 11✏️ XAUUSD Analysis — 06/11
Today's gold trading range is being established within 100 prices, limited by the resistance zone of 4031 and the support zone of 3931.
The main trend is still up, so the strategy of prioritizing BUY following the market momentum will be more suitable in this period.
The Keylevel zone of 4031 continues to play an important role — if the buying force is strong enough to break this zone, the next target will be 4150.
On the other hand, it is necessary to observe the price reaction around the trendline and the support zone of yesterday's Asian session to determine whether the buying force is still maintained or not.
📈 Trading Plan
BUY around 3984
BUY when there is a price rejection signal at support 3931
BUY DCA when price breaks 4031
🎯 Target: 4150
⚠️ Risk: when price breaks the trendline and closes the candle below 3930

Gold Price Breakdown Setup Toward 3960 SupportGold price is trading near 3982, forming higher highs along a trend line. A potential breakdown below the trend line could trigger a move toward 3960 and 3929 support zones.

NZDCAD WILL FALL|SHORT|
✅NZDCAD has pulled back into a premium supply zone after a displacement leg that broke structure. Liquidity above internal highs has likely been swept—expect a move toward the next imbalance. Time Frame 3H.
SHORT🔥
✅Like and subscribe to never miss a new idea!✅

GBP-AUD Will Keep Falling! Sell!
Hello,Traders!
GBPAUD is forming a clear bearish wedge, showing distribution inside a premium zone. Once liquidity above internal highs is swept, expect a displacement toward the downside. Time Frame 4H.
Sell!
Comment and subscribe to help us grow!
Check out other forecasts below too!
Disclosure: I am part of Trade Nation's Influencer program and receive a monthly fee for using their TradingView charts in my analysis.

SILVER FREE SIGNAL|SHORT|
✅SILVER Price is reacting from the supply level after a strong retracement, confirming sellers’ presence. Expect a move toward the $47.80 target area.
—————————
Entry: $48.20
Stop Loss: $48.45
Take Profit: $47.80
Time Frame: 2H
—————————
SHORT🔥
✅Like and subscribe to never miss a new idea!✅

US100 Free Signal! Sell!
Hello,Traders!
US100 is expected to soon retest the horizontal supply area before continuing its bearish move toward the target zone.
---------------------
Stop Loss: 25,877$
Take Profit: 25,607$
Entry: 25,728$
Time Frame: 2H
---------------------
Sell!
Comment and subscribe to help us grow!
Check out other forecasts below too!
Disclosure: I am part of Trade Nation's Influencer program and receive a monthly fee for using their TradingView charts in my analysis.

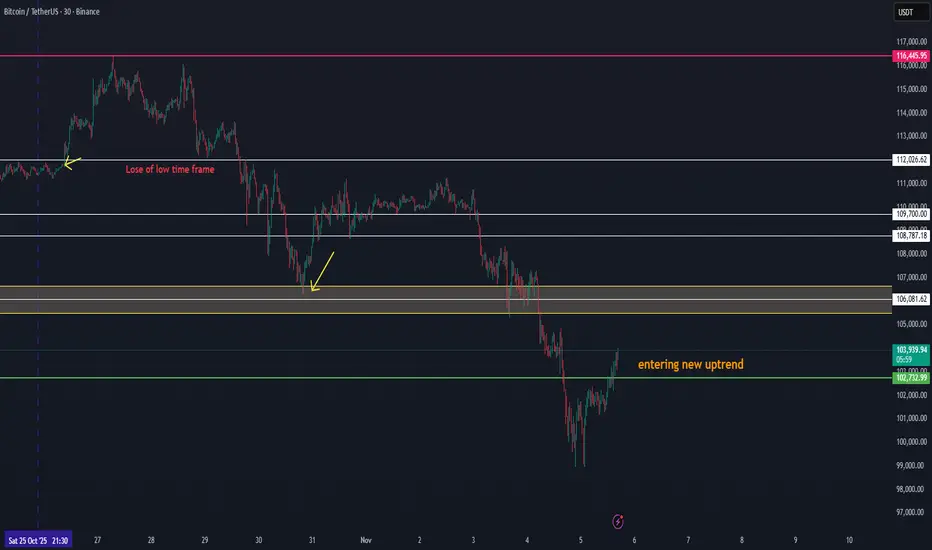
BTC Showing Early Signs of a New Uptrend Volume FormationBTC Showing Early Signs of a New Uptrend Volume Formation
Bitcoin is beginning to show new uptrend volume structure after a long corrective phase. This current movement around the 103K zone could be the first confirmation of renewed bullish momentum forming after the 110K area breakdown.
Here’s the technical context:
🔹 Structure: BTC has established a short-term higher low and is now attempting to build a new rising channel.
🔹 Volume Confirmation: The growing buy volume around 103K suggests early accumulation — this could mark the start of a new volume phase.
🔹 Targets: A sustained move above 103.8K–104.2K may confirm continuation toward 105K+, which would act as the first key resistance and validation of renewed market strength.
💡 Outlook:
If BTC maintains its current momentum and volume continues to rise, this could be the first stage of a new uptrend, with 105K+ as the initial upside target and potential re-entry toward the broader 110K recovery structure later.
DAX: Local Bearish Bias! Short!
My dear friends,
Today we will analyse DAX together☺️
The recent price action suggests a shift in mid-term momentum. A break below the current local range around 24,048.10 will confirm the new direction downwards with the target being the next key level of 23,872.63 and a reconvened placement of a stop-loss beyond the range.
❤️Sending you lots of Love and Hugs❤️

CADJPY Massive Short! SELL!
My dear subscribers,
This is my opinion on the CADJPY next move:
The instrument tests an important psychological level 109.12
Bias - Bearish
Technical Indicators: Supper Trend gives a precise Bearish signal, while Pivot Point HL predicts price changes and potential reversals in the market.
Target - 108.83
My Stop Loss - 109.30
About Used Indicators:
On the subsequent day, trading above the pivot point is thought to indicate ongoing bullish sentiment, while trading below the pivot point indicates bearish sentiment.
Disclosure: I am part of Trade Nation's Influencer program and receive a monthly fee for using their TradingView charts in my analysis.
———————————
WISH YOU ALL LUCK

GOLD: Will Go Down! Short!
My dear friends,
Today we will analyse GOLD together☺️
The in-trend continuation seems likely as the current long-term trend appears to be strong, and price is holding below a key level of 3,983.56 So a bearish continuation seems plausible, targeting the next low. We should enter on confirmation, and place a stop-loss beyond the recent swing level.
❤️Sending you lots of Love and Hugs❤️

EURUSD: The Market Is Looking Up! Long!
My dear friends,
Today we will analyse EURUSD together☺️
The market is at an inflection zone and price has now reached an area around 1.14821 where previous reversals or breakouts have occurred.And a price reaction that we are seeing on multiple timeframes here could signal the next move up so we can enter on confirmation, and target the next key level of 1.14866.Stop-loss is recommended beyond the inflection zone.
❤️Sending you lots of Love and Hugs❤️

SILVER: Strong Bullish Sentiment! Long!
My dear friends,
Today we will analyse SILVER together☺️
The price is near a wide key level
and the pair is approaching a significant decision level of 48.153 Therefore, a strong bullish reaction here could determine the next move up.We will watch for a confirmation candle, and then target the next key level of 48.559.Recommend Stop-loss is beyond the current level.
❤️Sending you lots of Love and Hugs❤️
