Why Most Traders Lose After a Big Win
Winning streaks distort your sense of control, turning confidence into overconfidence after just a few wins. You start believing success is pure skill instead of a mix of skill and luck, and that’s when discipline fades. Position sizes grow, stops are skipped, and trades you’d normally avoid start to look appealing. Risk management and careful analysis fall away as emotion takes over. Each trade remains independent, no streak changes the odds, and without resetting after every win, you eventually give back what you gained. Overconfidence feels like progress, but it’s usually the start of decline.
Your best trade often comes right before your worst.
Here’s how to avoid that trap:
Reset after every win. Treat each trade as a new game.
Keep size consistent. Don’t let emotions dictate position size.
Journal the trade. Note what worked and what didn’t.
Set limits. If you hit a profit goal for the day, stop trading.
Protect your edge. A single bad day can erase a week of gains.
Discipline is what separates traders who survive from those who restart every cycle.
Your next mistake begins when you think you can’t make one.
Trading

GOLD A Fall Expected! SELL!
My dear subscribers,
GOLD looks like it will make a good move, and here are the details:
The market is trading on 3995.7 pivot level.
Bias - Bearish
My Stop Loss - 4003.2
Technical Indicators: Both Super Trend & Pivot HL indicate a highly probable Bearish continuation.
Target - 3983.4
About Used Indicators:
The average true range (ATR) plays an important role in 'Supertrend' as the indicator uses ATR to calculate its value. The ATR indicator signals the degree of price volatility.
Disclosure: I am part of Trade Nation's Influencer program and receive a monthly fee for using their TradingView charts in my analysis.
———————————
WISH YOU ALL LUCK

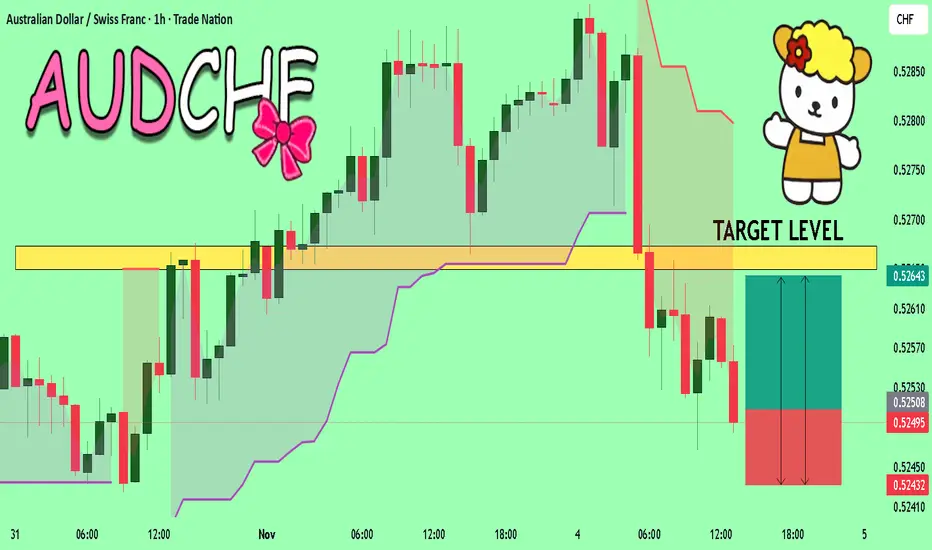
AUDCHF What Next? BUY!
My dear friends,
My technical analysis for AUDCHF is below:
The market is trading on 0.5250 pivot level.
Bias - Bullish
Technical Indicators: Both Super Trend & Pivot HL indicate a highly probable Bullish continuation.
Target - 0.5264
Recommended Stop Loss - 0.5243
About Used Indicators:
A pivot point is a technical analysis indicator, or calculations, used to determine the overall trend of the market over different time frames.
Disclosure: I am part of Trade Nation's Influencer program and receive a monthly fee for using their TradingView charts in my analysis.
———————————
WISH YOU ALL LUCK
EURJPY Trading Opportunity! BUY!
My dear friends,
Please, find my technical outlook for EURJPY below:
The instrument tests an important psychological level 176.29
Bias - Bullish
Technical Indicators: Supper Trend gives a precise Bullish signal, while Pivot Point HL predicts price changes and potential reversals in the market.
Target - 177.26
About Used Indicators:
Super-trend indicator is more useful in trending markets where there are clear uptrends and downtrends in price.
Disclosure: I am part of Trade Nation's Influencer program and receive a monthly fee for using their TradingView charts in my analysis.
———————————
WISH YOU ALL LUCK

AUDUSD Trading Opportunity! BUY!
My dear followers,
This is my opinion on the AUDUSD next move:
The asset is approaching an important pivot point 0.6496
Bias - Bullish
Technical Indicators: Supper Trend generates a clear long signal while Pivot Point HL is currently determining the overall Bullish trend of the market.
Goal - 0.6533
About Used Indicators:
For more efficient signals, super-trend is used in combination with other indicators like Pivot Points.
Disclosure: I am part of Trade Nation's Influencer program and receive a monthly fee for using their TradingView charts in my analysis.
———————————
WISH YOU ALL LUCK

USDJPY Under Pressure! SELL!
My dear friends,
Please, find my technical outlook for USDJPY below:
The price is coiling around a solid key level - 154.18
Bias - Bearish
Technical Indicators: Pivot Points High anticipates a potential price reversal.
Super trend shows a clear sell, giving a perfect indicators' convergence.
Goal - 153.86
Safe Stop Loss - 154.35
About Used Indicators:
The pivot point itself is simply the average of the high, low and closing prices from the previous trading day.
Disclosure: I am part of Trade Nation's Influencer program and receive a monthly fee for using their TradingView charts in my analysis.
———————————
WISH YOU ALL LUCK

USOIL LOCAL LONG|
✅WTI OIL is expected to bounce from the demand level near $60.00, targeting the $60.70 resistance zone as bullish momentum builds. Time Frame 3H.
LONG🚀
✅Like and subscribe to never miss a new idea!✅

ADA Retraces to Key Support | Long Spot OpportunityCardano (ADA) has retraced into a major support zone between $0.50 – $0.52, a level that previously acted as a strong base for bullish moves. This pullback could offer a high-probability long setup, especially if buying volume confirms price stabilization.
🟢 Trade Setup – Long Spot
Entry Zone: $0.50 – $0.52
Take Profit Targets:
• TP1: $0.59
• TP2: $0.67
• TP3: $0.85
Stop Loss: Just below $0.485

EUR-AUD Local Short! Sell!
Hello,Traders!
EURAUD Price rejected the horizontal supply area, confirming bearish pressure. A continuation toward 1.7650 target is expected as liquidity below recent lows attracts price. Time Frame 3H.
Sell!
Comment and subscribe to help us grow!
Check out other forecasts below too!
Disclosure: I am part of Trade Nation's Influencer program and receive a monthly fee for using their TradingView charts in my analysis.

#040: Short Investment Opportunity on CAD/CHF
In recent days, the Canadian dollar-Swiss franc cross has entered a market configuration closely resembling typical institutional distribution phases.
After weeks of moderate gains, supported by a temporary risk-on sentiment and a moderate recovery in the CAD linked to stable oil prices, the technical structure is now beginning to show signs of losing momentum.
The latest medium-high timeframe candlesticks reveal a progressive compression of the highs, accompanied by volatility that remains contained but with a declining volume delta.
This type of behavior, in intermarket readings, suggests that large operators are reducing long positions rather than accumulating new ones.
At the same time, the Swiss franc is gradually benefiting from a renewed search for protection:
rising global uncertainty and declining real yields are pushing many desks to reactivate the franc as a tactical safe haven.
This isn't yet an impulsive move, but a shift in sentiment that's beginning to be reflected in several crosses tied to the Swiss currency.
On the Canadian front, the macro outlook remains mixed:
The Bank of Canada maintains a cautious stance, openly declaring that monetary policy will remain restrictive "for an extended period," but the historical correlation between the CAD and the commodity cycle continues to make the currency vulnerable to a weakening crude oil price.
In this context, profit-taking at highs becomes natural.
From a microstructural perspective, the current price range represents a fragile equilibrium point:
The presence of passive orders concentrated in a narrow area could amplify the movement if the market decisively breaches the lower distribution margin.
A strong catalyst isn't needed; a return of risk aversion or a repricing of global interest rates is enough to trigger a rotation toward the CHF.

SILVER BEARS ARE GAINING STRENGTH|SHORT
SILVER SIGNAL
Trade Direction: short
Entry Level: 4,774.1
Target Level: 4,681.8
Stop Loss: 4,835.8
RISK PROFILE
Risk level: medium
Suggested risk: 1%
Timeframe: 1h
Disclosure: I am part of Trade Nation's Influencer program and receive a monthly fee for using their TradingView charts in my analysis.
✅LIKE AND COMMENT MY IDEAS✅

GBP/AUD BUYERS WILL DOMINATE THE MARKET|LONG
GBP/AUD SIGNAL
Trade Direction: long
Entry Level: 2.006
Target Level: 2.031
Stop Loss: 1.989
RISK PROFILE
Risk level: medium
Suggested risk: 1%
Timeframe: 1D
Disclosure: I am part of Trade Nation's Influencer program and receive a monthly fee for using their TradingView charts in my analysis.
✅LIKE AND COMMENT MY IDEAS✅

GBP/CHF BULLISH BIAS RIGHT NOW| LONG
Hello, Friends!
GBP/CHF pair is in the downtrend because previous week’s candle is red, while the price is clearly falling on the 1D timeframe. And after the retest of the support line below I believe we will see a move up towards the target above at 1.075 because the pair oversold due to its proximity to the lower BB band and a bullish correction is likely.
Disclosure: I am part of Trade Nation's Influencer program and receive a monthly fee for using their TradingView charts in my analysis.
✅LIKE AND COMMENT MY IDEAS✅

EUR/CHF BEST PLACE TO SELL FROM|SHORT
Hello, Friends!
EUR/CHF pair is trading in a local uptrend which we know by looking at the previous 1W candle which is green. On the 9H timeframe the pair is going up too. The pair is overbought because the price is close to the upper band of the BB indicator. So we are looking to sell the pair with the upper BB line acting as resistance. The next target is 0.926 area.
Disclosure: I am part of Trade Nation's Influencer program and receive a monthly fee for using their TradingView charts in my analysis.
✅LIKE AND COMMENT MY IDEAS✅

USDJPY Is Going Down! Short!
Take a look at our analysis for USDJPY.
Time Frame: 1D
Current Trend: Bearish
Sentiment: Overbought (based on 7-period RSI)
Forecast: Bearish
The price is testing a key resistance 153.489.
Taking into consideration the current market trend & overbought RSI, chances will be high to see a bearish movement to the downside at least to 149.764 level.
P.S
Please, note that an oversold/overbought condition can last for a long time, and therefore being oversold/overbought doesn't mean a price rally will come soon, or at all.
Like and subscribe and comment my ideas if you enjoy them!

GBPUSD Will Fall! Sell!
Please, check our technical outlook for GBPUSD.
Time Frame: 1D
Current Trend: Bearish
Sentiment: Overbought (based on 7-period RSI)
Forecast: Bearish
The market is trading around a solid horizontal structure 1.302.
The above observations make me that the market will inevitably achieve 1.280 level.
P.S
The term oversold refers to a condition where an asset has traded lower in price and has the potential for a price bounce.
Overbought refers to market scenarios where the instrument is traded considerably higher than its fair value. Overvaluation is caused by market sentiments when there is positive news.
Like and subscribe and comment my ideas if you enjoy them!

EURJPY Will Go Down From Resistance! Short!
Here is our detailed technical review for EURJPY.
Time Frame: 1h
Current Trend: Bearish
Sentiment: Overbought (based on 7-period RSI)
Forecast: Bearish
The market is testing a major horizontal structure 176.410.
Taking into consideration the structure & trend analysis, I believe that the market will reach 175.373 level soon.
P.S
We determine oversold/overbought condition with RSI indicator.
When it drops below 30 - the market is considered to be oversold.
When it bounces above 70 - the market is considered to be overbought.
Like and subscribe and comment my ideas if you enjoy them!

NZDJPY Will Move Lower! Sell!
Here is our detailed technical review for NZDJPY.
Time Frame: 1h
Current Trend: Bearish
Sentiment: Overbought (based on 7-period RSI)
Forecast: Bearish
The market is on a crucial zone of supply 87.148.
The above-mentioned technicals clearly indicate the dominance of sellers on the market. I recommend shorting the instrument, aiming at 86.732 level.
P.S
The term oversold refers to a condition where an asset has traded lower in price and has the potential for a price bounce.
Overbought refers to market scenarios where the instrument is traded considerably higher than its fair value. Overvaluation is caused by market sentiments when there is positive news.
Like and subscribe and comment my ideas if you enjoy them!

Silver forming a long-term “Cup and Handle” - as Gold didSilver seems to be repeating the same institutional “Cup and Handle” structure that we recently saw play out perfectly on Gold.
On Gold, the price completed the entire measured move — equal to the depth of the cup — before entering consolidation.
Now, Silver is building a very similar long-term formation, and this setup could define the market direction for the next several years.
🧠 Technical Context
On the higher timeframes (1W and 1M), Silver has formed a clear rounded base — the cup.
The current consolidation area represents the handle, and price is now approaching the upper boundary of that handle.
Once we see a decisive breakout above the handle resistance, institutions will likely defend that zone on the first retest.
This pattern is one of the most reliable continuation formations in long-term trends, especially when accompanied by rising volume near the breakout area.
There’s a very important condition: this pattern becomes active only after the handle breakout.
Before the breakout, it’s just an unconfirmed structure — the pattern is validated only once the handle level is broken.
🎯 Trade Plan
Breakout Level (Handle Resistance): around $50.0 – $51
Usually, the breakout happens on high volume, accompanied by several strong bullish candles
Retest Zone: $30 – $35.0
Target (long-term extension): $600.0+
Stop-Loss: according to your risk management strategy
📊 Summary
If Silver repeats the Gold scenario, we might see a clean breakout–retest–continuation structure with very limited pullbacks once the move begins.
This could mark the start of a multi-year bullish phase in silver.
I’ll be monitoring the breakout confirmation and volume profile closely before entering.
Once confirmed, the upside potential looks substantial compared to the risk.
This is not financial advice. For educational purposes only

XAUUSD – PRIORITIZE BUYING, TARGET 4040XAUUSD – PRIORITIZE BUYING, TARGET 4040 🎯
🌤 1. Overview
Hello everyone 💬
My perspective on gold today is still to prioritize buying, as there hasn't been a clear deep decline.
The price is currently consolidating in a narrow range, needing more time to build momentum before breaking out.
I will wait to buy again at the OB area – where there is high liquidity, this is a zone likely to see strong price reactions.
The best scenario today: the price may sell off slightly at FVG, then drop to OB to trigger the buy setup.
💹 2. Technical Analysis (ICT Perspective)
💜 Price Structure: Gold still maintains a short-term uptrend, the main trend hasn't been broken.
💎 Liquidity: Liquidity is concentrated below the 3940 area – a potential buying OB.
💫 FVG: The 3975–3980 area is a zone where a slight bearish reaction may occur.
⚙️ Order Block (OB): 3938–3945 is a crucial support zone, with the potential for a strong price rebound from here.
📈 Main Target: 4040 – a high liquidity zone, coinciding with a large frame FVG.
🎯 3. Reference Trading Scenarios
💢 Short SELL (scalping)
Entry: 3980 | SL: 3988
TP: 3972 – 3960 – 3940
💖 Main BUY (priority)
Entry: 3940 | SL: 3932
TP: 3952 – 3968 – 3990 – 4012 – 4035
✨ 4. Important Notes
🔹 Observe price reactions at FVG and OB before taking action.
🔹 If the price exceeds 3988, the bearish scenario is temporarily invalidated.
🔹 The main direction is still to buy according to the Smart Money trend – only consider short selling when confirmed.
🌷 5. Conclusion & Interaction with LanaM2
Gold is still following the Smart Money Flow trajectory,
patiently waiting for the price to reach a favorable zone to act 💪
This is not an investment recommendation, just a personal perspective based on the ICT method.
If you find it useful, please 💛 like – 💬 comment – 🔔 follow LanaM2
to stay updated with the latest gold insights every day.

$SPY $SPX Scenarios — Wednesday, Nov 5, 2025🔮 AMEX:SPY SP:SPX Scenarios — Wednesday, Nov 5, 2025 🔮
🌍 Market-Moving Headlines
🚩 First clean data of the week: After delays in earlier reports, Wednesday brings ADP Employment and ISM Services — the first confirmed macro prints to gauge real economic momentum.
📉 Labor tone check: ADP’s private payroll growth of 22,000 vs -32,000 prior suggests continued softness but potential stabilization ahead of Friday’s NFP.
💼 Services resilience: ISM Services expected to tick up slightly to 50.5, hovering near the expansion line — a critical signal for Q4 GDP trajectory.
💬 Market tone: With shutdown-delayed data still missing, traders focus on rate-cut odds, yields, and Treasury auctions for directional cues.
📊 Key Data and Events (ET)
⏰ 8:15 AM — ADP Employment (Oct) | +22,000 vs -32,000 prior 🚩
⏰ 9:45 AM — S&P Final U.S. Services PMI (Oct) | 55.2
⏰ 10:00 AM — ISM Services (Oct) | 50.5 expected, 50.0 prior 🚩
⚠️ Note:
Unlike earlier-week reports, all of Wednesday’s data are confirmed to release on schedule — making this the first meaningful macro catalyst since the FOMC. Expect intraday volatility around 8:15 AM (ADP) and 10:00 AM (ISM).
⚠️ Disclaimer: Educational and informational only — not financial advice.
📌 #trading #stockmarket #SPY #SPX #ADP #ISM #PMI #yields #Fed #inflation #bonds #economy #macro

USD-JPY Will Keep Growing! Buy!
Hello,Traders!
USDJPY continues its strong uptrend after tapping into the horizontal demand area, showing clear bullish momentum toward 154.200 target zone. Time Frame 6H.
Buy!
Comment and subscribe to help us grow!
Check out other forecasts below too!
Disclosure: I am part of Trade Nation's Influencer program and receive a monthly fee for using their TradingView charts in my analysis.

GBPAUD BEARISH WEDGE PATTERN|SHORT|
✅GBPAUD price is consolidating in a bearish wedge after a sharp drop, suggesting continuation toward the 1.9950 target zone once support breaks. Time Frame 5H.
SHORT🔥
✅Like and subscribe to never miss a new idea!✅
