NZDUSD Will Grow! Buy!
Please, check our technical outlook for NZDUSD.
Time Frame: 1D
Current Trend: Bullish
Sentiment: Oversold (based on 7-period RSI)
Forecast: Bullish
The market is approaching a significant support area 0.579.
The underlined horizontal cluster clearly indicates a highly probable bullish movement with target 0.591 level.
P.S
We determine oversold/overbought condition with RSI indicator.
When it drops below 30 - the market is considered to be oversold.
When it bounces above 70 - the market is considered to be overbought.
Like and subscribe and comment my ideas if you enjoy them!
Trading

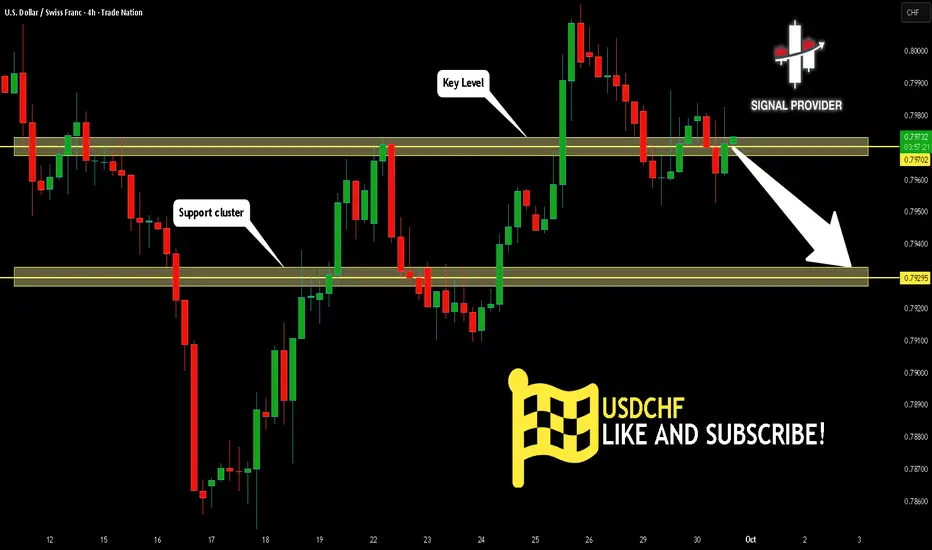
USDCHF Will Go Lower From Resistance! Short!
Here is our detailed technical review for USDCHF.
Time Frame: 4h
Current Trend: Bearish
Sentiment: Overbought (based on 7-period RSI)
Forecast: Bearish
The market is on a crucial zone of supply 0.797.
The above-mentioned technicals clearly indicate the dominance of sellers on the market. I recommend shorting the instrument, aiming at 0.792 level.
P.S
Overbought describes a period of time where there has been a significant and consistent upward move in price over a period of time without much pullback.
Like and subscribe and comment my ideas if you enjoy them!
HUMAUSDT - shiny coin!3d chart showing a breakout of descending channel after 120days of consolidation ... retest is running
patience must be rewarded.
Best regards:
Ceciliones🎯

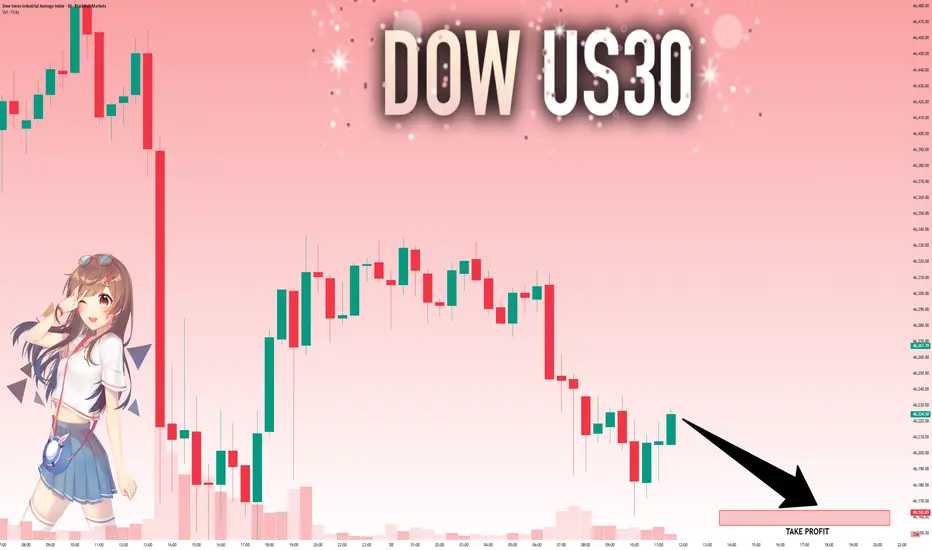
US30: Absolute Price Collapse Ahead! Short!
My dear friends,
Today we will analyse US30 together☺️
The recent price action suggests a shift in mid-term momentum. A break below the current local range around 46,224.50 will confirm the new direction downwards with the target being the next key level of 46,164.12 and a reconvened placement of a stop-loss beyond the range.
❤️Sending you lots of Love and Hugs❤️
EURUSD: Will Go Up! Long!
My dear friends,
Today we will analyse EURUSD together☺️
The in-trend continuation seems likely as the current long-term trend appears to be strong, and price is holding above a key level of 1.17380 So a bullish continuation seems plausible, targeting the next high. We should enter on confirmation, and place a stop-loss beyond the recent swing level.
❤️Sending you lots of Love and Hugs❤️

USOIL BULLS ARE STRONG HERE|LONG
USOIL SIGNAL
Trade Direction: long
Entry Level: 62.93
Target Level: 64.18
Stop Loss: 62.10
RISK PROFILE
Risk level: medium
Suggested risk: 1%
Timeframe: 4h
Disclosure: I am part of Trade Nation's Influencer program and receive a monthly fee for using their TradingView charts in my analysis.
✅LIKE AND COMMENT MY IDEAS✅

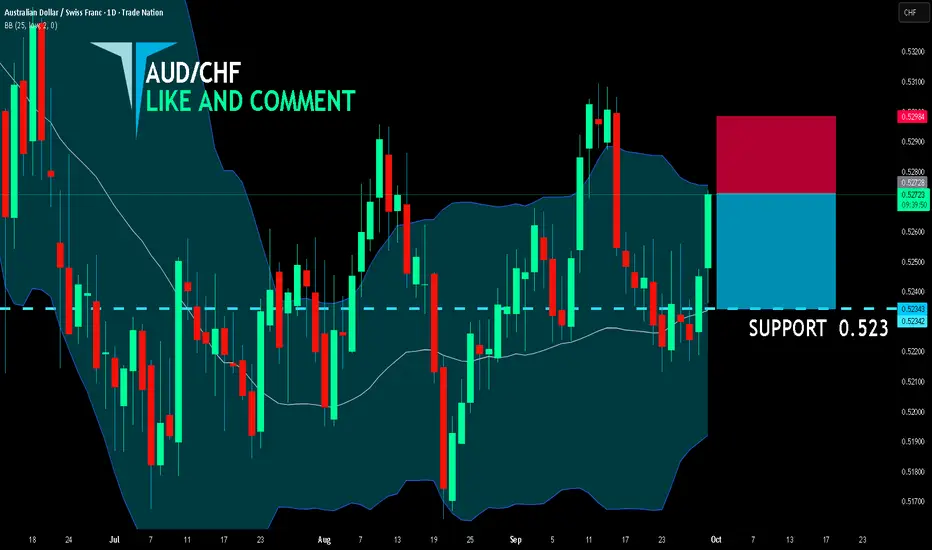
AUD/CHF SHORT FROM RESISTANCE
AUD/CHF SIGNAL
Trade Direction: short
Entry Level: 0.527
Target Level: 0.523
Stop Loss: 0.529
RISK PROFILE
Risk level: medium
Suggested risk: 1%
Timeframe: 1D
Disclosure: I am part of Trade Nation's Influencer program and receive a monthly fee for using their TradingView charts in my analysis.
✅LIKE AND COMMENT MY IDEAS✅
NZD/CHF BULLS WILL DOMINATE THE MARKET|LONG
Hello, Friends!
The BB lower band is nearby so NZD-CHF is in the oversold territory. Thus, despite the downtrend on the 1W timeframe I think that we will see a bullish reaction from the support line below and a move up towards the target at around 0.467.
Disclosure: I am part of Trade Nation's Influencer program and receive a monthly fee for using their TradingView charts in my analysis.
✅LIKE AND COMMENT MY IDEAS✅

GOLD: The Market Is Looking Down! Short!
My dear friends,
Today we will analyse GOLD together☺️
The market is at an inflection zone and price has now reached an area around 3,810.50 where previous reversals or breakouts have occurred.And a price reaction that we are seeing on multiple timeframes here could signal the next move down so we can enter on confirmation, and target the next key level of 3,790.54.Stop-loss is recommended beyond the inflection zone.
❤️Sending you lots of Love and Hugs❤️

EUR/AUD BEARS ARE STRONG HERE|SHORT
Hello, Friends!
Bearish trend on EUR/AUD, defined by the red colour of the last week candle combined with the fact the pair is overbought based on the BB upper band proximity, makes me expect a bearish rebound from the resistance line above and a retest of the local target below at 1.778.
Disclosure: I am part of Trade Nation's Influencer program and receive a monthly fee for using their TradingView charts in my analysis.
✅LIKE AND COMMENT MY IDEAS✅

BITCOIN BUYERS WILL DOMINATE THE MARKET|LONG
BITCOIN SIGNAL
Trade Direction: long
Entry Level: 109,018.58
Target Level: 113,324.76
Stop Loss: 106,141.68
RISK PROFILE
Risk level: medium
Suggested risk: 1%
Timeframe: 9h
Disclosure: I am part of Trade Nation's Influencer program and receive a monthly fee for using their TradingView charts in my analysis.
✅LIKE AND COMMENT MY IDEAS✅

GBP/AUD BEARS ARE GAINING STRENGTH|SHORT
Hello, Friends!
GBP/AUD is making a bullish rebound on the 1H TF and is nearing the resistance line above while we are generally bearish biased on the pair due to our previous 1W candle analysis, thus making a trend-following short a good option for us with the target being the 2.043 level.
Disclosure: I am part of Trade Nation's Influencer program and receive a monthly fee for using their TradingView charts in my analysis.
✅LIKE AND COMMENT MY IDEAS✅

USOIL BEARS WILL DOMINATE THE MARKET|SHORT
USOIL SIGNAL
Trade Direction: short
Entry Level: 65.18
Target Level: 63.42
Stop Loss: 66.35
RISK PROFILE
Risk level: medium
Suggested risk: 1%
Timeframe: 9h
Disclosure: I am part of Trade Nation's Influencer program and receive a monthly fee for using their TradingView charts in my analysis.
✅LIKE AND COMMENT MY IDEAS✅

SILVER: Strong Bullish Sentiment! Long!
My dear friends,
Today we will analyse SILVER together☺️
The price is near a wide key level
and the pair is approaching a significant decision level of 46.228 Therefore, a strong bullish reaction here could determine the next move up.We will watch for a confirmation candle, and then target the next key level of 46.568.Recommend Stop-loss is beyond the current level.
❤️Sending you lots of Love and Hugs❤️

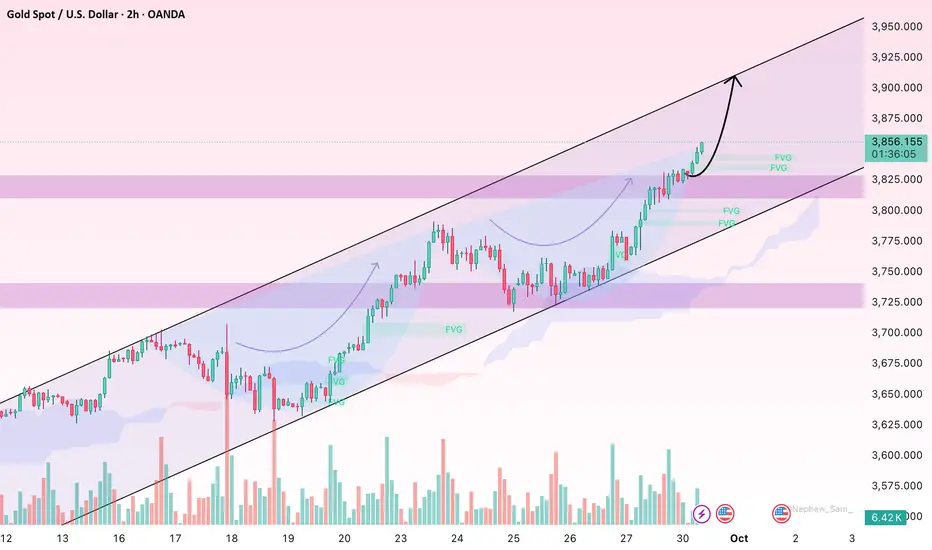
Gold Surges to 14-Year High Amid US Government Shutdown RiskHello everyone,
Gold extended its rally today, reaching its highest level in 14 years as safe-haven demand soared. The main driver comes from political uncertainty in the US, particularly the looming risk of a government shutdown as Congress struggles to pass a short-term spending bill.
From a technical perspective, gold has broken out of its FVG zone and is approaching the 3,850–3,870 USD resistance area, which now stands as the critical barrier. A decisive break above could open the door toward 3,900 USD or higher. On the downside, the 3,815–3,790 USD range (green FVG) is serving as dynamic support and a cushion for the ongoing bullish momentum.
News flow remains the dominant catalyst. The US budget standoff and shutdown fears raise concerns about disruptions in federal services and the broader economy, prompting investors to flock to gold. At the same time, the dollar is under pressure due to political instability, while weaker US 10-year bond yields and falling oil prices further strengthen the precious metal’s bullish backdrop.
What do you think about gold’s next move? Share your view in the comments!
Gold price analysis September 30During the European session, gold is in a corrective phase with notable support zones around 3790 and 3760. These are key points to watch for market reaction: if buying pressure appears and holds these zones, the uptrend could continue with a target towards 3900.
On the contrary, the 3832 area is acting as a short-term resistance – if selling pressure returns here, the price is likely to retreat to lower support zones.
📌 Strategy: Prioritize looking for BUY opportunities when price rejection signals appear at 3790 or 3760.

NZDJPY LONG FROM DEMAND LEVEL|
✅NZDJPY Price is tapping into a higher-timeframe demand zone, where ICT logic highlights discounted entry levels after sustained bearish order flow. Liquidity resting below prior lows is swept, creating conditions for a relief move toward premium levels. Time Frame 5H.
LONG🚀
✅Like and subscribe to never miss a new idea!✅

EUR-NZD Bearish Breakout! Sell!
Hello,Traders!
EURNZD price has broken down from a rising wedge structure, signaling Smart Money shift from accumulation to distribution. SMC suggests bearish momentum towards the 2.0180 target zone. Time Frame 2H.
Sell!
Comment and subscribe to help us grow!
Check out other forecasts below too!
Disclosure: I am part of Trade Nation's Influencer program and receive a monthly fee for using their TradingView charts in my analysis.

Latest Gold Price Update Today👋Hello everyone, it's great to be back! Let's take a look at OANDA:XAUUSD !
Gold continues to maintain a strong uptrend, supported by the Federal Reserve's monetary policy. Recently, statements from the Fed about maintaining accommodative monetary policy and expectations of further rate cuts are creating a favorable environment for gold.
Technically, gold is maintaining its strong uptrend, supported by a long-term upward trendline. After a small correction, the price is now returning to an important support level near 3,730 USD. This presents a potential buying opportunity if gold holds above the 0.5 and 0.618 Fibonacci levels.
Technical indicators, including short-term and long-term EMAs, show stable growth. If gold breaks through the resistance at 3,785 USD, the next target could be 3,8xx USD.
💬Do you agree with this outlook? Please leave your comments below!
Good luck!

Risk, Psychology, and Performance in World Trading1. Understanding Risk in World Trading
Risk is the potential for loss or variability in trading outcomes. Every financial instrument carries inherent risks, which can be broadly categorized:
1.1 Market Risk
Market risk refers to the potential loss from adverse price movements in financial markets. Examples include:
Equity risk: Stock prices fluctuate based on corporate performance, macroeconomic conditions, and market sentiment.
Forex risk: Exchange rate movements affect international portfolios and trading strategies.
Commodity risk: Prices of oil, metals, and agricultural products are influenced by supply-demand imbalances, geopolitical tensions, and weather events.
Key concepts:
Volatility: A measure of price variability.
Beta: The sensitivity of an asset to broader market movements.
1.2 Credit Risk
Credit risk arises when a counterparty fails to meet obligations. In global trading, this includes:
Default risk in corporate bonds.
Counterparty risk in derivative contracts, particularly in OTC markets.
1.3 Liquidity Risk
Liquidity risk occurs when an asset cannot be quickly bought or sold without significantly affecting its price. Emerging markets and certain commodities often exhibit high liquidity risk.
1.4 Operational and Systemic Risk
Operational risk: Errors, system failures, or fraud within trading platforms or institutions.
Systemic risk: Market-wide events, such as financial crises, which impact multiple assets simultaneously.
1.5 Measuring and Managing Risk
Traders use quantitative and qualitative methods to manage risk:
Value at Risk (VaR): Estimates potential loss over a defined period with a given confidence interval.
Stress testing: Simulates extreme market scenarios to evaluate vulnerability.
Position sizing and leverage management: Controlling exposure to limit potential losses.
Global perspective: Risk management strategies differ across developed and emerging markets due to variations in liquidity, regulation, and market transparency.
2. The Psychology of Trading
Trading is as much a mental game as a technical one. Psychological factors influence risk perception, decision-making, and ultimately, performance.
2.1 Cognitive Biases in Trading
Traders are prone to systematic thinking errors, including:
Overconfidence bias: Overestimating one's skill or market knowledge.
Confirmation bias: Seeking information that supports pre-existing beliefs while ignoring contrary evidence.
Anchoring bias: Relying heavily on initial information, such as entry price, when making decisions.
Recency effect: Giving undue weight to recent market events.
These biases can lead to impulsive decisions, poor risk management, and losses.
2.2 Emotional Influences
Emotions such as fear, greed, and hope strongly impact trading behavior:
Fear: Fear of loss may prevent profitable trades or lead to premature exits.
Greed: Overexposure and chasing trends due to potential gains can magnify losses.
Hope: Holding onto losing positions in expectation of a rebound often exacerbates losses.
Case study: During the 2008 financial crisis, irrational fear led to widespread panic selling, amplifying market declines.
2.3 Stress and Cognitive Load
High-pressure trading environments increase stress levels, impairing decision-making. Studies show that traders under stress are more likely to:
Overtrade
Ignore risk management rules
Make emotionally-driven rather than rational decisions
2.4 Psychological Resilience and Performance
Successful traders cultivate resilience through:
Mindfulness and meditation to reduce emotional reactivity
Systematic routines to reduce cognitive load
Reflection and journaling to learn from mistakes
Global variation: Cultural factors also influence risk tolerance and emotional responses in trading. For example, traders in collectivist cultures may be more risk-averse than those in individualistic societies.
3. Risk-Reward and Decision Making
Trading performance depends on the ability to balance risk and reward while maintaining psychological control.
3.1 Expected Value and Probabilities
Understanding the expected value (EV) of trades helps in rational decision-making:
𝐸
𝑉
=
(
𝑃
𝑟
𝑜
𝑏
𝑎
𝑏
𝑖
𝑙
𝑖
𝑡
𝑦
𝑜
𝑓
𝐺
𝑎
𝑖
𝑛
×
𝐴
𝑣
𝑒
𝑟
𝑎
𝑔
𝑒
𝐺
𝑎
𝑖
𝑛
)
−
(
𝑃
𝑟
𝑜
𝑏
𝑎
𝑏
𝑖
𝑙
𝑖
𝑡
𝑦
𝑜
𝑓
𝐿
𝑜
𝑠
𝑠
×
𝐴
𝑣
𝑒
𝑟
𝑎
𝑔
𝑒
𝐿
𝑜
𝑠
𝑠
)
EV=(Probability of Gain×Average Gain)−(Probability of Loss×Average Loss)
Consistent focus on positive EV opportunities reduces reliance on luck.
3.2 Risk-Reward Ratio
The risk-reward ratio is critical for trade planning:
Acceptable ratio: Typically 1:2 or higher (risking $1 to potentially gain $2)
Integration with stop-loss and take-profit levels ensures disciplined execution
3.3 Position Sizing and Portfolio Diversification
Position sizing: Determines the amount of capital allocated per trade based on risk tolerance.
Diversification: Reduces portfolio risk by spreading exposure across instruments, sectors, and geographies.
3.4 Behavioral Pitfalls in Risk-Reward Assessment
Loss aversion: Overemphasis on avoiding losses can lead to missed opportunities.
Chasing losses: Attempting to “win back” money increases exposure to high-risk trades.
4. Performance Metrics in Trading
Performance evaluation combines objective and subjective metrics:
4.1 Financial Metrics
Return on Investment (ROI): Measures profitability relative to capital employed.
Sharpe Ratio: Risk-adjusted performance metric.
Drawdown: Measures peak-to-trough decline; critical for risk management.
4.2 Psychological Metrics
Discipline adherence: Following trading rules and strategies
Emotional regulation: Maintaining composure during market volatility
Decision quality: Avoiding impulsive or biased choices
4.3 Case Studies in Trading Performance
Hedge fund traders: Often combine quantitative analysis with psychological profiling to enhance consistency.
Retail traders: Performance heavily influenced by psychological factors due to limited risk management tools.
5. Risk and Psychology in Global Trading Environments
Different markets present unique challenges:
5.1 Developed Markets
High liquidity, transparency, and regulation
Psychological challenges: Information overload and high competition
Risk management: Advanced hedging strategies and derivatives use
5.2 Emerging Markets
Higher volatility and lower transparency
Psychological challenges: Fear of sudden market swings and limited access to reliable data
Risk management: Conservative position sizing and reliance on local expertise
5.3 Algorithmic and High-Frequency Trading
Machines execute trades with minimal emotional influence
Human oversight is still critical to manage unexpected market events
Traders need to adapt psychologically to new roles, focusing on system monitoring rather than traditional execution
6. Strategies to Improve Trading Performance
Integrating risk management and psychological training can enhance performance:
6.1 Risk Mitigation Techniques
Stop-loss orders: Automatic exit to limit losses
Hedging: Using derivatives to offset potential losses
Dynamic risk assessment: Adjusting exposure based on market conditions
6.2 Psychological Training
Mental conditioning to manage fear and greed
Cognitive behavioral strategies to counter biases
Visualization and simulation of trading scenarios
6.3 Continuous Learning and Adaptation
Regular review of trading logs to identify patterns
Staying informed about macroeconomic trends and geopolitical risks
Flexibility to adapt strategies when market conditions change
7. Interplay Between Risk, Psychology, and Performance
Effective trading requires harmonizing three elements:
Risk awareness: Knowing potential losses and managing them systematically
Psychological control: Maintaining discipline, focus, and emotional regulation
Performance optimization: Translating analysis, risk control, and mental resilience into consistent profitability
Key insight: Even the best strategies fail if psychological weaknesses dominate decision-making. Similarly, disciplined traders without robust risk frameworks are exposed to catastrophic losses.
8. Conclusion
Trading in world markets is a complex interplay of objective analysis, risk management, and human psychology. While quantitative models, technical tools, and global market insights provide a foundation, human factors ultimately dictate success or failure. Traders who understand and integrate risk management, psychological resilience, and disciplined decision-making are more likely to achieve sustainable performance.
In essence:
Risk is unavoidable, but manageable.
Psychology influences every decision, often more than market data.
Performance emerges from the synthesis of risk control and mental discipline.
Global trading is both a science and an art. Mastering it requires continuous learning, emotional intelligence, and strategic risk-taking. The traders who thrive are those who respect both the unpredictability of markets and the limits of their own psychology, creating a balance between caution and opportunity.
Traditional Investment Options as Inflation Hedges1. Equities as an Inflation Hedge
1.1 Mechanism
Equities, or shares of publicly listed companies, represent ownership in businesses whose revenues and profits can rise with inflation. Companies producing essential goods, services, or commodities often have pricing power that allows them to pass on cost increases to consumers, preserving profit margins. Over long investment horizons, equities tend to offer nominal returns that outpace inflation, thereby enhancing real wealth.
1.2 Historical Evidence
Historically, stock markets have shown resilience during moderate inflationary periods. For example, research from the U.S. stock market during the 1970s—a period of significant inflation—demonstrated that equities provided superior real returns compared to fixed-income securities. Even in emerging markets, well-managed companies in sectors like consumer goods and energy have maintained profitability despite rising costs.
1.3 Sectoral Considerations
Not all equities respond equally to inflation. Sectors with pricing power—such as energy, utilities, consumer staples, and healthcare—often perform better. Conversely, sectors with high input costs and limited ability to raise prices, such as technology hardware or discretionary goods, may lag.
1.4 Advantages
Long-term growth potential
Dividend income can partially offset inflation
Liquidity and marketability
1.5 Risks and Limitations
Equity returns can be volatile in the short term
Inflation spikes may coincide with economic slowdowns, affecting corporate earnings
Sector-specific vulnerabilities
2. Bonds and Fixed Income Securities
2.1 Conventional Bonds
Traditional fixed-rate bonds are typically poor hedges against inflation. Their fixed coupon payments lose real value as prices rise, reducing purchasing power. Long-term bonds are particularly vulnerable, as inflation erodes the value of future interest payments.
2.2 Inflation-Linked Bonds
To counter this, many countries issue inflation-protected securities, such as Treasury Inflation-Protected Securities (TIPS) in the U.S. or Inflation-Indexed Bonds elsewhere. These bonds adjust principal and interest payments in line with inflation indices, providing a direct hedge against rising prices.
2.3 Advantages
Guaranteed principal and interest adjustments (in case of inflation-linked bonds)
Lower risk compared to equities
Useful for conservative investors seeking stable income
2.4 Limitations
Real returns may be modest compared to equities
Inflation-indexed bonds are subject to interest rate risk and liquidity concerns
Tax treatment of inflation-adjusted interest can affect net returns
3. Real Estate Investments
3.1 Mechanism
Real estate—whether residential, commercial, or industrial—represents tangible assets whose value often rises with inflation. Property rents and valuations typically track inflation over time, preserving real wealth. Real estate also offers diversification benefits, reducing correlation with financial markets.
3.2 Historical Performance
During periods of high inflation, property prices in urban and high-demand areas have historically appreciated in nominal terms. For instance, real estate in major U.S. cities during the 1970s outpaced inflation, while rental income also increased, providing an ongoing income stream.
3.3 Advantages
Tangible asset with intrinsic value
Potential for rental income
Portfolio diversification
3.4 Risks and Limitations
Illiquidity: Real estate transactions take time and incur significant costs
Maintenance, property taxes, and regulatory changes can affect returns
Location-specific risks and cyclical downturns
4. Commodities and Precious Metals
4.1 Gold
Gold is traditionally viewed as a safe-haven asset and an effective inflation hedge. Its value is not tied to currency and generally rises during periods of monetary instability or high inflation.
4.2 Oil and Energy Commodities
Energy commodities, including crude oil and natural gas, respond directly to economic and inflationary pressures. Companies and investors often use commodities to diversify portfolios against inflation risk.
4.3 Agricultural Commodities
Food and agricultural commodities tend to rise in price during inflationary periods, providing real returns. However, they can be volatile due to weather, supply chain disruptions, and global demand fluctuations.
4.4 Advantages
Hedge against currency depreciation and inflation
Portfolio diversification
Tangible value
4.5 Risks and Limitations
Price volatility and speculation
Storage and transaction costs for physical commodities
Correlation with global economic cycles
5. Cash Equivalents and Short-Term Instruments
5.1 Money Market Instruments
Short-term instruments like Treasury bills, commercial paper, and certificates of deposit provide liquidity and capital preservation but are typically weak inflation hedges due to low interest rates relative to inflation.
5.2 Strategies to Enhance Returns
Investors often ladder short-term instruments or invest in floating-rate instruments that adjust with market interest rates, partially mitigating inflation erosion.
5.3 Advantages
Low risk and high liquidity
Stability for capital preservation
5.4 Limitations
Real returns often negative during high inflation
Limited growth potential
6. Diversification Across Traditional Assets
6.1 Multi-Asset Portfolios
A balanced portfolio combining equities, inflation-linked bonds, real estate, and commodities offers a more robust hedge against inflation. Diversification reduces the risk of overexposure to any single asset class and ensures smoother real returns.
6.2 Portfolio Allocation Strategies
Equity-heavy portfolios: Suitable for long-term growth with moderate risk tolerance
Bond-heavy portfolios: For conservative investors seeking inflation-linked income
Real estate and commodities: For tangible assets and diversification
6.3 Historical Evidence
Multi-asset portfolios consistently outperform single-asset strategies during inflationary periods, particularly when asset allocations are periodically rebalanced to reflect changing economic conditions.
7. Practical Considerations for Investors
7.1 Risk Tolerance
Investors must assess their ability to absorb short-term volatility in pursuit of long-term inflation protection.
7.2 Investment Horizon
Longer horizons allow equities and real estate to outperform inflation, while shorter horizons may require more stable, inflation-linked bonds.
7.3 Cost and Liquidity
Transaction costs, management fees, and liquidity constraints influence the real return of inflation-hedging investments.
7.4 Tax Implications
Capital gains, dividends, and interest may be taxed differently, affecting net inflation-adjusted returns.
Conclusion
Traditional investment options—equities, bonds, real estate, and commodities—offer diverse avenues for hedging against inflation. Equities provide long-term growth potential, particularly in sectors with pricing power. Inflation-linked bonds offer stability and guaranteed inflation protection. Real estate provides tangible assets and rental income, while commodities, especially gold, serve as a hedge against currency depreciation and macroeconomic uncertainty.
Effective inflation hedging requires a well-diversified portfolio, tailored to the investor’s risk tolerance, horizon, and financial goals. While no investment is entirely immune to inflation, a judicious combination of traditional assets, periodic rebalancing, and strategic allocation can preserve real wealth and ensure financial stability across economic cycles.
Investors who integrate these principles into their financial planning are better equipped to safeguard purchasing power, manage risk, and achieve long-term wealth accumulation—even in the face of persistent inflationary pressures.
Market Volatility: Introduction and Types1. Introduction to Market Volatility
1.1 Definition of Market Volatility
Market volatility refers to the rate and magnitude of price fluctuations in a financial market over a given period. It is a measure of the risk or uncertainty associated with the changes in the value of assets, securities, or an index. High volatility indicates rapid and large price swings, while low volatility suggests relatively stable prices.
In simple terms, volatility shows how “wild” or “calm” a market is. It is an essential concept for traders, investors, and policymakers because it influences investment decisions, risk management, and market stability.
1.2 Importance of Understanding Market Volatility
Market volatility is not inherently negative; it has both risks and opportunities:
For Investors: Helps in portfolio diversification and managing risk.
For Traders: Offers opportunities for profit from price swings.
For Policymakers: Signals economic uncertainty, financial stress, or speculative bubbles.
For Risk Managers: Enables designing hedging strategies to minimize losses.
Volatility often increases during economic crises, geopolitical tensions, or major policy changes, making its monitoring critical.
1.3 Measuring Market Volatility
Volatility can be measured statistically or derived from market instruments:
Statistical Measures: Standard deviation, variance, beta coefficient.
Implied Volatility: Derived from options pricing models (e.g., Black-Scholes).
Volatility Indices: Like VIX, which reflects the market’s expected future volatility.
Understanding measurement techniques is crucial because they allow investors to quantify uncertainty and price risk more effectively.
2. Types of Market Volatility
Market volatility can be classified into various types based on time horizon, causes, and nature. Understanding these types helps investors and traders adapt strategies to market conditions.
2.1 Historical Volatility
Historical volatility measures past price movements over a specific period.
Calculation: Standard deviation of returns from historical price data.
Use Case: Helps predict future risk based on past trends.
Limitation: Past performance may not always indicate future volatility.
Example: The standard deviation of daily returns of the S&P 500 over the last 30 days.
2.2 Implied Volatility
Implied volatility (IV) is forward-looking, derived from options prices.
Definition: The market’s expectation of the asset’s future volatility.
Calculation: Using options pricing models like Black-Scholes.
Significance: High IV indicates markets expect large price swings, low IV indicates stability.
Example: A sharp increase in VIX reflects high implied volatility for the S&P 500.
2.3 Historical vs. Implied Volatility
Feature Historical Volatility Implied Volatility
Basis Past price data Options prices (future expectation)
Nature Backward-looking Forward-looking
Use in Trading Risk measurement Pricing and hedging
Limitation May not reflect sudden shocks Dependent on market perception
2.4 Market Volatility Based on Frequency
Volatility can also be classified by how often price swings occur:
Short-term Volatility:
Daily or intraday price fluctuations.
Important for day traders and scalpers.
Medium-term Volatility:
Weekly or monthly swings.
Crucial for swing traders and short-term investors.
Long-term Volatility:
Yearly or multi-year fluctuations.
Significant for long-term investors and fund managers.
2.5 Structural Volatility vs. Event-Driven Volatility
Structural Volatility:
Caused by long-term economic, policy, or market structure changes.
Example: Deregulation, introduction of new financial instruments.
Event-Driven Volatility:
Triggered by specific events, usually sudden and short-lived.
Example: Earnings announcements, geopolitical conflicts, central bank rate decisions.
2.6 Sector-Specific vs. Market-Wide Volatility
Sector-Specific Volatility:
Affects specific industries or sectors.
Example: Oil price shocks affecting energy stocks.
Market-Wide Volatility:
Affects the entire market or economy.
Example: Global financial crisis, pandemic-induced market crashes.
2.7 Volatility Based on Price Direction
Symmetric Volatility:
Price swings equally likely upwards or downwards.
Example: Stable markets with balanced buying and selling pressure.
Asymmetric Volatility:
Price swings more pronounced in one direction.
Example: Markets react more sharply to negative news than positive news (leverage effect in stocks).
2.8 Measured vs. Perceived Volatility
Measured Volatility:
Quantitative, calculated using historical price data or standard deviations.
Perceived Volatility:
Psychological perception of risk by investors.
Influenced by media, rumors, and sentiment.
2.9 Other Specialized Types of Volatility
Exchange Rate Volatility:
Fluctuations in currency markets, impacting global trade and investment.
Commodity Price Volatility:
Price swings in commodities like oil, gold, or wheat, often due to supply-demand imbalances.
Interest Rate Volatility:
Fluctuations in bond yields or central bank rates affecting bond markets, equities, and currencies.
Equity Market Volatility:
Swings in stock prices or indices, influenced by earnings, macroeconomics, or speculation.
3. Factors Influencing Market Volatility
Macroeconomic Indicators: GDP growth, inflation, unemployment rates.
Monetary Policies: Central bank interest rate changes, liquidity injections.
Political Events: Elections, geopolitical tensions, trade wars.
Global Shocks: Pandemics, natural disasters, oil crises.
Market Structure: Liquidity, trading volume, leverage, and derivatives use.
Investor Behavior: Herd mentality, fear, greed, and speculative activity.
4. Volatility in Financial Markets
4.1 Equity Markets
Equities often show high volatility due to earnings reports, news, and macroeconomic conditions.
4.2 Bond Markets
Bonds are generally less volatile but sensitive to interest rate changes and credit risk.
4.3 Forex Markets
Currency markets are highly volatile due to global trade, interest rate differentials, and political risk.
4.4 Commodity Markets
Commodity prices fluctuate due to supply-demand imbalances, geopolitical tensions, and speculative trading.
5. Implications of Market Volatility
For Traders: Opportunity for profit through short-term trading strategies.
For Investors: Risk management through diversification and hedging.
For Policymakers: Indicator of financial stability and economic stress.
For Economists: Understanding cycles of boom, bust, and correction.
6. Conclusion
Market volatility is an intrinsic characteristic of financial markets, reflecting the dynamic interplay of economic, political, and behavioral factors. Recognizing its types, measurement methods, and underlying causes enables participants to navigate markets more effectively, optimize risk-adjusted returns, and anticipate potential disruptions.
Volatility, when understood and managed correctly, transforms from a source of fear to a tool for opportunity, making it central to modern finance.
Gold (XAUUSD) – Bullish Momentum | Watching $3,822 Resistance ?Gold is holding strongly above the 1st support zone at $3,799 after a clear change of character (CHOCH).
Buyers defended both the 2nd support and the major support area, confirming bullish control.
If momentum continues, price could retest the resistance zone around $3,822–$3,840.
A pullback toward $3,767 support may provide another entry opportunity for bulls.
Trend bias remains bullish as long as price holds above the major support zone.
👉 Do you see Gold breaking through $3,822 resistance, or will it reject for a deeper pullback? Drop your thoughts in the comments.
