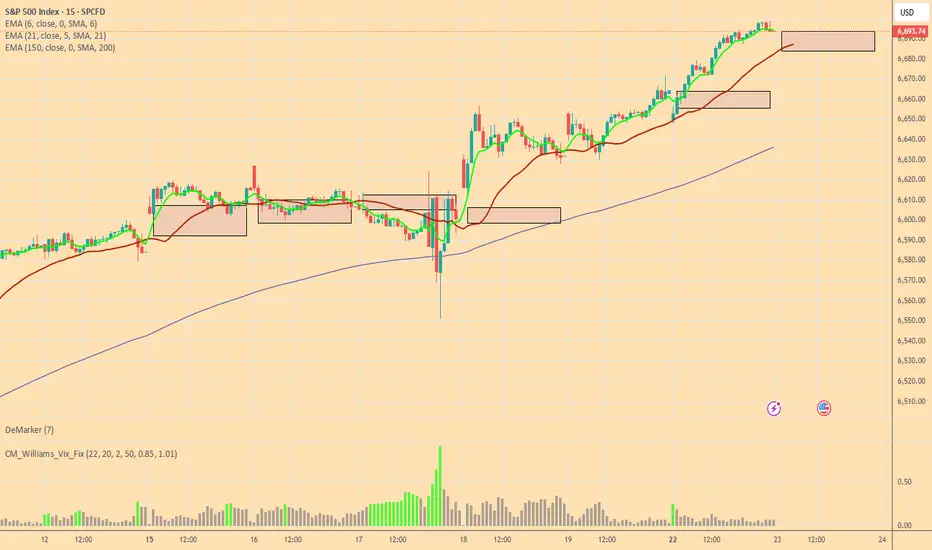
Bulls and Bears zone for 09-23-2025Last two trading sessions Bulls were very active. Hopefully, Bulls will continue the trend and make 3 sessions in a row.
Level to watch : 6752 --- 6750
Trading
Sakar - Go LongTechnically this stock has given a good breakout with an healthy volume however there had been strong selling at 369 level. if it surpasses then we can see also ATH.

EURAUD Sellers In Panic! BUY!
My dear subscribers,
My technical analysis for EURAUD is below:
The price is coiling around a solid key level - 1.7856
Bias - Bullish
Technical Indicators: Pivot Points Low anticipates a potential price reversal.
Super trend shows a clear buy, giving a perfect indicators' convergence.
Goal - 1.7886
My Stop Loss - 1.7834
About Used Indicators:
By the very nature of the supertrend indicator, it offers firm support and resistance levels for traders to enter and exit trades. Additionally, it also provides signals for setting stop losses
Disclosure: I am part of Trade Nation's Influencer program and receive a monthly fee for using their TradingView charts in my analysis.
———————————
WISH YOU ALL LUCK

SILVER Is Bearish! Short!
Take a look at our analysis for SILVER.
Time Frame: 1D
Current Trend: Bearish
Sentiment: Overbought (based on 7-period RSI)
Forecast: Bearish
The market is approaching a key horizontal level 4,427.7.
Considering the today's price action, probabilities will be high to see a movement to 4,214.0.
P.S
The term oversold refers to a condition where an asset has traded lower in price and has the potential for a price bounce.
Overbought refers to market scenarios where the instrument is traded considerably higher than its fair value. Overvaluation is caused by market sentiments when there is positive news.
Like and subscribe and comment my ideas if you enjoy them!

NZDUSD Is Very Bullish! Long!
Please, check our technical outlook for NZDUSD.
Time Frame: 12h
Current Trend: Bullish
Sentiment: Oversold (based on 7-period RSI)
Forecast: Bullish
The market is approaching a significant support area 0.586.
The underlined horizontal cluster clearly indicates a highly probable bullish movement with target 0.596 level.
P.S
We determine oversold/overbought condition with RSI indicator.
When it drops below 30 - the market is considered to be oversold.
When it bounces above 70 - the market is considered to be overbought.
Like and subscribe and comment my ideas if you enjoy them!

AUDUSD Is Going Down! Sell!
Here is our detailed technical review for AUDUSD.
Time Frame: 1D
Current Trend: Bearish
Sentiment: Overbought (based on 7-period RSI)
Forecast: Bearish
The market is on a crucial zone of supply 0.661.
The above-mentioned technicals clearly indicate the dominance of sellers on the market. I recommend shorting the instrument, aiming at 0.648 level.
P.S
Overbought describes a period of time where there has been a significant and consistent upward move in price over a period of time without much pullback.
Like and subscribe and comment my ideas if you enjoy them!

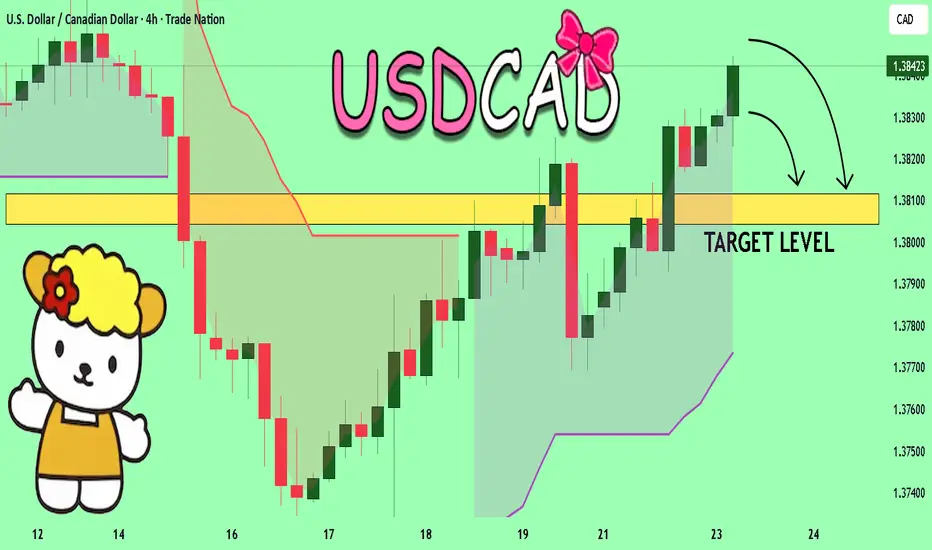
USDCAD Will Fall! Short!
Take a look at our analysis for USDCAD.
Time Frame: 1D
Current Trend: Bearish
Sentiment: Overbought (based on 7-period RSI)
Forecast: Bearish
The price is testing a key resistance 1.382.
Taking into consideration the current market trend & overbought RSI, chances will be high to see a bearish movement to the downside at least to 1.373 level.
P.S
Please, note that an oversold/overbought condition can last for a long time, and therefore being oversold/overbought doesn't mean a price rally will come soon, or at all.
Like and subscribe and comment my ideas if you enjoy them!

USDCHF Is Very Bearish! Short!
Take a look at our analysis for USDCHF.
Time Frame: 1h
Current Trend: Bearish
Sentiment: Overbought (based on 7-period RSI)
Forecast: Bearish
The price is testing a key resistance 0.793.
Taking into consideration the current market trend & overbought RSI, chances will be high to see a bearish movement to the downside at least to 0.791 level.
P.S
Please, note that an oversold/overbought condition can last for a long time, and therefore being oversold/overbought doesn't mean a price rally will come soon, or at all.
Like and subscribe and comment my ideas if you enjoy them!

EURUSD Will Go Lower From Resistance! Sell!
Please, check our technical outlook for EURUSD.
Time Frame: 1h
Current Trend: Bearish
Sentiment: Overbought (based on 7-period RSI)
Forecast: Bearish
The market is trading around a solid horizontal structure 1.185.
The above observations make me that the market will inevitably achieve 1.181 level.
P.S
Overbought describes a period of time where there has been a significant and consistent upward move in price over a period of time without much pullback.
Like and subscribe and comment my ideas if you enjoy them!

NZD/CHF BEARISH BIAS RIGHT NOW| SHORT
NZD/CHF SIGNAL
Trade Direction: short
Entry Level: 0.466
Target Level: 0.464
Stop Loss: 0.468
RISK PROFILE
Risk level: medium
Suggested risk: 1%
Timeframe: 1h
Disclosure: I am part of Trade Nation's Influencer program and receive a monthly fee for using their TradingView charts in my analysis.
✅LIKE AND COMMENT MY IDEAS✅

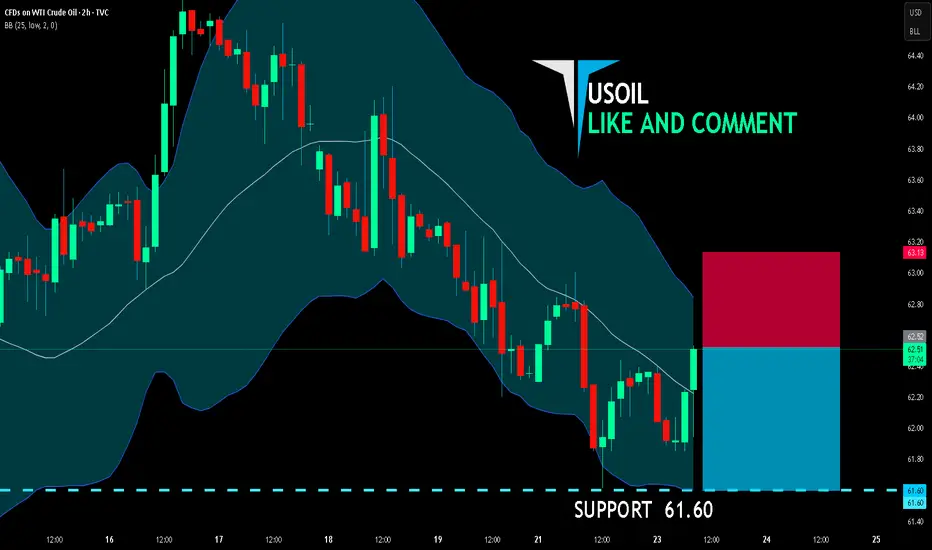
USOIL SHORT FROM RESISTANCE
USOIL SIGNAL
Trade Direction: short
Entry Level: 62.52
Target Level: 61.60
Stop Loss: 63.13
RISK PROFILE
Risk level: medium
Suggested risk: 1%
Timeframe: 2h
Disclosure: I am part of Trade Nation's Influencer program and receive a monthly fee for using their TradingView charts in my analysis.
✅LIKE AND COMMENT MY IDEAS✅
AUD/USD BEARS WILL DOMINATE THE MARKET|SHORT
AUD/USD SIGNAL
Trade Direction: short
Entry Level: 0.660
Target Level: 0.657
Stop Loss: 0.661
RISK PROFILE
Risk level: medium
Suggested risk: 1%
Timeframe: 1h
Disclosure: I am part of Trade Nation's Influencer program and receive a monthly fee for using their TradingView charts in my analysis.
✅LIKE AND COMMENT MY IDEAS✅

USDCAD Fall Expected! SELL!
My dear subscribers,
This is my opinion on the USDCAD next move:
The instrument tests an important psychological level 1.3841
Bias - Bearish
Technical Indicators: Supper Trend gives a precise Bearish signal, while Pivot Point HL predicts price changes and potential reversals in the market.
Target - 1.3811
About Used Indicators:
On the subsequent day, trading above the pivot point is thought to indicate ongoing bullish sentiment, while trading below the pivot point indicates bearish sentiment.
Disclosure: I am part of Trade Nation's Influencer program and receive a monthly fee for using their TradingView charts in my analysis.
———————————
WISH YOU ALL LUCK
GOLD Trading Opportunity! SELL!
My dear followers,
I analysed this chart on GOLD and concluded the following:
The market is trading on 3754.1 pivot level.
Bias - Bearish
Technical Indicators: Both Super Trend & Pivot HL indicate a highly probable Bearish continuation.
Target - 3743.6
Safe Stop Loss - 3760.9
About Used Indicators:
A super-trend indicator is plotted on either above or below the closing price to signal a buy or sell. The indicator changes color, based on whether or not you should be buying. If the super-trend indicator moves below the closing price, the indicator turns green, and it signals an entry point or points to buy.
Disclosure: I am part of Trade Nation's Influencer program and receive a monthly fee for using their TradingView charts in my analysis.
———————————
WISH YOU ALL LUCK

BTC low time frame entering LONG📊 Market update
BTC started at 112.9K with a green uptrend on the lower time frame, suitable for scalp trading. For confirmation of the main trend, BTC should target 114.5K to enter a new uptrend.
⏱️ About altcoins
OG/USDT and JOE/USDT are showing some trend volume.

#027: LONG GBP/USD Investment Opportunity
I have chosen to go LONG on this pair. The recent bearish movement has unloaded much of the excess, and the price is now showing clear signs of accumulation in key areas. Hello, I'm Forex Trader Andrea Russo, an independent trader and prop trader with $200,000 in capital under management. Thank you in advance for your time.
Price action has respected important structural levels, with a clear reaction after testing dynamic support.
Volumes indicate an absorption phase, typical of institutional preparatory moves.
Relative strength is starting to turn in our favor, while retail data shows the majority leaning in the opposite direction: exactly the situation I'm looking for to position myself against the retail market.
The cyclical trend suggests the end of the corrective leg and the start of a new directional momentum.
The plan therefore remains bullish: I follow the institutional flow, with the idea that the next expansionary movement could develop in continuity with the dominant structure.

XAUUSD 30M – Intraday Plan Around the RangePrice is consolidating between $3,758.55 (resistance / buy trigger) and $3,735.09 (support / sell trigger). Current price is around $3,756–$3,757, sitting just below resistance. Breakout confirmation is key.
🔼 Bullish Plan (needs confirmation)
Trigger: 30-min body close above $3,758.55.
Targets: $3,765.10 → $3,769.74 → $3,772.50.
Management: Take partials at $3,765.10, move SL to breakeven once $3,759 is cleared, trail remainder if momentum extends.
🌍 Fundamental Note
October rate cut pricing can still keep gold supported at these higher levels. A sustained bullish push likely needs either a surprise dovish shift or further DXY weakness. If the dollar pivots back into its weekly bullish structure, gold’s upside could be capped.
🔽 Bearish Plan (clean if floor breaks)
Trigger: 30-min body close below $3,735.09.
Targets: $3,732.50 → $3,731.38 → $3,729.19 → $3,727.30.
Management: Scale partials at $3,732.50, protect remaining position at breakeven. Trail if sellers stay in control.
🔄 Range Scalp (higher risk — small size)
Shorts: rejection near $3,758 → aim $3,748–$3,750, SL above rejection high.
Longs: bounce near $3,735–$3,736 → aim mid-range ($3,745–$3,747), SL under lows.
✅ Break Confirmation
Strong 30-min close through the level.
Momentum expansion after breakout.
❌ Invalidation
Breakout candle closes back inside range on the next bar (trap).
Multiple wicks with no continuation.
📌 Bottom Line
Above $3,758.55 → bullish bias toward $3,772.50.
Below $3,735.09 → bearish bias toward $3,727.30.
Inside the box = scalp only, keep risk tight.

Best Way of Trade in Global Market1. Introduction to Global Market Trading
The global market is a vast network where nations, corporations, and individuals engage in the exchange of goods, services, and financial assets. It connects continents through trade flows, currency exchanges, stock markets, and commodities. In today’s era of globalization, no economy functions in isolation—an event in one corner of the world can ripple across markets everywhere.
Trading in the global market is not just about buying low and selling high. It is about understanding global dynamics, currencies, interest rates, political shifts, technological innovation, and cultural differences. The best way to trade in the global market is by adopting a strategic, informed, and risk-managed approach.
2. Why Trade in the Global Market?
Trading globally offers opportunities that local markets may not provide.
Diversification of Risk – By spreading investments across countries and asset classes, traders reduce dependence on a single economy.
Access to Growth Markets – Emerging economies like India, Brazil, and Vietnam are growing faster than developed economies, offering higher returns.
Currency Benefits – Forex markets allow traders to profit from exchange rate fluctuations.
Global Innovation Exposure – Investing globally provides access to new technologies, industries, and consumption trends.
Hedging Against Inflation – Commodities like gold, oil, and agricultural products offer protection against inflationary pressures.
Trading in the global market is both an opportunity and a responsibility, requiring awareness of risks and market structures.
3. Types of Global Market Trading
To find the best way to trade globally, one must first understand the different types of trading:
Stock Market Trading (Equities) – Buying and selling shares of global companies listed on exchanges like NYSE, NASDAQ, LSE, or NSE.
Forex Trading (Currencies) – The world’s largest market, where currencies like USD, EUR, JPY, and INR are traded 24/7.
Commodity Trading – Trading in gold, silver, crude oil, natural gas, coffee, wheat, and other resources.
Bond & Debt Market Trading – International investors trade government or corporate bonds for safer, fixed-income returns.
Derivatives Trading – Futures, options, swaps, and other contracts used for speculation or hedging.
Crypto & Digital Assets – Trading Bitcoin, Ethereum, and other digital currencies gaining global recognition.
Cross-Border Trade in Goods & Services – Physical movement of goods like electronics, automobiles, and textiles between nations.
Each type requires different skills, risk tolerance, and strategies.
4. Key Instruments in Global Trading
Stocks/Equities – Represent ownership in a company.
ETFs (Exchange-Traded Funds) – Allow access to a basket of global assets.
Futures Contracts – Agreements to buy/sell assets at a future date.
Options – Provide flexibility with rights (not obligations) to trade assets.
Currencies (Forex) – Driven by macroeconomic and geopolitical factors.
Commodities – Gold, crude, and agricultural goods as safe havens or growth bets.
Bonds – Government & corporate debt for stability.
Understanding which instruments fit your financial goals is crucial to finding the best global trading method.
5. Factors Influencing Global Trade & Markets
Economic Indicators – GDP growth, inflation, unemployment, interest rates.
Central Bank Policies – The US Federal Reserve, ECB, RBI, and BOJ decisions.
Geopolitical Events – Wars, sanctions, trade agreements.
Technology & Innovation – AI, fintech, e-commerce growth.
Natural Resources & Climate Change – Affect commodity supply and pricing.
Global Connectivity – Internet penetration, financial access, blockchain.
The best traders carefully study these factors to anticipate market shifts.
6. Best Ways / Strategies to Trade Globally
Here comes the most important part—the actual best practices for trading in global markets.
A. Fundamental Strategies
Study macroeconomics: inflation, interest rates, and trade balances.
Track earnings reports of multinational corporations.
Monitor commodity demand-supply balance.
Analyze political stability and trade agreements.
B. Technical Strategies
Use charting tools: candlesticks, moving averages, RSI, MACD.
Identify global price patterns and volume spikes.
Apply volume profile & market structure analysis for stronger entries/exits.
C. Risk Management
Always set stop-loss levels.
Use position sizing (never invest more than 1–2% of capital per trade).
Diversify across regions and asset classes.
Hedge with safe assets like gold or USD when markets are volatile.
D. Long-Term vs Short-Term Approaches
Long-Term Global Investing: Buy quality global stocks, ETFs, or bonds for steady growth.
Short-Term Global Trading: Focus on forex, futures, and options for quick profits with higher risks.
E. Leverage Technology
Use AI-powered trading platforms.
Apply algorithmic trading for efficiency.
Stay updated with real-time news feeds & data analytics.
7. Role of Technology, AI & Global Connectivity
Algorithmic Trading – High-frequency strategies based on programmed rules.
AI in Market Prediction – Predicting price movements using big data.
Blockchain & Crypto – Decentralized finance reshaping cross-border trade.
E-commerce Expansion – Global platforms like Amazon, Alibaba influencing logistics & currencies.
The future best way of trading globally will increasingly depend on data-driven decision-making.
8. Challenges in Global Trading
Currency Volatility – Fluctuating exchange rates affect profits.
Geopolitical Risks – Wars, trade wars, sanctions.
Regulatory Differences – Each country has unique tax, compliance, and trading rules.
Information Overload – Too much data can confuse decision-making.
High Competition – Global traders compete with hedge funds, institutions, and algorithms.
Understanding and preparing for these challenges is vital.
9. Practical Steps for Beginners to Start Global Trading
Education First – Learn basics of forex, stocks, commodities.
Choose a Reliable Broker – Ensure global access, regulation, and low fees.
Start Small – Begin with ETFs or paper trading before direct forex/derivatives.
Follow Global News Daily – Understand how events affect markets.
Practice Risk Management – Never trade emotionally.
Build a Global Portfolio – Mix equities, bonds, forex, and commodities.
10. Future Outlook of Global Market Trading
Digital Currencies & CBDCs will make cross-border trade faster.
AI-Powered Trading Bots will dominate short-term strategies.
Emerging Markets will drive growth opportunities.
Sustainable Trading (green energy, ESG assets) will attract capital.
Decentralized Finance (DeFi) will reduce dependency on traditional banks.
The future best way of trading globally will be a hybrid of human intelligence + AI-driven systems + sustainable investments.
11. Conclusion
The best way of trading in the global market is not a single fixed formula—it is a dynamic process combining education, analysis, technology, and discipline. Traders must blend fundamental understanding with technical tools, ensure risk management, and use AI-driven strategies to remain competitive.
Global trade is expanding rapidly, and with the right approach, even small traders can participate meaningfully in the world’s biggest financial opportunities.
In essence, the best way to trade in the global market is to stay informed, diversified, disciplined, and adaptive—while leveraging both technology and human judgment.

Exchange Rate Volatility vs. Stability in World MarketsThe Concept of Exchange Rates
An exchange rate is the value of one currency expressed in terms of another. For example, if 1 U.S. dollar (USD) equals 83 Indian rupees (INR), the USD/INR rate is 83.
Types of Exchange Rate Systems
Fixed exchange rate: A currency is pegged to another (e.g., USD pegged to gold under Bretton Woods, or the Hong Kong dollar pegged to USD).
Floating exchange rate: The currency value is determined by supply and demand in forex markets (e.g., USD, EUR, JPY).
Managed float: A hybrid where central banks intervene occasionally to reduce extreme volatility (e.g., India, China).
The choice of system heavily influences whether a country experiences volatility or stability.
Exchange Rate Volatility vs. Stability
Volatility: Large, unpredictable swings in currency values over short periods. For instance, if the British pound moves from 1.20 to 1.30 per USD in a few weeks, that’s volatile.
Stability: Predictable, small movements over time, often maintained by policy interventions. For instance, the Saudi riyal’s peg to USD has kept it stable for decades.
In reality, most currencies lie on a spectrum between volatility and stability. The degree depends on economic fundamentals, policy frameworks, and global conditions.
Historical Examples
The 1997 Asian Financial Crisis: Currencies in Thailand, Indonesia, and South Korea collapsed when investors lost confidence, highlighting dangers of volatility.
The Eurozone Stability (1999–present): By adopting the euro, member countries reduced volatility among themselves but transferred adjustment risks to a shared monetary system.
Swiss Franc Shock (2015): When Switzerland abandoned its euro peg, the franc surged 30% in one day — a classic case of sudden volatility.
Turkey (2018–2023): Chronic inflation and unorthodox policies created extreme lira volatility, scaring off investors.
Causes of Exchange Rate Volatility
Macroeconomic fundamentals: Inflation, growth, interest rate differentials.
Monetary policy shifts: Central bank rate hikes or cuts often move currencies sharply.
Trade balances: Deficits can weaken a currency, surpluses strengthen it.
Political instability: Elections, wars, sanctions, and coups cause sudden volatility.
Speculation and capital flows: Hedge funds and carry trades can amplify swings.
Global shocks: Oil crises, pandemics, or financial collapses ripple across forex markets.
Benefits of Exchange Rate Volatility
While volatility often carries risks, it is not purely negative.
Efficient price discovery: Volatility reflects real-time changes in fundamentals.
Flexibility for adjustment: Floating currencies can adjust to shocks (e.g., absorbing oil price increases).
Profit opportunities: Traders and investors benefit from arbitrage and hedging strategies.
Encourages discipline: Countries with poor policies face currency depreciation, which pressures reforms.
Risks of Exchange Rate Volatility
Trade uncertainty: Exporters/importers cannot predict costs, discouraging trade.
Investment risk: Foreign investors fear sudden losses due to currency depreciation.
Debt crises: If debt is in foreign currency, volatility can raise repayment costs dramatically.
Inflation pass-through: A falling currency makes imports expensive, fueling inflation.
Financial instability: Volatility can spark capital flight and banking crises.
Benefits of Exchange Rate Stability
Predictability for trade and investment: Businesses can plan long-term without worrying about currency swings.
Investor confidence: Stable currencies attract foreign direct investment.
Monetary discipline: Pegs force countries to align policies with anchor currencies.
Inflation control: Pegging to a stable currency helps control domestic inflation.
Risks of Exchange Rate Stability
Loss of flexibility: Pegged systems cannot adjust to shocks, leading to painful crises.
Speculative attacks: Maintaining stability invites hedge funds to test central banks (e.g., George Soros vs. Bank of England, 1992).
Hidden imbalances: Stability can hide structural weaknesses until they break suddenly.
Dependence on reserves: Countries need large forex reserves to maintain stability, which is costly.
Role of Central Banks and International Institutions
Central banks:
Use interest rates, interventions, and forward contracts to reduce volatility.
Sometimes allow controlled depreciation to maintain competitiveness.
IMF:
Provides emergency funding for countries in currency crises.
Promotes exchange rate stability through surveillance and policy advice.
Regional systems:
The euro stabilizes intra-European rates.
Asian countries hold large reserves to self-insure against volatility after the 1997 crisis.
Impact on Global Trade and Investment
Volatility reduces global trade by 5–10%, according to empirical studies, as exporters face uncertainty.
Stable currencies encourage long-term contracts, supply chains, and cross-border investment.
Multinationals hedge volatility through derivatives, but small firms often cannot, making stability more valuable for them.
Exchange rate regimes influence foreign direct investment: investors prefer predictable environments.
Current Trends (2025 Context)
U.S. dollar dominance: Despite de-dollarization talk, USD remains the anchor of global stability.
Rising multipolarity: Yuan, euro, and rupee are gradually gaining share, creating more currency blocs.
Geopolitical volatility: Wars, sanctions, and U.S.–China rivalry add new shocks.
Digital currencies & CBDCs: These may reduce transaction costs and volatility in cross-border trade.
AI & algorithms: Automated trading amplifies short-term volatility, but also deepens liquidity.
Climate and commodity shocks: Energy transitions and climate risks drive new volatility patterns.
Conclusion
Exchange rate volatility and stability are two sides of the same coin in world markets. Volatility provides flexibility and adjustment, while stability creates predictability and confidence. Neither extreme is ideal: too much volatility destroys trust, while too much artificial stability builds unsustainable pressures.
The challenge for policymakers, businesses, and investors is to manage this delicate balance. Central banks must allow enough flexibility for currencies to reflect fundamentals, while cushioning extreme shocks. International institutions must provide backstops against crises. Businesses must hedge risks, and investors must recognize the trade-offs.
As the world moves toward a more multipolar currency system, with digital innovations and geopolitical uncertainty reshaping forex dynamics, the question of volatility vs. stability will remain central. The future of trade, growth, and global financial stability depends on getting this balance right.
Climate Change as a Global Trade Disruptor1. Climate Change and Global Trade: The Interconnection
Trade depends on geography, climate, and natural resources. Historically, favorable weather and fertile lands enabled agricultural exports, while stable oceans and rivers facilitated shipping routes. Climate change disrupts all three:
Geography: Rising sea levels threaten coastal cities and ports, where nearly 90% of international trade passes through.
Climate: Heatwaves, floods, and droughts directly impact agricultural yields and energy production.
Natural Resources: Water scarcity and declining biodiversity affect commodity supply.
In short, climate change doesn’t just affect the environment—it directly alters the conditions of trade.
2. Extreme Weather Events and Supply Chain Disruptions
One of the most immediate trade-related consequences of climate change is the increase in extreme weather events. Hurricanes, cyclones, floods, and wildfires damage factories, ports, and transport infrastructure.
Hurricane Katrina (2005): Shut down Gulf Coast oil refineries, sending global oil prices soaring.
Thailand floods (2011): Disrupted automotive and electronics supply chains worldwide.
Australia’s bushfires (2019–2020): Reduced coal exports and disrupted agriculture.
Today’s supply chains are highly interdependent and globalized. A single event in one country can delay production worldwide. For example, flooding in Vietnam affects garment exports to Europe, while droughts in Brazil push up global coffee prices.
Climate-induced supply chain shocks are becoming the new normal. This creates price volatility, inflationary pressures, and higher insurance premiums for shipping and logistics.
3. Agriculture and Food Security in Global Trade
Agriculture is one of the most climate-sensitive sectors and a cornerstone of global trade. Crops like wheat, rice, coffee, and cocoa rely on predictable weather patterns. Climate change threatens this balance in multiple ways:
Droughts in Africa: Reduce maize and sorghum yields, raising import dependency.
Heat stress in India: Threatens rice and wheat production, impacting global food markets.
Coffee production in Brazil & Vietnam: Faces declining suitable land due to rising temperatures.
Food security becomes a trade issue when nations impose export bans to protect domestic supply. During the 2008 food crisis, countries like India and Vietnam restricted rice exports, causing prices to spike globally. Similar patterns may repeat more frequently as climate shocks worsen.
This also affects agribusiness trade patterns. Countries that can adapt (through irrigation, genetic crop engineering, or technology) may dominate future food exports, while vulnerable regions face dependency and trade deficits.
4. Maritime Trade and the Impact on Shipping
Around 80–90% of global trade moves by sea. Climate change is disrupting this backbone in several ways:
Rising Sea Levels: Ports in Bangladesh, Miami, Rotterdam, and Shanghai face flooding risks.
Hurricanes & Cyclones: More frequent storms damage ships and delay cargo.
Melting Arctic Ice: While it opens new shipping routes (e.g., Northern Sea Route), it also creates geopolitical tensions and environmental hazards.
Shallow Water Levels: Droughts in rivers like the Rhine (Europe) and Mississippi (U.S.) reduce shipping capacity.
Insurance and shipping costs rise as companies face unpredictable risks. In turn, these higher costs filter down to consumers through inflation in global trade prices.
5. Energy Trade and Transition
Energy is the engine of trade, but climate change is reshaping both supply and demand.
Fossil Fuel Disruption:
Rising storms affect offshore oil rigs.
Droughts limit water needed for cooling in coal and nuclear plants.
Heatwaves reduce energy efficiency in transportation.
Green Energy Transition:
Demand shifts toward renewable energy technologies (solar panels, wind turbines, EV batteries).
Countries rich in critical minerals (lithium, cobalt, rare earths) gain new trade power.
Nations dependent on fossil fuel exports (like Gulf countries) face future trade risks.
Energy trade is entering a transitional phase, with climate change accelerating the shift toward renewables while simultaneously destabilizing fossil fuel-dependent economies.
6. Climate-Induced Migration and Labor Disruptions
Climate change displaces millions of people due to floods, droughts, and rising seas. According to the World Bank, by 2050, over 200 million people may become climate migrants.
This has direct trade implications:
Labor shortages in agriculture and manufacturing.
Shifting consumer bases as populations relocate.
Trade tensions between host and origin countries.
For example, migration from Central America to the U.S. is partly driven by droughts destroying crops. This alters not just migration policies but also regional trade agreements.
7. Geopolitical Tensions and Trade Wars Linked to Climate
Climate change also fuels geopolitical trade disruptions. Nations with scarce resources (water, arable land, minerals) may restrict exports or engage in conflicts.
Water wars: Between India and Pakistan, or Egypt and Ethiopia, may affect food and trade flows.
Carbon tariffs: The EU’s Carbon Border Adjustment Mechanism (CBAM) imposes costs on imports from high-emission industries, creating new trade barriers.
Resource nationalism: Countries with critical minerals (like Chile for lithium, Congo for cobalt) may restrict exports for domestic benefit, disrupting global supply chains.
Climate change is not just an environmental issue—it’s a geo-economic disruptor reshaping trade alliances and policies.
8. Financial Risks and Trade Insurance
Trade finance and insurance are also feeling the impact:
Rising premiums for ships navigating storm-prone routes.
Higher borrowing costs for exporters in climate-vulnerable regions.
Credit risk as companies in flood-prone areas default on loans.
International banks and insurers are now pricing climate risk into trade deals. This makes it more expensive for vulnerable developing countries to participate in global trade.
9. Adaptation Strategies: Business and Government Responses
Despite the risks, nations and corporations are adapting strategies to reduce disruptions:
Diversification of Supply Chains: Companies are sourcing from multiple regions to reduce climate risks.
Resilient Infrastructure: Investments in flood-resistant ports, smart logistics, and renewable energy.
Trade Policy Reforms: WTO and regional trade blocs are incorporating climate clauses into agreements.
Technological Innovations: AI, blockchain, and IoT for supply chain visibility and risk prediction.
Sustainable Shipping: Investments in low-carbon fuels and energy-efficient vessels.
Adaptation is no longer optional—it is becoming central to trade competitiveness.
10. Future Outlook: Trade in a Climate-Disrupted World
Looking ahead, climate change will continue to reshape trade in profound ways:
Winners and Losers: Climate-resilient nations (Nordics, Canada) may gain trade advantages, while vulnerable regions (South Asia, Sub-Saharan Africa) face disruptions.
Regionalization: To reduce risk, companies may shorten supply chains and rely more on regional trade than global trade.
Climate-Linked Trade Agreements: Carbon border taxes and environmental standards will redefine competitiveness.
Innovation-Driven Trade: Renewable energy technologies, carbon-capture products, and climate-adaptation tools will dominate exports.
In short, climate change will not stop trade, but it will transform it.
Conclusion
Climate change is one of the greatest disruptors global trade has ever faced. Unlike temporary crises—such as financial crashes or pandemics—it is a long-term, structural challenge. It reshapes production, transportation, labor, and even the rules of trade itself. From floods that halt factory production to tariffs on carbon-heavy imports, climate risks ripple through every link of the global supply chain.
The future of trade depends on how quickly nations, businesses, and institutions adapt. Those who build resilience, embrace sustainability, and innovate will thrive. Those who delay will face escalating costs, shrinking markets, and geopolitical vulnerabilities.
Ultimately, climate change is not just an environmental problem—it is a trade problem, an economic problem, and a global governance problem. Recognizing it as a trade disruptor is the first step toward building a system that can withstand its impact.
STEVEN XAUUSD – Buy Scenario Following the TrendTechnical Analysis
Gold continues to maintain a strong upward trend after breaking out of the previous accumulation zone. Currently, the price has tested the 3,742–3,744 area and is showing signs of pausing for a short-term correction.
The EMA200 H1 (3,662) is still sloping upwards, confirming that the main upward trend remains intact.
Fibonacci Retracement for the most recent rise:
The 0.786 level (3,738) coincides with the Volume Profile area – this is the first support for a short-term buy scenario.
The 0.618 level (3,707) aligns with the old resistance now turned support – a strong confluence, suitable for finding the main Buy point.
The RSI (14) is around 63–65, not yet in the overbought zone, indicating there is still room for growth.
Trading Scenario
Prioritize Buy following the trend
Entry 1: 3,738–3,740
SL: 3,730
TP: 3,750 – 3,760
Entry 2: 3,707–3,710
SL: 3,695
TP: 3,738 – 3,760 – 3,780
Price Levels to Watch
3,742–3,744: short-term resistance, may cause adjustments.
3,738–3,740: nearby support, suitable for quick Buy.
3,707–3,710: strong support, important Buy zone.
3,780–3,785: extended resistance, target of the upward trend.
This is a reference scenario, not an investment recommendation. Stay tuned for earlier analyses and scenarios in upcoming sessions.

GBPNZD: Trend ContinuationMomentum is picking again on the GBPNZD pair. Here are my observations on the daily and H1 timeframes.
Daily Timeframe:
HTL marks a resistance turned support
Price is also exiting the EMA areas, which is an indication of momentum
H1 Timeframe:
Price shows momentum as it crossed above the DTL
Price shows confluence with higher timeframe trend as it holds above EMA20
Uptrend is signaled by EMA20 remaining above EMA60

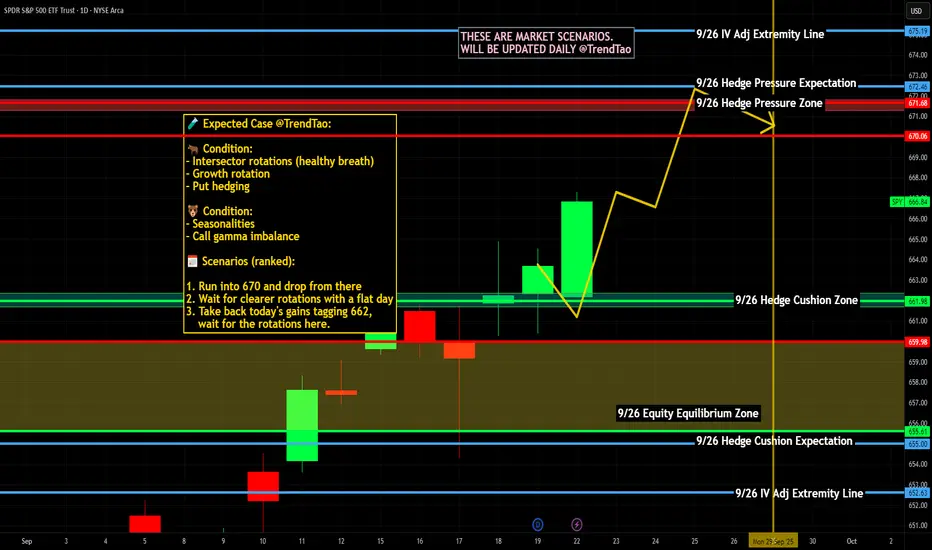
$SPY / $SPX Scenarios — Tuesday, Sept 23, 2025 🔮 AMEX:SPY / SP:SPX Scenarios — Tuesday, Sept 23, 2025 🔮
🌍 Market-Moving Headlines
📉 Post-Fed digestion: Equities and bonds still recalibrating after last week’s SEP + Powell tone.
💻 Mega-cap watch: Tech + AI flows continue to drive AMEX:XLK sentiment.
🌐 Central bank chatter: A busy Fed speaker slate gives extra volatility into month-end.
📊 Key Data & Events (ET)
⏰ 9:00 AM — Fed Vice Chair for Supervision Michelle Bowman speech
⏰ 🚩 9:45 AM — S&P Global Flash PMIs (Sep) — Services & Manufacturing
⏰ 10:00 AM — Atlanta Fed President Raphael Bostic speech
⏰ 🚩 12:35 PM — Fed Chair Jerome Powell speech
⚠️ Disclaimer: Educational/informational only — not financial advice.
📌 #trading #stockmarket #SPY #SPX #Powell #Fed #PMI #economy #Dollar #bonds #megacaps