New York Open as the Decision PointI remain fundamentally bullish equities, even with the current geopolitical noise.
The sharp downside impulse came late last week and into the first trading day of the year, when liquidity and positioning can be distorted. I’m treating that move as context, not trend confirmation.
After New York Open, the highlighted green area becomes the decision point.
• If that area holds after NY, I’ll look for continuation higher toward the prior SR flip and higher-timeframe resistance.
• If that area fails, I stay patient and allow price to work lower, with next meaningful support near 25,275.
Location provides context. Execution only follows confirmation.
Tradingplans

Developing A Trading Philosophy: Experimenting With IndicatorsIn our last video we were talking about the concept of the causes and effect on price action. What causes price to move in a certain direction vs. what the effects of the price action.
We came to the conclusion, that indicators are not causes of price action, but they are a different way of looking at the price. Therefore, price action dictates what happens to the indicator.
On the other hand things like market structure elements, supply and demand areas, order block, order flows, imbalances (Fair Value Gaps), etc.. are examples of price action causes.
In this video we are showing our experiment on using a playbook that depends totally on indicators which are, as we said, price action effects, not causes.
The experiment was positive. The annual return was crazy. Crazy when we think of it in terms of investment. This video shows a total annual return of more than 54%. I am not sure what business brings such net returns.
Still we need to look at some of the hidden teachings within this experiment. This such as the necessity of a static stop loss vs. a stop loss based change of story.
Another concept that came out of this experiment which is the difference in returns with higher timeframes over lower timeframes. The weekly time frame brought in around 40% of the total 54%, while daily was responsible for only 14% of those returns.
Next week we will be moving this experiment to a Demo Account. Last week the experiment was made using the "Replay" feature in TradingView with the period between 1st of Jan 2025 and end of 2025. Additionally, we will be experimenting on "Replay" adding market structure and SMC elements to the play book and see the effect on the total performance.
Those experiments are vey useful to me to arrive at developing my trading philosophy and my general trading strategy. It will definitely play a big role in facilitating the development of an exact playbook. I hope that as much as what I am doing is beneficial to me, it is also beneficial to the trading community.
The Investor

Price Action in Forex Trading: Understanding Cause and EffectIn this video I revisit the idea of the importance of developing a trading philosophy, but with a closer look at one of the elements that I mentioned in the previous video talking about trading philosophy; namely, understanding cause and effect in price action in Forex trading.
To enable me arrive at a philosophy related to cause and effect in price action, I need to understand these elements. Therefore, I am running a test in which I designed a playbook that includes only indicators, and I want to see the performance of such a playbook.
The first phase of the this test will be conducted using the Replay feature in TradingView which to me is some sort of backtesting. If this playbook proves to be working, then I will moving the second phase of the test, which is trying the playbook on a Demo account with live prices.
Within phase two, I will also be going back to backtest adding some other elements from market structure and SMC to see what effects will this have on the performance. This way I would have used both sides; Cause factors: Market structure and SMC elements, and Effect Factors: Stochastic, RSI and Moving averages.
I am putting a tentative date to arrive at a final conclusion by the end of March.
The Investor

BTCUSDT — Intraday Short Continuation | Range Pressure RemainsContext
Following the previous short execution from the seller’s zone 88,600 – 88,200, price delivered a clean downside move and reacted from 86,400.
However, despite this reaction, there is no clear evidence of sustained buyer strength at the moment.
Expectation
Within the current intraday structure, continuation toward the 86,000 area remains a valid and logical scenario.
Price is still trading under prior supply, and upside acceptance has not been established.
Risk Management
This is a continuation idea, not a late entry chase.
Risk should be reduced relative to standard position sizing and execution considered only with confirmation.
Invalidation
The intraday short bias will be invalidated only in the case of an aggressive move and firm acceptance above 88,600.

XAUUSD: Gold Smashes $4,500! New Era or Blow-off Top?Hello traders! Looking at the higher timeframes, Gold's structural bull market is accelerating. We’ve seen a series of higher highs and higher lows within a well-defined ascending channel.
The Narrative:
Fundamental: Safe-haven demand is peaking due to the US-Venezuela naval blockade and ongoing global uncertainty.
Volume: We are seeing "Smart Money" absorption at the highs. Note the lack of aggressive rejection at the $4,500 handle.
Invalidation: A daily close below $4,380 would shift the bias back to neutral/bearish.
Key Levels:
Zone of Interest: $4,490 - $4,510
Profit Targets: $4,550 / $4,580
Stop Loss: Below the recent swing low ($4,440).
Hit the "Like" button if you find this breakdown helpful! It helps the community grow. risk manag

A Step Back For Developing My Trading PhilosophyI am now halting or my activities to develop a trading plan, and going back to the drawing board not to build a new trading plan, but for developing my trading philosophy.
I know that any business needs to establish itself based on a philosophy. When I got into trading, I totally forgot about that and started my journey concentrating on learning the different trading schools, technical analysis and technical indicators...etc.
This is the beauty of hitting a wall. It makes the mind ask questions and search for better ways. Success does not do that. Success makes us keep moving forward without even a glimpse on the basics of things. Only when things do not work, we go back to see how we can do it right, and by doing so, we are forced to back to the basics and forced to enforce the foundations of whatever we intend to build.
The past weeks were a roller-coaster, were a trading plan works beautifully, then it collapses on me. This made me try to find answers, but thankfully this time, I didn't go to try to learn about a different trading school or a different tools to design a better trading plan, but rather, made me go back to the foundations and ask myself about my trading philosophy.
I came up with two areas of focus; Understanding price cause and effect, and understanding the dynamics of the asset that I am trading. I deleted all the 28 tabs of the 28 currency pairs, and now I am going to educate myself about one pair only.
I am going to use the "Replay Feature" on TradingView, and will go back to the beginning of the year 2025, and start building up my charts to understand only this pair, and what I would want to understand is what affects the price to move.

Traders Who Follow Their Plan 90% the Time Look VERY DifferentBehind the scenes with prop traders, something interesting showed up in the numbers.
Nothing changed in their strategy. Same setups. Same market.
What changed was this:
-Plan adherence went from about 50% of trades to around 90%
-Rule breaks dropped by about 70%
-Account survival jumped roughly 40% (they stayed funded much longer)
In other words, they didn’t “find a better edge.”
They just actually followed the plan they already had most of the time.
This is why so many traders feel stuck: they keep searching for a new strategy, when the real leak is not doing what they said they would do.
Be honest with yourself for a second:
If you look at your last 20 trades… how many were truly from your plan, and how many were “I’ll just try this”?
Drop your honest guess below as a % (for example: “40% plan / 60% random”).
No judgment, just curious how people see themselves vs what the data usually shows.
Trade Smarter Live Better / Mindbloome Exchange

Mistakes I am Making In Implementing My Own Forex Trading PlanI know that we all want to see material of Forex Trading plans that actually work and bring in profit. We don't want to waste our time with what doesn't work.
Still, in this video I am talking about my lack of discipline in applying my own Forex trading plan which made me lose focus and get into a losing streak.
My Win/Loss ratio is still better, my balance is still above its initial amount, but to me all that is not important. Many people are result oriented, I am not. I am process oriented.
I need to trust my process. If I think that I have a solid Forex trading plan then I should follow it. If I am making changing to it then the plan needs changing.
My next steps are as follows:
1) Stop trading the Demo account and use the Replay Feature of TradingView to get more experience in implementing my own plan. With this action point, I will also discover if the current plan is profitable or if it needs changes.
2) Back to Education: I found a new Forex Educational Resource that I want to check out, and see if there is anything of that value there. This resource seems to be going deeper into SMC and teaches advanced areas to better understand liquidity.
I hope this video is helpful and a good reminder of the importance of discipline in Forex trading.

HOW TO TRADE FUNDAMENTALS: A simple 3 point plan When I first started trading, I went heavily down the technical indicator route (as I imagine most people do). RSI, SLOW STOCHASTIC, BOLLINGER BANDS, MACD, FIBONACCI. ICHIMOKU CLOUD. Devising strategies, testing, back testing, and for periods of time they all worked. But, over a long period of time my account was stuck in a rut, ultimately breaking even at best. A big part of my lack of consistency was down to my own psychology, but it was only when I came to the realisation that indicators alone don't move an instrument. In fact, most indicators are backward looking. I stripped my charts of indicators, only keeping BILL WILLIAMS FRACTALS and started my quest to understand the underlying fundamentals behind market moves.
My results and consistency improved almost instantly. I'm sure there are many successful ‘technical only’ traders. But I just feel an awful lot more confident and relaxed placing trades with an understanding of the fundamentals behind my idea. And the beauty of it is, fundamental trading doesn't have to be complicated, in fact, the simpler you can make it the better.
Here is my interpretation of the basic knowledge required to trade Forex using fundamentals:
A quick look at a currency's reaction to RED FLAG data (particularly USD data), leaves you with no doubt how important economic fundamentals are to a currency's movement. CPI / EMPLOYMENT / RETAIL SALES and GDP all play a part in the economic wellbeing of a country. The simple correlation being: positive data = positive currency.
The other RED FLAG event (and perhaps most important) is interest rate decisions. The simple correlation being: higher interest rate = strong currency. And the market focuses on, not just the actual current interest rate but also, the perceived direction of interest rates over the coming months.
Finally, arguably the biggest driver of a currency's movement, is the ‘overall market risk environment’. In simple terms: if the mood is positive, it's classed as ‘risk on’. If the mood is negative, it's classed as ‘risk off’. A multitude of catalysts can alter the market's mood. Geopolitical events, company earnings, political statements, the list is endless. And the currencies react in accordance to correlations with other instruments, such as the S&P 500 and the US bond market.
(Note the recent correlation between DXY and USD JPY above)
In simple terms:
Risk on = strong AUD, NZD, GBP, CAD
Risk off = strong JPY, CHF, USD, EUR
There are nuances, such as the USD and EUR often also strengthen in a ‘risk on environment’. But the above is a good rule of thumb to start with.
By doing a little bit of reading every day, you quickly pick up on whichever ‘event’ the market is currently focused on and form an underlying bias for each currency.
And you can implement a very straightforward 3 point plan:
1: Gather knowledge to form an underlying opinion.
2: Identify a catalyst that lines up with your opinion.
3: Use support and resistance points according to BILL WILLIAMS FRACTALS to identify enter and exit points.
You'll soon find you can identify ‘high confidence set ups’ and by using a higher risk reward ratio per trade, a gradually rising profit curve becomes a reality.

XAU/USD Daily OutlookYesterday’s session reminded us of the importance of adaptability.
As mentioned earlier, I did not expect 4193 to be invalidated, but once it broke during the New York session, I adjusted and entered short at 4190, targeting 4155 and 4135.
Due to limited bearish conviction, I managed trades manually and closed at 4182 and 4174.
Overall, a disciplined and productive Tuesday.
Today’s Technical Setup
Tokyo High: 4229
Previous Day High: 4236.50
As long as this resistance belt remains intact, I’ll stay away from buy positions.
If this zone is invalidated, I will act accordingly.
Yesterday’s price action suggests gold is attempting to form a higher low, but bearish momentum is limited - partly due to fundamentals.
London Session Plan:
Look for sell opportunities below 4200
Target: 4165
ADP Nonfarm Employment Change (Nov) release during the New York session will likely drive volatility and set the tone for the day.
Fundamental View
Gold’s downside remains capped by geopolitical tensions and expectations of Fed rate cuts, which reduce the opportunity cost of holding gold.
However, strong U.S. labor data could strengthen the dollar and pressure gold lower.
Conversely, weaker data would reinforce bullish sentiment and increase the likelihood of a breakout above the 4230–4236 zone.

Gold Update: From Turtle Soup Win to NY Breakout PlanYesterday was a challenging session with two breakeven stop-losses:
Long from 4256: Expected bullish continuation, but London session gave a fakeout and price retraced from yesterday’s top at 4265.
Short from 4225: Price action failed to break the Asian low, and breakeven was hit again.
Later in the New York session, I spotted a trustworthy Turtle Soup pattern on the daily chart and entered short at 4240. The Tokyo session delivered an excellent TP hit at 4200, providing a solid foundation for today’s strategy.
Today’s Technical Outlook
Asian low: 4193 – I doubt we revisit this level soon, so I’ll avoid shorts unless a 4H candle closes below it.
Bullish scenario:
Wait for New York session and a break of previous week high at 4230.
From there, go long with:
TP1: 4245
TP2: 4265
Fundamental View
Gold remains supported by strong expectations of a Fed rate cut in December, with markets pricing an 87% probability of easing. Lower rates reduce the opportunity cost of holding gold, reinforcing bullish sentiment.
Additional drivers:
US Dollar weakness near two-week lows makes gold more attractive globally.
Geopolitical tensions and safe-haven demand continue to underpin prices.
Structural demand remains strong, with central banks and ETFs adding significant reserves.
However, traders should watch for key US data releases and Fed commentary this week, as any hawkish surprise could trigger a pullback toward Asian low (4193) or deeper supports near 4155

XAU/USD Today's Market OutlookGold remains supported by expectations of a Federal Reserve rate cut in December, with markets pricing an 80–87% probability of easing. Lower interest rates reduce the opportunity cost of holding non-yielding assets like gold, fueling bullish sentiment.
Additionally:
US Dollar weakness and geopolitical uncertainty continue to underpin demand.
Central banks and ETFs maintain strong buying momentum, adding structural support.
Risks: A stronger-than-expected U.S. economic data release or hawkish Fed tone could trigger a pullback toward key supports.
Gold is currently consolidating near $4,200–$4,250, after hitting an all-time high of $4,381 in October. Analysts project a bullish medium-term outlook, with forecasts ranging between $4,450–$4,950 in 2026, driven by central bank diversification and potential Fed cuts.
The Asian session range (4215 – 4256) has set the tone for today’s trading.
Bullish Scenario
Price must hold above the previous month’s high at 4246 to confirm bullish continuation.
If this level holds, I’ll wait for a break above the double top at 4256 to enter long positions.
Targets:
First: 4300
Second: 4380
Bearish Scenario
The support belt at 4225 – 4230 is critical.
If this zone fails early in the New York session, expect a move to:
Invade the Asian session bottom (4215)
Then extend all the way toward 4155

How I Managed To Achieve 13.83% By Improving My Win Loss RatioThe SMC model that I used provided a beautiful mechanical system for me but did not provide a win loss ratio. The account balance would keep going down inspite of the great RRR.
I added the classical school and the Stochastic to see if I can get better results by those filters. What happened is that the daily stochastic became my major indicator and all the others, including the SMC model, became support confirmations.
The last thing that I added was the opening trades mechanism. I would open multiple trades during the day and once I am satisfied of the positive result I would close all trades. I might close all on the same day of opening.
In four weeks of testing this methodology I was able to turn my win loss ration from a disaster to even the wins exceeding the losses, and not one single batch was closed negative. All trade batches were closed on the positive.
This is a great method not only to increase my balance but also to increase my confidence.
I am not preaching that my plan is great, what I want to concentrate on is the value of education and continuous learning.

Improving My Win Loss Ratio In Forex Trading Achieved With 9.92%Not only I was able to achieve my Win Loss Ratio but I was able to make 9.92% profit in three weeks.
Improving my win loss ration in Forex Trading in this manner was amazing. Even when I started the improvements I didn't imagine I will turn the table 180 degrees. I was going to accept my Win Loss ratio to skew towards the loss side. With a good RRR the balance would still increase. But the result that I got is that my Win Loss is now 17:11 while before was something like 4:14. I don't have the exact old Win Loss ration anymore as the formula was damaged.
The search for a solid Forex Trading Plan is not over yet. The plan that I have is still scary and very risky, as it does not have any Stop Loss or Take Profit in it. I open several positions and then close them all as one batch once they reach an acceptable percentage of the current balance.
With the current method of closing the whole batch I am still leaving money on the table, and since I am trading the daily timeframe, a position trigger does not come easily. Trading this time frame is really scary and intimidating not to mention that I am trading it without any stop loss or take profit.
Unfortunately, I still didn't find a way to include those protections yet, but next week I will try to solve the challenge of leaving money on the table. Next week I will start dealing with each trade as a thesis of its own. Each trade will have it own story. Once the story approaches its end I will close the trade whether it is winning or losing.
Meaning, the thesis that opened the trade needs to change to close the trade. I am testing if I will have the stomach for such a scary ride.

Improving My Win Loss Ratio In Forex TradingWell, Some good news, actually great news. The experiment worked and in this video I show how I am improving my win loss ratio in Forex trading.
From a disastrous Win Loss ratio using only SMC now with combining the classical school along with the Stochastic I have been nailing it for the past 20 days with 22 trades and 8.6% increase on my balance.
In many cases, especially with advantageous RRR, it is Ok to have the win loss ratio in favor of the Loss, as the RRR will compensate and the balance would increase, but in this case I have the win rate higher and the RRR if it was calculated is also higher.
I depend on opening multiple trades and closing them all at once once they hit an acceptable percentage. In the video I said I will close them around 2%, but to tell you the truth, even if it was 1% I would close because no business I know of would bring 1% profit in a day.
The concern now with this Forex Trading Plan is that it does not use Stop Loss nor Take Profit. I feel that I am hanging in the air, which is not a good feeling and this might get me inside an emotional imbalance in the long run.
Still, the test is going on to evaluate all that.

My Steps On how To Improve Forex Trading Win / Loss Ratio In this video we talk about the three elements of the new plan that I have designed based on different types of schools and educational sources.
The plan elements consist of SMC (Smart Money Concepts), Classical School (Support & Resistance, Trend Lines, Febonacci Retracement (not all the time)), and the Stochastic Indicator.
The stochastic is of two timeframes, One is weekly and the other is daily but both are shown on the daily timeframe. This is something that I loved here about TradingView; is the ability to show an indicator of a different timeframe.
Last week I opened a couple of positions based on the new plan, but one of them was opened with haste and not totally adhered to my trading Plan rules.
I show the exact trading rules that I am using and how this will affect my risk management plan.

BTCUSD: Trend lost momentum, sideways within price blockBITSTAMP:BTCUSD Analysis – October 21, 2025
Overview
Yesterday, BITSTAMP:BTCUSD failed to sustain its bullish momentum and closed below the EMA, indicating that the uptrend has weakened and the market has potentially shifted back into a bearish phase.
Current structure (H4)
On the H4 timeframe, BITSTAMP:BTCUSD is moving sideways within a price block, reflecting an ongoing indecision between buyers and sellers.
At the moment, the market lacks a clear direction and is consolidating within a tight range, waiting for a breakout to define the next move.
In such a challenging and uncertain market environment, the best approach is to stay patient, wait for clear confirmation, and avoid forcing trades when price action is still unclear.
Above all, capital preservation and risk control should remain the top priority.
Trading plan
Bearish scenario:
If price consolidates with weak momentum below the EMA and near the lower boundary of the price block, we can consider short positions, following the downside momentum.
Bullish scenario:
If price moves back above the EMA, then forms a tight accumulation near the upper boundary of the price block while the EMA holds below price, this would signal that bulls are regaining control in that case, consider long positions.
Notes:
Avoid entering trades when price is still within the mid-range of the block.
Wait for clear price reactions around key boundaries.
Maintain strict risk management and limit exposure per trade.
Daniel Miller @ ZuperView

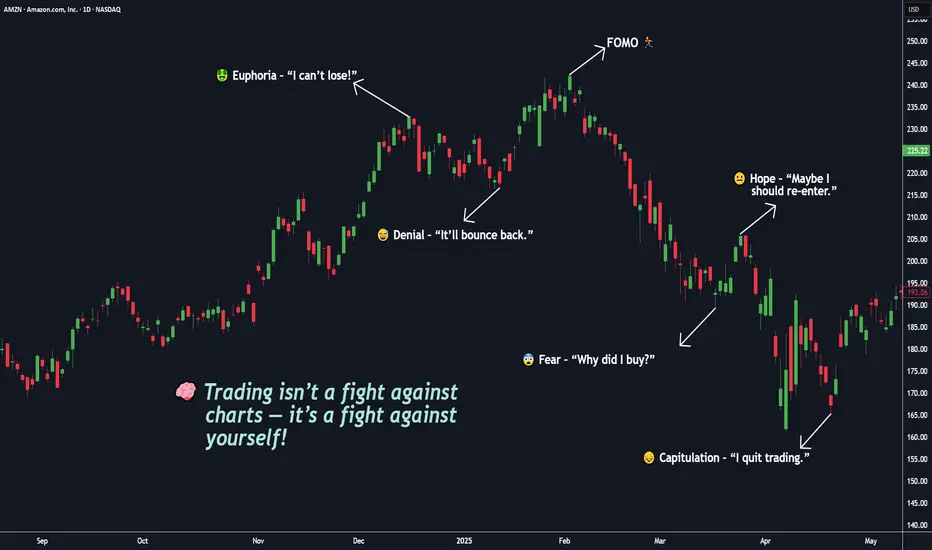
You’re Not Competing With the Market, You’re Competing With Self🧠 Trading isn’t a fight against charts — it’s a fight against yourself.
If you’ve ever told yourself “I’ll just take one more trade”, you already know this battle.
But in truth — the real battle happens inside your mind.
You start your day with discipline: BITSTAMP:BTCUSD , NASDAQ:AMZN , OANDA:XAUUSD , NASDAQ:META
📋 “ Two setups max. 1% risk. No emotions. ”
But then the market shows you something that looks perfect.
Price moves fast. Your pulse jumps. You click “BUY BUY BUY.”
Seconds later , the candle reverses — and suddenly, you chase a candle, break a rule, or move your stop just to “ give it a little more space ,” you’re not losing to the market my friend, You’re losing to your own impulses. ⚔️
You’re not trading the chart anymore — you’re trading your hope. And that’s what makes trading beautiful — it’s not a test of intelligence, it’s a mirror of your self-awareness.
That’s when the market does what it always does: it punishes emotional decisions and rewards patient ones.
💭 Emotionally! You start bargaining with yourself:
“It’ll come back.” ( When you’re greedy → it exposes it. )
“I’ll just move my stop a little.” ( When you’re fearful → it magnifies it. )
“Let me add to average out.” ( When you’re calm → it rewards it. )
The market doesn’t care if you win or lose. It simply amplifies your inner state.
You Digest it or not!, the truth most don’t want to accept:
You can’t control the market.
You can’t control news, indicators, or price spikes.
But you can control your reactions.
The moment you stop reacting and start observing — your trading transforms.
Clarity comes only when emotion leaves. 💎
⚡ Trading isn’t about predicting moves — it’s about managing yourself during those moves.
🎯 Real-Life Example:
Think back to the last time you made money on a random FOMO entry. It felt good, right?
That “instant win” wired your brain to believe impulsiveness works.
But the next time, that same instinct cost you twice as much.
That’s recency bias — one of trading’s silent killers.
Your brain craves the last emotion it felt, not the right decision.
💎 True mastery begins when you stop asking:
“Why did the market do that?”
and start asking:
“Why did I react like that?” ( 👉 “ Am I reacting, or am I responding ?” )
The market has no emotions . It’s just reflecting yours back at you — amplified, delayed, and multiplied by leverage. ⚔️
🧩 Here’s the mindset shift, that changes everything:
You don’t need to win every trade. You need to trade as if you already know yourself.
You don’t need a better indicator. You need a clearer mirror.
The edge isn’t on the screen — it’s inside your head.
When you realize that, trading becomes peaceful and You stop chasing, You start choosing.
Master that single question, and you’ll outperform 90% of traders who never will.
💬 What’s one emotion you think costs you the most trades —
👉 Fear 😨
👉 Greed 🤑
👉 Impatience ⚡
🧩 Drop it below 👇 and let’s talk about how to overcome it — build awareness together as traders, not competitors.
If this Idea gave you a value information then please, Boost it, share your thoughts in comments, and follow for more practical trading!
Happy Trading & Investing!
Team @TradeWithKeshhav
Building a Trading Plan: The 2nd StepMy trading journey has been defined by a search for consistency. For years, I operated under the belief that a trading plan was a strict list of entry and exit rules. I would follow these rules, yet my results remained unpredictable. The turning point came when I began to understand what is a successful Forex trading plan is. Surely, it is not a rigid document, but a dynamic decision-making system.
The first component of this system is identifying the trading range. This foundational step seems simple, but I learned that its execution is critical. The range establishes the market's current context. It defines the battle between buyers and sellers, creating a clear framework for all subsequent analysis. Without accurately identifying this zone, every decision that follows is built on an unstable foundation. I spend a significant portion of my analysis time confirming these boundaries, knowing that everything else depends on it.
The second component, and the one that brought the entire process into focus for me, is the concept of inducement. In the methodology I am testing, inducement represents a key liquidity area. It is a level where the market is likely to see significant activity from larger participants. Learning to identify these zones clarifies both ends of the trading range. It was no longer just a box on a chart; it became a map with highlighted areas of strategic importance.
This understanding created a powerful filter. It helped me distinguish between a simple break of a level and a meaningful move targeting a specific liquidity pool. My plan specifically focuses on what is classified as a major inducement, which allows me to ignore the minor. This step directly addressed the inconsistency in my earlier trading, as it provided a logical reason for price action beyond basic support and resistance.
Perhaps the most important lesson has been the dynamic nature of a true trading plan. The market is not static, and neither can a Forex trading plan be. I recall a specific backtesting session analyzing the GBPUSD pair on the 15 Minute time frame where a clear change of character occurred. The price action broke a previously defined range. A clear rule shows the difference between a break of strucutre and change of character. Now, I just need to redefine the new trading range with the help of the inducement level. As simple as that.
This proves that a plan’s value is not in preventing change, but in providing a structured method to adapt to it. The plan I am building is a living system. It guides me not only on when to enter a trade but, just as crucially, on when to stand aside and reassess the market structure. This ongoing process of learning and adaptation is, for me, the true essence of what a Forex trading plan must be.

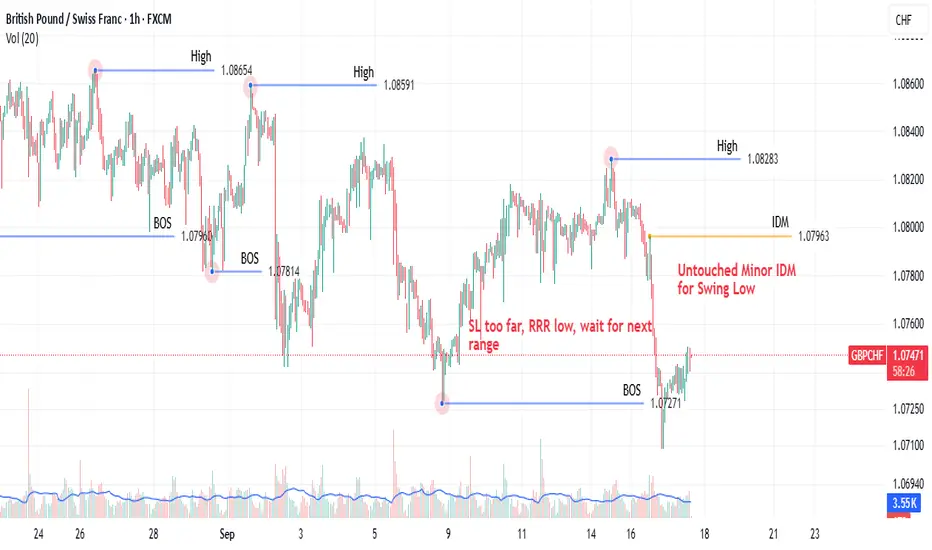
GBPCHF: A Lesson in Money Management Over Perfect SetupsCame across a textbook short setup on GBPCHF on the 1H recently. The price action was within a defined range, structure was bearish, and it was signaling a potential entry.
However, the trade was a pass. Why? The stop loss was simply too wide for my account size, creating a sub-optimal risk-to-reward ratio that fell below my personal 1:2 minimum rule.
This is a reminder that a good technical setup is only one part of the equation. The real discipline is in the money management—calculating the position size and risk before ever entering a trade. Sometimes, the best trade is the one you don't take.
XAUUSD Liquidity Addiction: Why Your Brain Wants to Get Swept
💫There’s a cruel irony in trading: the cleaner a level looks, the more dangerous it usually is. ATHs, equal highs, perfect lows, and round numbers shine like neon signs saying “enter here.” And your brain, wired for safety and clarity, feels drawn to them like a moth to light. The problem? In SMC, those are not safe zones. They’re bait.
1. The Brain Craves Clarity
The human mind hates uncertainty. When a chart looks messy, hesitation dominates. But on the show of perfect symmetry, you relax because you see something clear. That relaxation is a dopamine hit, and you get addicted to it. But in the markets, the very thing that calms you down is what sets you up.
2. Trap in Action
You’ve seen it before. Price builds a flawless high, traders lean in heavy with sells, certain it can’t go higher — and then Gold rips into new ATHs. The sweep takes them out in minutes. What hurts most isn’t the loss itself, it’s the betrayal. You were so sure and felt safe. And that’s the point: the moment of peak confidence is the moment of maximum exposure.
3. Psychological Addiction
This cycle is repetitive for your brain, giving it a fake feeling of safety. Every “almost win,” every daily plan that looked perfect, every friend who caught that one clean breakout — it all trains you to crave the next hit of certainty. You’re not hooked on trading itself but on the illusion of control. The market doesn’t have to be smarter than you. It just has to let your brain do the 'work', then they take a piece of your account with your SL being hit.
📋 Takeaways
1. Spot the bait, don’t buy/sell it → If it looks too perfect, don’t ask “what am I benefiting?” but ask “WHO’s benefiting from this?”
2. Don’t trade the sweep itself → Wait for the reaction & confirmation after liquidity is taken.
3. Flip the perspective → Ask where the trap is being set, not where the bait is shining.
4. Patience is a position → Sweeps only work because traders can’t sit still.
🔑Liquidity does not hunt you. It waits for you to walk in. The moment you stop chasing certainty and start chasing context — structure, reactions, and intent — the game changes.
The 'traps' and 'baits' are in plain sight, so they cannot fool you so often.
If this article helped you today and brought you more clarity:
Drop a 🚀 and follow us✅ for more trading ideas and trading psychology. Thank you.

My Personal Forex Money Management System-The 4 Rules I Live ByLet's talk about something more important than any indicator: money management.
I don't care how good my strategy is; without a solid system to manage risk, I am just gambling. I've been documenting my own trading journey and wanted to share the exact four-pillar framework I use to protect my capital. This isn't theory—it's what I actually follow on every single trade.
The 4 Components of My System:
Risk Per Trade: The fixed % of my account I'm willing to lose on one idea is, for now, between 0.5% and 1%.
Total Open Risk: My cap on total exposure from all running trades, I prefer a max of 3% but giving myself the space to a maximum of 6%.
Risk-to-Reward Ratio: My non-negotiable minimum filter for every setup is the golden 1:2. To tell you the truth, now when I see a trade that forces me to 1:2, I get annoyed. The trading plan that I am working on now gives me greater opportunities. Therefore, 1:2 is really my bare minimum.
Dynamic Position Sizing: How I calculate my lot size based on my stop loss.
My goal is to stay in the game as much as possible and work on the accumulation effect. This system is so simple and practical that it keeps me disciplined and stops me from blowing up an account on one bad trade or a volatile news event.
I'm curious—what's the #1 rule in your money management system? Drop a comment below. Let's learn from each other.
The Two Pillars That Changed My TradingAfter years of trial and error, I shifted my focus from searching for signals to building a foundation. For me, that foundation rests on two pillars:
Pillar 1: Risk Management
Risk per trade: Fixed % of account. Currently, mine is 0.5%
Minimum Risk/Reward: 1:2. I try as much as possible to make this minimum a rare occasion; I try to aim for higher, but it all depends on other factors of the setup.
Position sizing: Calculated precisely before every entry. I base it on three factors: the current account balance, risk per trade, SL distance.
Pillar 2: The Trading Plan
A written, unambiguous set of rules for every action.
Based on price action and market structure.
Designed to be followed without emotion or deviation.
These pillars work together. The plan gives me confidence, and the risk management gives me the longevity to be wrong. This mindset shift made all the difference. I document my journey applying these principles in detail elsewhere.
What's one rule in your trading plan you won't break?