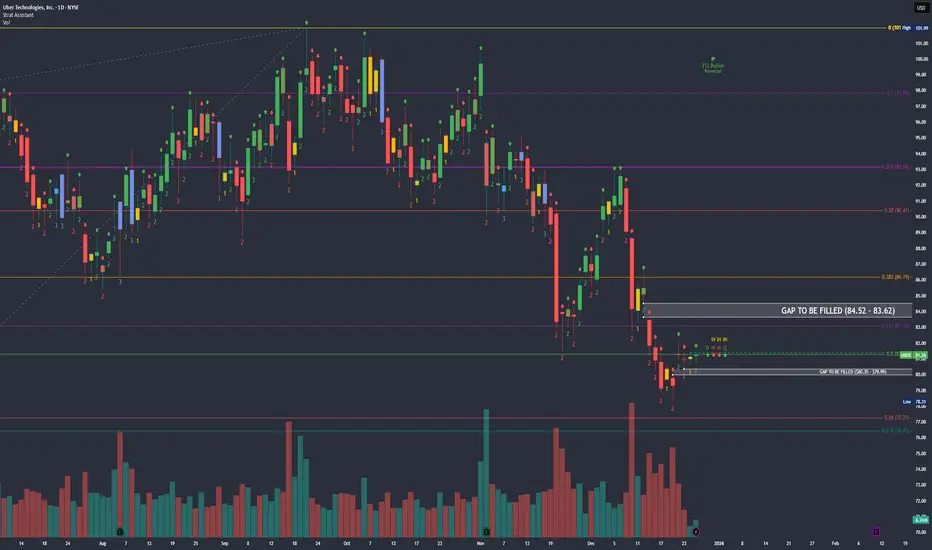
$UBER Daily: 2u Continuation Above $81.50 Resistance Break📊 POSITION: $85c 03/20/26 @ $4.28 | Current Stock Price: $81.26
🎯 PT: $8.56 (+100%) | SL: Below $80.68
━━━━━━━━━━━━━━━━━━━━━━━━━━━━━━━━━━━━
📈 MULTI-TIMEFRAME STRUCTURE
WEEKLY: 3-2d-1 Inside Week (Consolidation)
- Bullish trigger: Break above $82.25
- Bearish invalidation: Close below $80.35 → Target $78.30
- Status: Coiling for directional move
2-DAY: 3-1-2u Pattern
- 2u continuation setup above $81.50
- Watching for confirmation candle
DAILY: 2d-1-2u Structure (CHART SHOWN)
- Key resistance: $81.50 (Previous Day High) - breakout = continuation
- Critical support: $81.09 (previous day midpoint)
- Below $81.09 on multiple timeframes → Bearish to $80.68 (Previous Day Low)
- Further downside: $80.50 → $80.00
- Upside gap-fill target: $83.62-$84.52
━━━━━━━━━━━━━━━━━━━━━━━━━━━━━━━━━━━━
🎯 FIBONACCI ANALYSIS
Long-Term Fib (ATL → ATH):
- Swing: $13.71 (03/18/20) → $101.99 (09/22/25)
- Current zone: 0.214-0.28 retracement ($77.27-$83.10)
- Holding bullish all-time Fibonacci support
Recent Swing Fib:
- Swing: $60.63 (04/07/25) → $101.99 (ATH)
- Current: 0.5-0.618 golden pocket ($76.43-$81.31)
- Price finding support at key retracement zone
━━━━━━━━━━━━━━━━━━━━━━━━━━━━━━━━━━━━
📍 KEY LEVELS
Resistance:
$81.50 (PDH - breakout trigger)
$82.25 (weekly bullish confirmation)
$83.62-$84.52 (gap fill zone)
Support:
$81.09 (daily midpoint)
$80.68 (PDL - stop-loss level)
$80.00 (psychological support)
━━━━━━━━━━━━━━━━━━━━━━━━━━━━━━━━━━━━
💡 TRADE THESIS
Price consolidating at confluence of multiple Fibonacci support zones while forming a 1-2u-2u continuation pattern. Clean risk/reward with defined invalidation below $80.68. Break above $81.50 triggers 2u continuation toward gap fill at $83-84.
Entry rationale:
✓ Multi-timeframe alignment (Weekly inside bar, 2D/Daily 2u setup)
✓ Golden pocket Fibonacci support (0.5-0.618)
✓ Long-term Fibonacci support holding
✓ Clear upside gap to fill
✓ Defined risk below $80.68
━━━━━━━━━━━━━━━━━━━━━━━━━━━━━━━━━━━━
⚠️ RISK MANAGEMENT
- Contract: 81 DTE (03/20/26 expiry)
- Stop-loss: Price close below $80.68
- Profit targets: Breakeven at +25% of contract price, trailing half at +50%, exit at +100%
- Position size: Appropriate for 81 DTE timeframe
*Not financial advice.
*Trade at your own risk.
Transportation
Bearish potential detected for BXBEntry conditions:
(i) lower share price for ASX:BXB along with swing of DMI indicator towards bearishness and RSI downwards, and
(ii) observing market reaction around the share price of $22.66/22.69 (low of 11th December / yearly VWAP zone).
Depending on risk tolerance, the stop loss for the trade would be:
(i) above the recent swing high of 9th December ($23.16), or
(ii) above the declining 50 day MA or quarterly VWAP (currently $24.06 and $24.08).

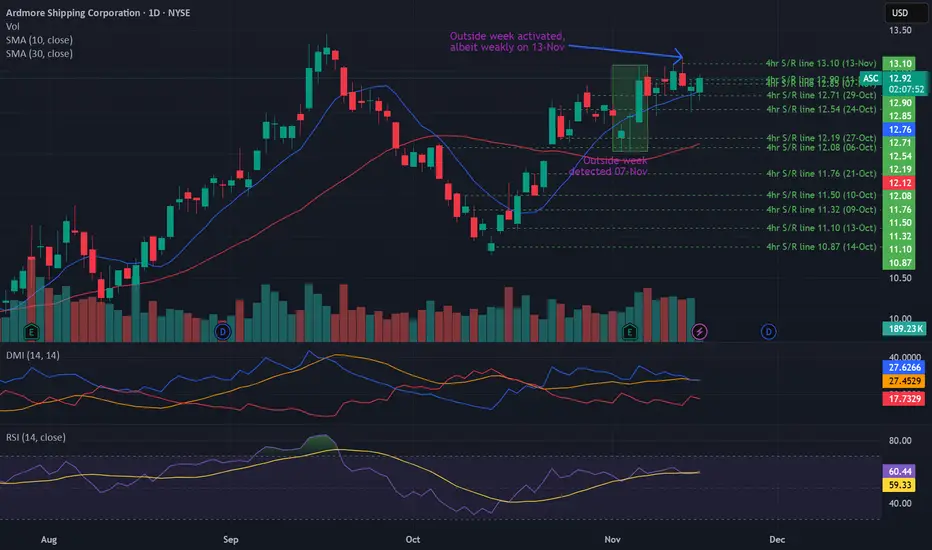
Potential outside week and bullish potential for ASCEntry conditions:
(i) higher share price for NYSE:ASC above the level of the potential outside week noted on 6th November (i.e.: above the level of $13.08).
Stop loss for the trade would be:
(i) below the low of the outside week on 4th November (i.e.: below $12.03), should the trade activate.
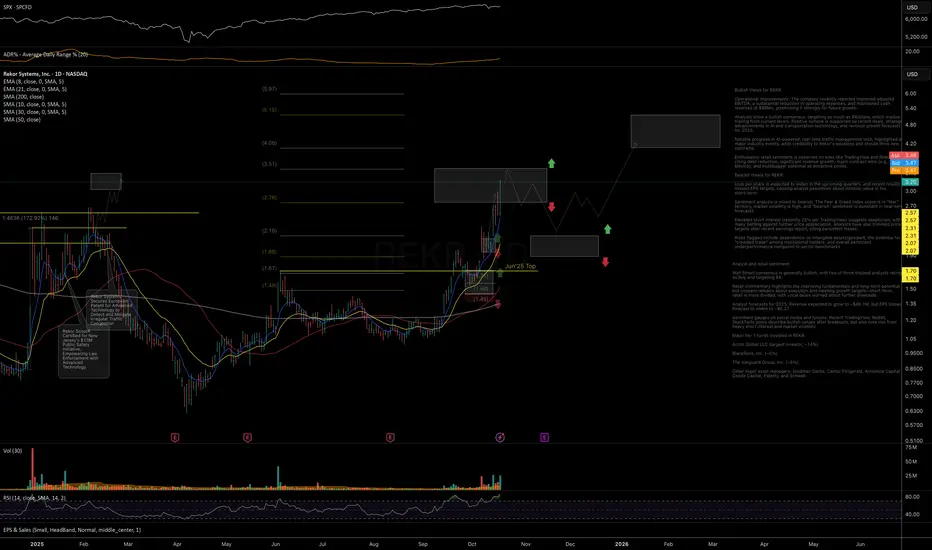
REKR: price reached resistance level. Watching for pullback Strong follow-through into the next resistance zone since the previous October updates. Watching for potential selling pressure to start building and for price to pull back toward rising EMAs.
As long as price remains above the 2.20–1.90 support zone, the trend structure continues to suggest further upside potential toward the 4.00–5.15 resistance area after a new base formation.
Chart:
Previously:
• On upside potential (Oct 14):
www.tradingview.com
• On support zone (Oct 7):
see weekly review:
• On bullish trend structure (Oct 1):
www.tradingview.com
Potential outside week and bullish potential for AZJEntry conditions:
(i) higher share price for ASX:AZJ above the level of the potential outside week noted on 3rd October (i.e.: above the level of $3.28).
Stop loss for the trade would be:
(i) below the low of the outside week on 29th September (i.e.: below $3.17), should the trade activate.

Short Uber to deathUber driver's pay is declining constantly. This week it reached the point where good drivers are quitting. The self driving technology to replace these drivers is not yet here. Uber will start absorbing the self driving cars maintenance costs. They will be surprised how much money it takes to have a running clean car. Uber jacked up riders prices to prepare for this; accounting them as insurance costs. Riders are looking more and more into cheaper alternatives. Public transportation is making a come back.
Uber will be bankrupt with this model. Their biggest mistake is not taking care of their biggest asset; their drivers.
I'm shorting UBER to their death.

$GRAB Long Term Trade IdeaTaxi and delivery service stocks all look bullish at the moment. Lyft and Grab are both a couple of my favorite longer term swing trade/investment plays just based off risk/reward and how beaten down both the stocks are.
If shown patience this trade could work wonders. I like it a lot because it gets me a little exposure to assets outside the U.S. and from a chart perspective its hard not to love a setup like this.
1. The buy side volume shown here is the highest its ever been for the stock by a long shot.
2. Price has been in a descending wedge type formation for several months now and is attempting to make a breakout, though this month's candle still has a lot of time left.
3. That hammer candle, especially considering it being printed on the 1M timeframe, is incredibly bullish in my eyes.
This chart reminds me a lot of NYSE:BABA but a bit earlier in its breakout stages. To me it is clear that accumulation has been taking place for over 2 years now and a big markup is upon us.
I have 3 take profit areas marked based off a few different Fibonacci levels I like that also have confluence with supply/demand dynamics present on the chart.
multiple daily/weekly candles below $4 could be a a good stop loss area as that would invalidate a lot of the bullish structure. Based off the current price this provides you with a minimum 2.75x RR trade and a maximum of 7x RR.
My average price is $4.25. Any pullbacks below $4.50 I will be looking at as great buying opportunities.
Will do my best to update this idea periodically over the next year or so.

Fall Down to $70 ApproachingWith the RSI above average since mid-April 2025, the trend has been steadily rising up to $82 per share even breaking the highs from late February and March.
Price projected onto both (A and B) Inside pitchforks is well above the median line. In the pitchfork A the price is even directly touching the upper parallel line.
Reversal near the highest achieved price this year on 21st February is probable
Based on these indications, we can expect a fall to around $70 somewhere in the middle of May.
Key details:
RSI over "overbought" level
Price in both Inside pitchforks near the upper parallel line
Longer uptrend = breakdown necessary

(AAL) American Airlines "Crashing"?! Long Put Worthy?American Airline (AAL) in recent years has had major news coverage due to various collisions and other events. The technicals appear to show some strong bearish momentum forming on the 1 Week chart. Will the airline company coming crashing down? Or is this currently a discounted buying opportunity? What are your thoughts?

TRANSPORTATION! CRACK!!The transportation average breaking the first time warned us that things were not right back in July 2024. Today we are getting yet another CRACK WARNING!
The TRUMP economy will be a disaster area if he doesn't change his ways quickly. Even then it may be too late. Trust in the government has eroded.
Democracy and markets rely on TRUST! Trust can not be bought, or taken, it may only be lost!
DANGER for bulls!
last month I started to warn about Airlines (JETS) since then the results speak for themselves.
Click like, follow subscribe for more!

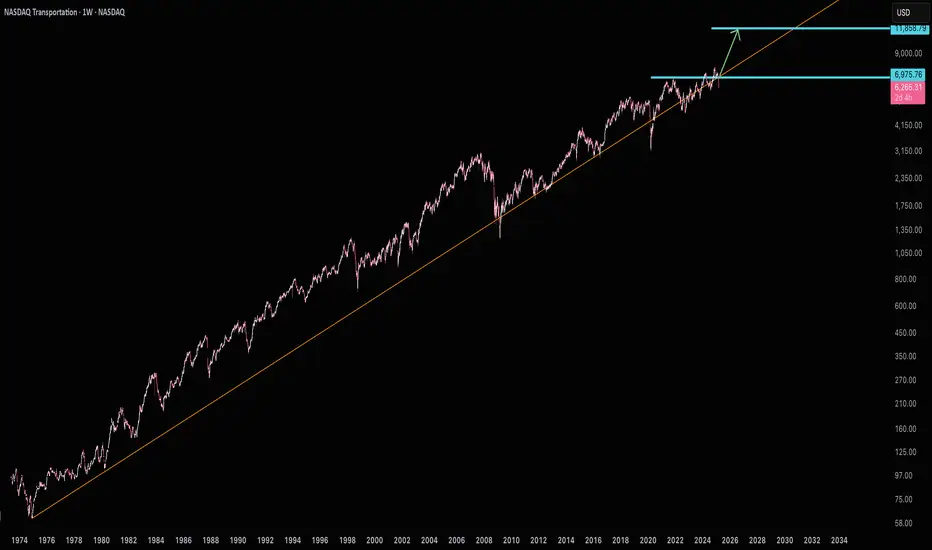
Transports Ready for Lift OffTransports have never fallen below this trend line for long and they are squeezing right into resistance. That signals to me a big move ahead for transports reaching 11,850. Search through the components and find your favorites.
JBLU Prediction: Q4 '24 Earnings Slide from Q1 '25 Guidance?It's my estimation that the market sentiment felt from AAL Q1 '25 guidance will ripple into JBLU's earnings report come JAN-28-25.
While AAL beat earnings estimates (revenue up 4.6% / $0.86/share vs. $0.66/share expected), Q1 guidance was set at a loss of $-0.40/share vs. $-0.04/share. Investors I believe are expecting a much stronger output in 2025 from domestic carriers, and this was a horrible start to the year.
AAL and JBLU's failed Northeast Alliance, a break up due to antitrust laws, has now caused both airlines to pay $2M in legal fees across several states.
Looking at LuxAlgo's Support Resistance Signals MTF among additional indicators, I believe the underlying will touch below $7.50 after earnings are released.

NIKKON _ Channel Pole Target Reached, +20% PROFIT within a WeekFalling Channel Pattern formed and Breakout. And Market Reached the Channel Pole Target within a week. Achieving +20 PROFIT.
Support me; I want to Help People Make PROFIT all over the "World".

Don't Blow this Dip-Buy opportunity in 2022 for Cummins"Natural science has invaded and transformed human life all the more practically through the medium of industry; and has prepared human emancipation, although its immediate effect had to be the furthering of the dehumanization of man."

BA: Triple Bottom at Support with RSI Bullish DivergenceThe Boeing Company is attempting to confirm a Triple Bottom with RSI Bullish Divergence at the $200 Support Zone. If it plays out I think we could go back up to the 0.236 up at $212 and if we really get traction here, I'd suspect it'd g for the gap fill up at the 0.786 retrace aligning with the $250 level.
It's also worth noting that Boeing filled a downside gap as it pushed down into the support zone, so it's possible that will be the extent of the current wave down.

Transportation leader $SAIA is near ATHSaia provides less-than-truckload, non-asset truckload, expedited and logistics services across the U.S. is ranked #1 in its industry by IBD
While the sector ETF AMEX:XTN is down, stocks like NASDAQ:SAIA , NYSE:XPO and NASDAQ:ODFL are all near new highs
The price is in its second base formation close of breaking out above $439.50
I'll leave a stop buy just above this point.

UPS Confirms Lower High Bearish Consolidation Below Demand LineThe UPS price action has confirmed a Lower High Bearish Consolidation Structure below the macro Demand Line has basically done so via a secondary Head and Shoulders with PPO Confirmation thereby confirming a Bearish BAMM that will likely take us down to the 88.6% retrace at $90

Dry Bulk Shipping ETF to Rise as Export/Import Prices IncreaseBDRY the Dry Bulk Shipping ETF, which is tied to the Freight Rate Futures Contracts of the Various Ship Sizes, is now looking to rise again as both the Import and Export prices continue to rise, especially within the Natural Gas and Fuel category.
We have Confirmed Bullish Divergence on the RSI, MACD, and PPO; all while the PPO has begun to give us a Bullish Confirmation at the HOP level of this Bullish Deep Gartley on the Weekly Timeframe. As a result, I will now be expecting to see the market price of this ETF go up at an extreme rate as the Shipping, Freights, and Carrying Costs begin to rise.
I will be looking at individual Dry Bulk Shipping and other International Goods Transportation stocks such as ADM, GASS, and DLNG

$DJT: Dow Jones Transportation Average Not Confirming The RunIf you wanted to know whether or not the market was on a bull run or not, all you had to do was look at the Dow Jones Transportation Average or even AMEX:RSP (which definitely does not fit the bull market, showing that overall the S&P 500 has barely broken 15% gain since October).
More important though is the transportation average breaking off from the rally ahead of the rest of the market. When transportation is leading us lower this is not a good sign for the economy. Other economic indicators support this thesis. For example, cardboard box demand is the lowest it's been since 2008. Showing signs of a decline in goods demand.
For more insights on trading and investing check out the Equity Channel Podcast on Apple, Spotify and Amazon.

3M Position Trade✨ NEW: 3M...UT (3M, 3D) ✨ POSITION TRADE ✨
BLO1 @ 74.34
BLO2 @ 50.99 (Wealth Trade - I may never let this position go)
TP1 @ 112.53 (shave 25% from BLO 1)
TP2 @ 175.83 (shave 25% from BLO 1)
TP3@ 215.82 (shave 25% from BLO 1)
3M Co. is a technology company that creates industrial, safety, and consumer products. They operate under different segments such as Safety and Industrial, Transportation and Electronics, Health Care, and Consumer.
Recently, the company has faced a major challenge involving around 260,000 pending lawsuits due to their military earplugs malfunctioning. The outcome of these legal proceedings could greatly impact 3M, either causing severe consequences or presenting a unique investment opportunity.
Our team predicts that despite the uncertainty, institutions will likely intervene and purchase 3M's stock as it returns to its established pattern of gradual and steady growth, also known as the company's intrinsic or true value. However, it is important to acknowledge that the future outcome is still subject to change and could sway in either direction.
Here is my strategy: I plan to sell 25% of my BLO1 holdings at every take profit point, while keeping the remaining amount for a long-term investment. However, I have no plans to sell any of my BLO2 holdings and will be holding them for the long term. This is commonly referred to as the "diamond hand strategy."
Happy Trading‼️

tsla longs fighting uphill battlebulls are in control of this move but lack the follow through necessary to make a convincing move to the upside look like a change of weekly momentum. weve made a daily bounce that retraced enough to say a lower low is set, but havent made a higher low or confirmed the move with a trip above the last bearflag area/value area high. weve also started forming a topping out proccess 4hr as indices futures fail to climb over a top like 4037 es1!, and this has happened every leg of the way fown for stocks making me think we need to at least revisit the dotted line, and if we break through it id look for the lower horizontal. if we support in the mid range and move higher, especially if indices are breaking out with multiple sectors green, or if we get immediate continuation id still be long.

DIA trading within CPI Range from June!Dow Jones is still trading withing the range of the past few days which also places it within the range it was in back when we had a major decline following a disappointing CPI report back in the beginning of June. This puts the market in a position that could see a potential breakout in either direction. Can we possibly see economic data that propels the Dow higher out of the top of the range or will the trend of negative data to end the year continue forcing the market out of the lower end.
Manufacturing data released today suggest that the economy is continuing to slow, and we have recently seen forward earnings projections for giants such as Tesla ($TSLA) and Apple ($AAPL) be reduced. This is consistent with a muted rally we are seeing here for the Dow to start off the week and a 1% down day for the Nasdaq. I stand by my previous statement here to start off the week. I would be looking for short positions, with potential long positions to hedge going into 2023. However, we still are trading within this range and have no indication yet as to which way the wind will blow for the Dow Jones Industrial Average. There are some other signs that point to the potential outcome such as a weakening semiconductor industry ($SMH) and transportation index ($DJT) still trading below its 8 day average.

TPOR Triple leveraged Transportation ETF SWING LONGFundamentally, the stabilization of fuel prices helps push things down the road.
A possible rail strike if no averted by Congressionaly action will cause a big macro effect.
TPOR was downtrending into the end of September then reversed starting a trend back up.
I see this as a good long swing buying initially now and then every time the price
pulls back to the Hull 150 moving average trend line in back or even drops below it
when the faster moving average ( Hull MA 20 in Blue) reverses from going down to
up or crosses the long MA from below. I will exit when the relative strength tops out
and shows bearish divergence.
