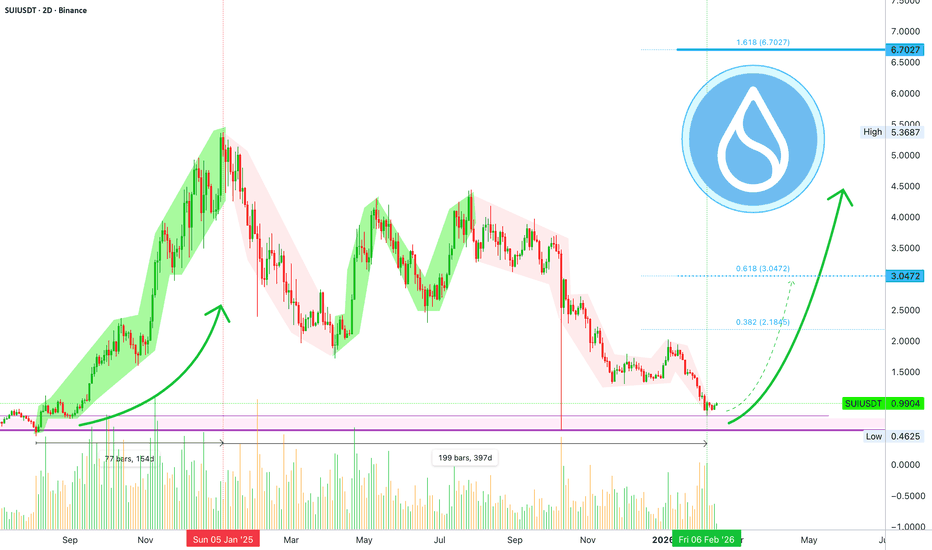
Sui headed towards a new all-time high?SUIUSDT just activated the late September 2024 price range, the same level that supported a 1,000%+ bullish wave. This exact level was tested on a wick only which shows buyers were present; ready to buy, ready to hold, ready to trade.
SUIUSDT is extremely bullish not based on this chart but based on what Bitcoin, Ethereum and Binance Coin are doing, the big three.
The highest buying happened recently, at the lows. Market participants went wild making the biggest purchases of SUI tokens once this altcoin reached support. The 2D session ended up with the strongest buying in more than 9 months, since May 2025.
Keeping in mind that the all-time high happened January 2025, and the bear market low this same month, February 2026; we have a full-complete bearish cycle.
Any Cryptocurrency project can easily go bearish for an entire year and that's it. It can grow for years straight up but a bear market can run its course in a year. Sometimes it can be more but the fact that we have a strong higher low as the market starts to turn is a good enough early signal; what one does, the rest follows.
Some big projects, reputed ones with strong development teams and following, are growing two digits green and reaching almost 50% within the last 24 hours. And this is only the first day.
This is pointing to 100% growth within 3 days and that's it. Once this is done, 1 level up, the market never looks back and the bottom is gone. These prices won't possible again but not all is lost. We are set to experience months of growth. Can be one, can be two, can be three. All is good with Crypto.
Thanks a lot for your continued support.
Namaste.
Trend Analysis
NASDAQ: Risk of a 10–12% Correction — For and AgainstThe index is trading around 24,700, having almost touched the 200-daily MA (~20,000) — a bearish signal in itself. Nasdaq hasn't made a new high since last October, which is a textbook sign of fading momentum in a mature bull market.
The case for a correction:
The index is dangerously concentrated in a handful of megacaps — when even one or two of these names stumble, the whole thing gets dragged down hard. February has already shaped up to be the worst month for the tech sector in nearly a year, with software names selling off on valuation concerns and growing doubts about hyperscaler spending sustainability.
Add tariff uncertainty and trade policy noise on top, and you've got a fragile setup.
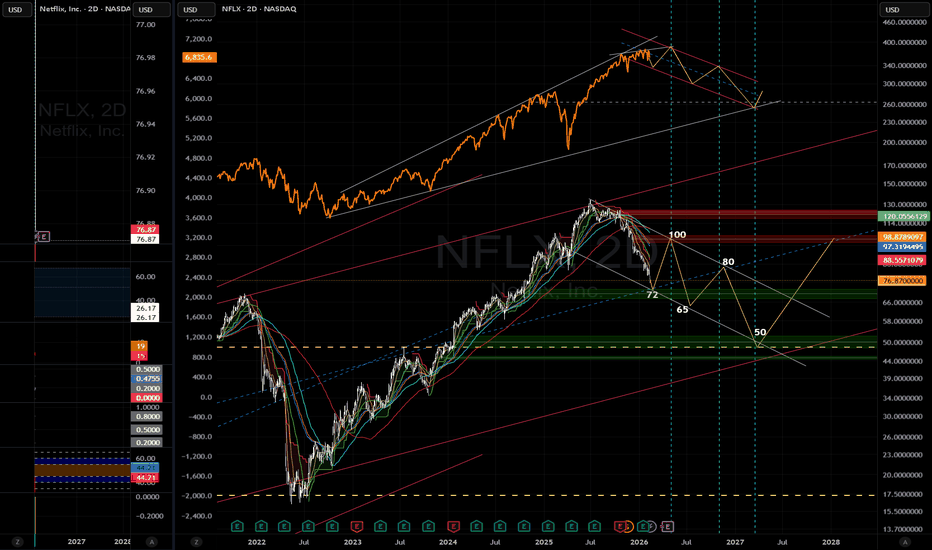
Also, it concerns me to see a fractal pattern on the chart above. The previous two times we got a consolidation >90 days without any certain direction, the index lost 24-36% over the next 1-2 quarters. The possible targets for this correction are on the chart.
The case against a deep selloff:
Historically, most NASDAQ corrections since 2003 have stayed under 10% — only 13 exceeded that threshold.
Asset manager positioning has been net-long since late 2022, with no signs of extreme crowding or panic.
Wall Street houses like Morgan Stanley, Deutsche Bank, and Goldman Sachs are calling for 7–17% upside by year-end, leaning on the AI supercycle and double-digit earnings growth from megacaps.
The technical picture is flashing warning signs that shouldn't be ignored. A 10–12% pullback toward the 22,000–22,500 zone looks increasingly probable — not as a trend reversal, but as a painful shakeout within the longer-term uptrend. The most likely trigger is disappointing AI spending guidance in Q1, or an external macro shock that catches a complacent market off guard.
Yes, fundamentals provide a floor, but an extremely thin one. The risk-reward here leans bearish in the near term. Do you think the same?
Stock Market Forecast | BTC TSLA NVDA AAPL AMZN META MSFTWelcome to your essential weekly guide for navigating the dynamic stock market!
0:00 Weekly Stock Market Outlook (SPY, QQQ, Bitcoin, MAG 7) CME_MINI:ES1! CME_MINI:NQ1! CRYPTOCAP:BTC
0:18 Sector Rotation & Market Sentiment Breakdown
1:34 Semiconductor ETF PSI – Largest Dark Pool Since 2008
2:31 MAG 7 Dark Pools (Vanguard Growth ETF Breakdown)
3:24 PSQ Short ETF – Is Smart Money Positioning Bearish?
4:47 SPY Technical Analysis – Key Range & Breakout Levels
5:06 QQQ Technical Analysis – Lower Highs, 589 Support Watch
6:19 Bitcoin Technical Analysis – Bear Flag or Trend Reversal?
7:54 Tesla Stock Analysis – 388 Breakdown Risk?
9:39 Meta Stock Analysis – 620 Major Support Level
10:24 Amazon Stock Analysis – 200 Psychological Support
11:23 Microsoft Stock Analysis – 400 Key Breakdown Zone
13:40 Google NASDAQ:GOOGL Stock Analysis – Running Out of Momentum?
15:16 Apple Stock Analysis – 250 Support & Range Trade
17:01 Nvidia Stock Analysis – Critical Channel Break Watch
18:15 Market Outlook & What Could Trigger Volatility
US10Y Daily priceaction and directional bias.US10Y is the yield on the U.S .10-year treasury notes government debt security maturing in 10 years that serves as a global benchmark for interest rates, reflecting investors expectations on growth ,inflation and federal reserve policy.
The US10Y represents the effective return investors demand to lend to united states government for a decade(10years).it moves inversely to bond prices, on technical, when yields are rising which signals stronger growth while falling yields indicates economic caution or safe-haven demand,US10y influences borrowing cost across mortgages, corporate bonds and loans
Coupon rate is the fixed annual interest paid on a bond's face value. For a Treasury note or bond, it's set at issuance and paid semi-annually until maturity.
Key Details
It's calculated as (annual coupon payments / par value) × 100; e.g., a 5% coupon on $1,000 par pays $50 yearly ($25 twice).
Unlike yield, which fluctuates with market price, the coupon remains constant—higher coupons trade at premiums when yields fall.
Bond prices and yields have an inverse relationship. When yields rise, prices fall, and vice versa, due to the fixed coupon payments relative to market rates.
Why Inverse?
Fixed coupons mean higher market yields make existing bonds less attractive, forcing sellers to discount prices for competitive returns.
Lower yields increase demand for higher-coupon bonds, driving prices above par (premium).
US10Y affect DAX40,the DAX40 is the German benchmark index of 40 major stocks, through global yield spillovers and capital flows.
When the US10Y is higher and bullish ,it strengthens the dollar index and pressure Eurozone borrowing, this makes U.S assets more attractive and weighing on European equities like the DAX40.
The US10Y bearish drop can be seen as supporting DAX by easing ECB policy constraints and boosting risk appetite.
So coming week trading US10Y along side DAX40.
the market structure of the US10Y is giving us a sell vibes and it could drop below 4.0% this month .
though we have an ascending trendline on daily that should serve as support to enable us get a retest and sell below 4.0% on possible breakout of trend.
#US10 #US10 #BONDS
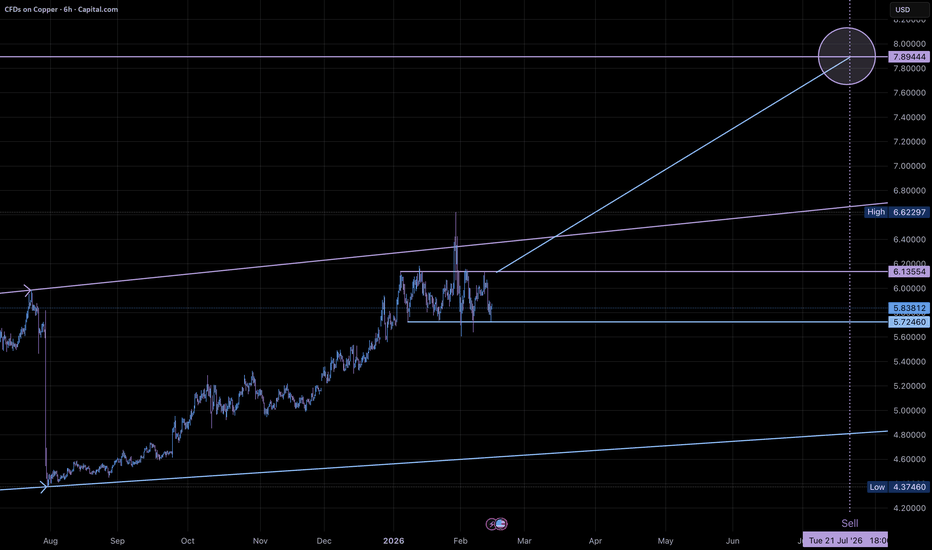
Copper to ~$7.90 (+35%)copper is in creating a bullish flag, with several touches on the support and resistance.
and a measured move to about $7.90, which is about a 35% move.
With more touches the the support than resistance. We could see a break down, but if the Bull Flag plays out, we could see a significant move up.
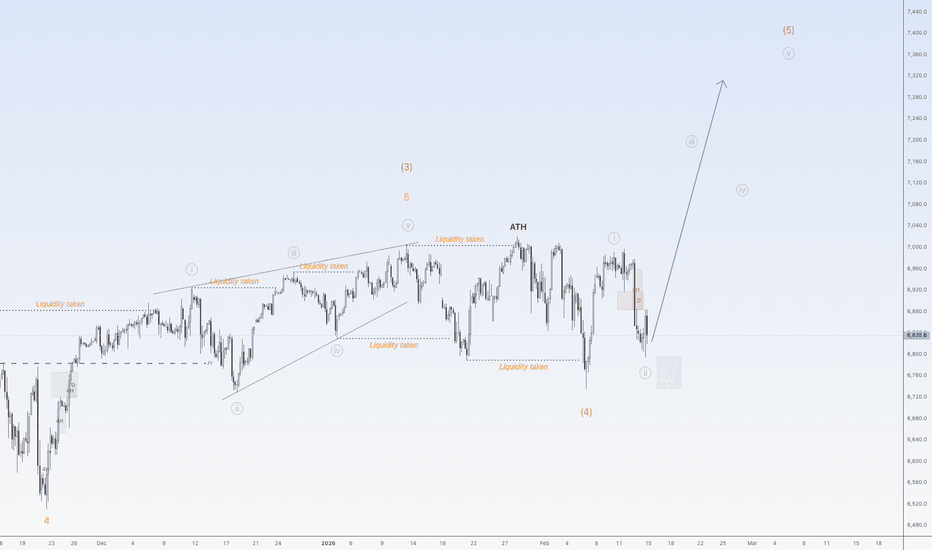
S&P 500 (SPX): Price At Trendline Support, Aims For 7,000 The S&P 500 (SPX) closed at 6,836.18 on Friday February, edging up slightly by 3.41 points after a volatile trading session. despite this minor gain, the index ended the week down at 1.4%, marking its worst weekly performance so far.
Meanwhile, inflation data provided early support, with the consumer price index (CPI) rising to 0.2% in January (2.4% annually).
In respect of the structure, the market is in uptrend momentum channel, which price is presently at the demand trendline as we anticipate bullish rise to 7,000 from here.
Thanks for reading.
ZKCUSDT Forming Bullish WaveZKCUSDT is forming a clear bullish wave pattern, a classic bullish reversal signal that often indicates an upcoming breakout. The price has been consolidating within a narrowing range, suggesting that selling pressure is weakening while buyers are beginning to regain control. With consistent volume confirming accumulation at lower levels, the setup hints at a potential bullish breakout soon. The projected move could lead to an impressive gain of around 140% to 150% once the price breaks above the wedge resistance.
This bullish wave pattern is typically seen at the end of downtrends or corrective phases, and it represents a potential shift in market sentiment from bearish to bullish. Traders closely watching ZKCUSDT are noting the strengthening momentum as it nears a breakout zone. The good trading volume adds confidence to this pattern, showing that market participants are positioning early in anticipation of a reversal.
Investors’ growing interest in ZKCUSDT reflects rising confidence in the project’s long-term fundamentals and current technical strength. If the breakout confirms with sustained volume, this could mark the start of a fresh bullish leg. Traders might find this a valuable setup for medium-term gains, especially as the wave pattern completes and buying momentum accelerates.
✅ Show your support by hitting the like button and
✅ Leaving a comment below! (What is your opinion about this Coin?)
Your feedback and engagement keep me inspired to share more insightful market analysis with you!
Carvana - What’s Next?Let’s continue our outlook on Carvana stock.
In the previous idea, Wave C was pinpointed accurately:
So, what’s next?
The broader chart structure that started in 2023 looks fully completed, with all five waves already in place.
This indicates the market has now shifted into a corrective phase.
The price action since January 27 resembles a double zigzag and still looks unfinished, with roughly 7-12% of potential movement left.
Looking ahead, a short-term push up toward the 363 area is possible:
From there, price may climb back to the peak before a more significant move down.
Another scenario could see price head straight down to the start of the fifth wave.
Conclusion:
The main move is expected to be to the downside.
Price should return to the beginning of Wave 5 .
Preliminary targets:
244
186
---
Subscribe and leave a comment.
You’ll get new ideas faster than anyone else.
---
The MYX symbol will soon go to the bottom of hell (1D)This analysis is an update of the previous analysis that you can find in the related ideas section.
Wave B took a significant amount of time to develop, forming a prolonged corrective structure that likely caused uncertainty and consolidation across the market. However, based on the current structure and price behavior, Wave B now appears to be complete.
At this stage, the market seems to have transitioned into Wave C typically the strongest and most impulsive leg of a corrective pattern. Wave C is often characterized by sharp momentum, expansion in volatility, and aggressive selling pressure. The current price action supports this scenario, as we are seeing signs of increasing bearish strength and structural breakdown.
With price now positioned in what looks like a powerful Wave C to the downside, every upward move or corrective bounce should be viewed as a potential shorting opportunity rather than a reversal signal. These pullbacks are likely to offer better risk-to-reward entries for short positions, especially when aligned with resistance zones, liquidity areas, or Fibonacci retracement levels.
Traders should avoid counter-trend longs in this phase unless there is clear structural confirmation of invalidation. The dominant bias remains bearish as long as the structure of Wave C remains intact.
As always, risk management is essential. Wait for confirmations on lower timeframes if needed, manage position sizing properly, and trade the structure not the emotions.
If you have a coin or altcoin you want analyzed, first hit the like button and then comment its name so I can review it for you.
This is not a trade setup, as it has no precise stop-loss, stop, or target. I do not publish my trade setups here
S&P500 should go up nowHi traders,
Last week SPX500USD went up to finish the impulse wave and after that price made a sharp correction (wave 2 of red wave 5?).
So next week we should see the next impulsive wave up or the wavecount is invalidated.
Let's see what the market does and react.
Trade idea: Wait for an impulsive wave up and a correction down. After a change in orderflow to bullish on a lower timeframe you could trade longs.
This shared post is only my point of view on what could be the next move in this pair based on my technical analysis.
But I react and trade on what I see in the chart, not what I've predicted or expect.
Manage your emotions, trade your edge!
Eduwave
XTI Crude Oil – 4H StructureXTI Crude Oil – 4H Structure
Crude oil has broken the rising trendline, signaling structural weakness. Price is now trading below 62.16, converting the level into resistance.
Technical Reading
• Trendline break → bullish structure invalidated
• Below 62.16 → sellers maintain control
• No acceptance back above resistance → downside pressure intact
While price remains below this zone, the probability favors continuation toward 60.13.
Bullish Shift Conditions
• Clean 4H close above 62.16
• Price acceptance above resistance
• Momentum follow-through
Until then, bias remains bearish.
— Avo.Trades
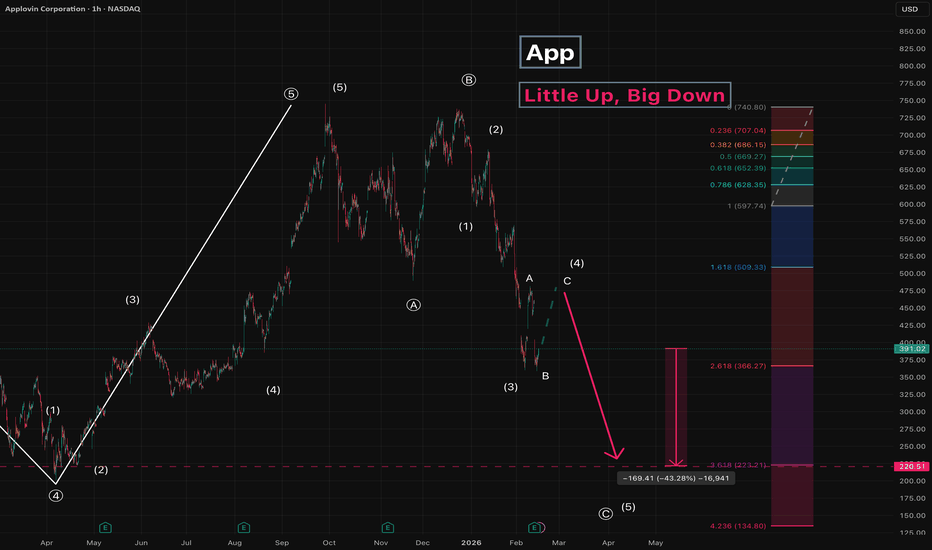
App - Little Up, Big DownSince December 2025, we’ve been drawing the impulse in Wave C .
We’re currently in Wave 4 of that impulse.
Initially, we’re drawing subwave C within the third wave of the impulse,
with a potential move of 13-17% or more.
After that, a downward move as the fifth wave of the impulse is expected.
Key target: around 220
Potential move from the current level: 43%
---
Subscribe and leave a comment.
You’ll get new ideas faster than anyone else.
---
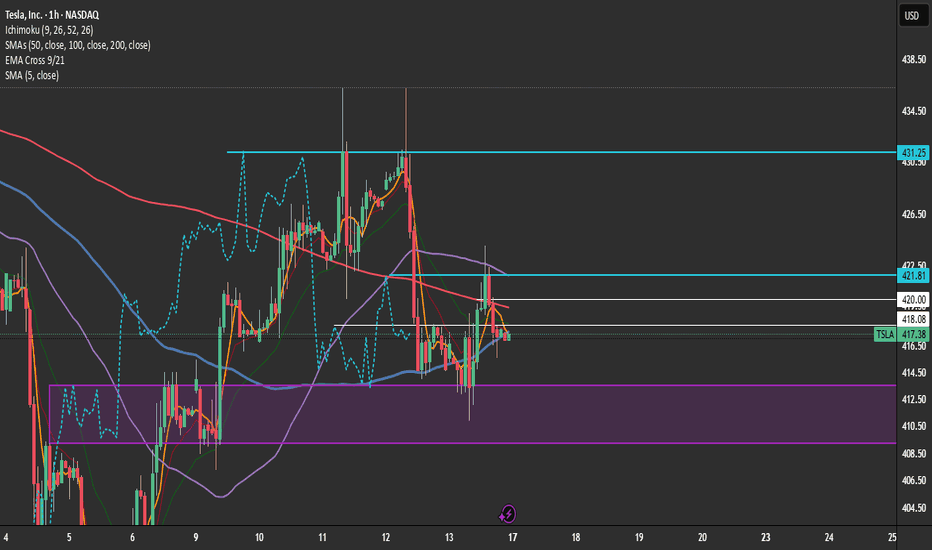
Price Action Blocks and Trading Levels to IndicatorsIn this video, I’m not teaching a strategy as much as I’m walking beside you inside the process.
You’re watching me map a trade in real time — not just the mechanics of entry and exit — but the thought pattern behind it. The patience. The restraint. The conversation happening internally before capital is ever deployed.
Because trading, at its highest level, is not technical. It is personal.
As price moves, I’m outlining the path to the next level — where the market is most likely to travel if momentum holds. Not predicting. Not forcing. Simply reading what is already unfolding.
You’ll see the levels laid out clearly — structure points where decisions live. Areas where opportunity either expands… or disappears.
I talk through my Go / No-Go zones — the places where a trade is either validated or immediately disqualified. There is power in knowing where not to participate. Preservation of capital is preservation of peace.
You’ll also hear me reference what I call Right or Right Out trades — positions where my stop sits directly at my entry. No wiggle room. No hope trades. Price moves in alignment quickly… or I step aside without damage.
This is not aggression.
This is alignment.
The Lens I’m Viewing Through
My charts are structured, but they are not cluttered.
I use tools to create context, not dependency:
• Bollinger Bands to observe volatility breathing
• Ichimoku Cloud — with a heavy respect for the Lagging Span — to confirm whether price has clean air or friction behind it
• The 50, 100, and 200 SMA to understand macro trend structure
• The 5 SMA to feel immediate momentum
• The 9 / 21 EMA cross to time rhythm shifts
I do not use volume.
I do not use time grids.
I am watching behavior. Not noise.
Timeframes
I’m observing price across three lenses:
Hourly for directional posture.
15-minute for formation.
5-minute for precision.
Each timeframe is a conversation.
When they agree, clarity expands.
The Deeper Message
But this video is not about indicators.
It is about trust.
Trusting your preparation.
Trusting your ability to read structure.
Trusting the integration of your mind, heart, and gut when you engage risk.
Prosperity is not created from forcing trades.
It is created from alignment with opportunity.
Abundance comes from discipline… not frequency.
My intention in sharing this inside the community is simple:
To empower you to find your setup.
To refine your lens.
To build a relationship with the market that is grounded, calm, and self-directed.
Because when you learn to read opportunity clearly…
You stop chasing money.
And you start participating in prosperity.
Gold on the 4H is basically sitting at a decision point.Gold on the 4H is basically sitting at a decision point.
5081 is the key intraday structure level right now. Price is reacting there multiple times, which tells you the market is still undecided, not trending cleanly.
If gold stays under 5081, sellers are still in control short-term and another push down / retest becomes the higher-probability scenario. The market would simply be respecting that level as resistance instead of building strength above it.
If we start getting clean 4H closes above 5081, then the tone shifts and upside continuation toward the next resistance zone becomes more realistic.
For now, under 5081 → pressure remains bearish, expect retest behavior. Above it → momentum story changes. Classic level, classic reaction.
Range-bound trading. Buy on dips.On Friday, gold experienced a powerful one-sided surge, rising sharply from a low of around $4887 in the Asian session, breaking through the $5000 mark and reaching a high of $5045, a single-day increase of approximately $158, igniting bullish sentiment in the market.
The trend opened lower but continued to rise, exhibiting a strong upward pattern. Firstly, the convergence of safe-haven demand and expectations of interest rate cuts, coupled with continued global geopolitical tensions leading to an influx of funds into gold as a safe-haven asset, and the renewed market expectation of a Federal Reserve rate cut this year, created a double boost, propelling gold prices to new heights.
From a daily chart perspective, gold has currently stabilized above the key support level of $5000, forming a valid top-to-bottom reversal trend, making this a significant support level. While the moving average system is in a bullish alignment, the short-term deviation from the moving averages is too far, suggesting a potential for a pullback after the initial surge. The key resistance level remains at the previous downtrend line around $5100. Continued consolidation within this range is possible, but a breakout could lead to further gains.
For short-term trading, it is recommended to buy when the price retraces to around 5000, with a target of 5050-5080 and a stop loss at 4980.I will post more strategies in the channel.
EURUSD — Watching the Midline for a Breakout SignalThe euro deserves a spot on this week’s watchlist. For nearly a week now, on the 15-minute timeframe, price has been stuck inside a range and has not been able to properly break and hold above the range midline.
We remain buyers on EURUSD, as the higher timeframe trend is still bullish, and we are looking for long signals.
If price can close above the range midline — preferably with a strong 1-hour candle — it could act as a solid trigger for a long position and potentially lead to a breakout from the top of the range.
However, if the range breaks to the downside, we will need to reassess the structure and carefully evaluate the selling momentum before making any decisions.
#Pouyanfa 🔥
