Toncoin 5X Long with 1,400% profits potentialToncoin changed. The chart changed but not its potential. It is very interesting.
We have a lower low based on the candle's wick, last week's candle. This candle, ignoring the October 2025 flush, hit the lowest price since early June 2023. The price level that started the previous bullish phase.
The candle close, two weeks back, produced a clear higher low long-term, vs late July 2023.
TONUSDT. Last week produced a strong reversal signal in the form of a candlestick with a long lower wick, and this week we have the same. A long lower wick with the action happening at the top of the candle as we reach the weekend.
This will be an extremely bullish weekend. Get it right. Make no mistakes. It will be the start of the first 2026 bullish market phase. It will be a long-term process. It is set to last. The bear market is over. Growth long-term.
Here the full trade-numbers for Toncoin, a true gem:
_____
LONG TONUSDT
Leverage: 5X
Potential: 1400%
Allocation: 3%
Entry zone: $1.30 - $1.45
Targets:
1) $1.74
2) $1.92
3) $2.12
4) $2.43
5) $2.74
6) $3.19
7) $3.75
8) $4.37
9) $4.75
10) $5.37
Stop: Close weekly below $1.28
_____
Thank you for reading. Your continued support is highly appreciated.
I am here for you long-term.
All publications are 100% original human-based. No robots or AI. Plain old creative thinking. Simple, true and classic hard work.
It is all done for your entertainment.
If you enjoy the content, make sure to follow. There is always more. Hundreds and hundreds of charts each and every month.
Namaste.
Trend Analysis

US30 Trade Set Up Feb 13 2026Price is overall bearish on the 4h but making HL on the 1h and 15m so i if prices inverts the 1h FVG i will expect price to trade higher to fill the 4h FVG otherwise if price respects the 1h FVG, makes bearish structure on the 5m with a 1m-5m IFVG/CISD i will take sells to London lows

GBPUSD – 2H timeframe....GBPUSD – 2H timeframe.
I can see:
Head & Shoulders pattern
Neckline already breaking
Price below short-term structure
Inside / near Ichimoku cloud → momentum shifting bearish
📉 Bearish Setup (Primary Scenario)
Current price around 1.3625
🎯 Sell Targets:
TP1: 1.3560 (recent support)
TP2: 1.3500 (psychological + structure)
TP3: 1.3450 (measured move of H&S – matches my lower marked target)
📏 Measured Move Logic:
Head to neckline projected downward ≈ 150–180 pips → Gives target around 1.3450 area
❌ Invalidation
2H close above 1.3700
Strong break above right shoulder high
📌 My View
Neckline break + cloud resistance = downside likely
Best continuation below 1.3600

HKG33 H4 | Falling Towards Key SupportBased on the H4 chart analysis, we could see the price fall to our buy entry level of 26,218.97, which is an overlap support.
Our stop loss is set at 25,891.89, which is a pullback support that aligns with the 127.2% Fibonacci extension and the 78.6% Fibonacci projection.
Our take profit is set at 27,011.21, which is a pullback resistance.
High Risk Investment Warning
Stratos Markets Limited fxcm.com Stratos Europe Ltd fxcm.com
CFDs are complex instruments and come with a high risk of losing money rapidly due to leverage. 69% of retail investor accounts lose money when trading CFDs with this provider. You should consider whether you understand how CFDs work and whether you can afford to take the high risk of losing your money.
Stratos Global LLC fxcm.com Losses can exceed deposits.
Please be advised that the information presented on TradingView is provided to FXCM (‘Company’, ‘we’) by a third-party provider (‘TFA Global Pte Ltd’). Please be reminded that you are solely responsible for the trading decisions on your account. Any information and/or content is intended entirely for research, educational and informational purposes only and does not constitute investment or consultation advice or investment strategy. The information is not tailored to the investment needs of any specific person and therefore does not involve a consideration of any of the investment objectives, financial situation or needs of any viewer that may receive it. Past performance is not a reliable indicator of future results. Actual results may differ materially from those anticipated in forward-looking or past performance statements. We assume no liability as to the accuracy or completeness of any of the information and/or content provided herein and the Company cannot be held responsible for any omission, mistake nor for any loss or damage including without limitation to any loss of profit which may arise from reliance on any information supplied by TFA Global Pte Ltd.
Stratos Trading Pty. Limited fxcm.com
Trading FX/CFDs carries significant risks. FXCM AU (AFSL 309763), please read the Financial Services Guide, Product Disclosure Statement, Target Market Determination and Terms of Business at fxcm.com

XAUUSD Intraday Bias | Channel Resistance Reaction (30M)Gold is currently trading within a rising channel structure on the 30-minute timeframe. Price has recently reacted near the upper boundary of the channel, where supply pressure appears to be emerging. This area is being treated as a potential reaction zone rather than confirmed breakout continuation.
Execution Reference: 5021
Structure Invalidation Level: 5031
Projected Liquidity Zone: 4971
As long as price remains below the defined invalidation level, the short-term expectation favors a corrective rotation toward the lower channel liquidity near 4971.
A sustained move and acceptance above 5031 would weaken the immediate corrective outlook and may indicate structural continuation instead.
Position management should remain aligned with predefined risk parameters and disciplined capital control.
This analysis reflects a technical interpretation of current price structure and is shared strictly for educational and discussion purposes. It does not constitute financial or investment advice. Market conditions may change without notice, and all trade decisions remain the responsibility of the individual trader.

ZEC 1W Update: Zooming out to learn moreZEC remains in a corrective phase on the weekly timeframe following the blow-off top toward the 700 region and the sharp rejection that followed. The key structural shift occurred with the loss of 300, which had acted as a major breakout and acceptance level. Since losing that pivot, price has continued to bleed lower and is now consolidating in the mid-200s, showing no strong impulsive bounce yet.
Momentum has clearly cooled, and the market is transitioning from expansion into redistribution or deeper correction. The current 220–240 area is attempting to act as a short-term stabilization zone, but structurally the chart does not regain strength unless ZEC can reclaim 300 on a weekly closing basis. Without that reclaim, rallies are likely to be corrective in nature.
On the downside, continued acceptance below 230 opens the door for a move into prior consolidation zones from before the breakout, which would imply a more prolonged digestion phase. That said, the larger cycle context still suggests this could be a volatile retracement following an extreme vertical move rather than a full macro reversal. The next few weekly closes are critical in determining whether ZEC builds a higher low here or continues unwinding the parabolic advance.

DXY H4 | Could We See A Bounce?The price is falling towards our buy entry level at 98.15, which is a pullback support that aligns with the 61.8% Fibonacci retracement.
Our stop loss is set at 95.40, which is a swing low support.
Our take profit is set at 96.84. whichis a pullback resistance.
High Risk Investment Warning
Stratos Markets Limited fxcm.com Stratos Europe Ltd fxcm.com
CFDs are complex instruments and come with a high risk of losing money rapidly due to leverage. 69% of retail investor accounts lose money when trading CFDs with this provider. You should consider whether you understand how CFDs work and whether you can afford to take the high risk of losing your money.
Stratos Global LLC fxcm.com Losses can exceed deposits.
Please be advised that the information presented on TradingView is provided to FXCM (‘Company’, ‘we’) by a third-party provider (‘TFA Global Pte Ltd’). Please be reminded that you are solely responsible for the trading decisions on your account. Any information and/or content is intended entirely for research, educational and informational purposes only and does not constitute investment or consultation advice or investment strategy. The information is not tailored to the investment needs of any specific person and therefore does not involve a consideration of any of the investment objectives, financial situation or needs of any viewer that may receive it. Past performance is not a reliable indicator of future results. Actual results may differ materially from those anticipated in forward-looking or past performance statements. We assume no liability as to the accuracy or completeness of any of the information and/or content provided herein and the Company cannot be held responsible for any omission, mistake nor for any loss or damage including without limitation to any loss of profit which may arise from reliance on any information supplied by TFA Global Pte Ltd.
Stratos Trading Pty. Limited fxcm.com
Trading FX/CFDs carries significant risks. FXCM AU (AFSL 309763), please read the Financial Services Guide, Product Disclosure Statement, Target Market Determination and Terms of Business at fxcm.com


30Y Bonds - Lowering Of Interest RatesWhen Looking At The Bond Market, The Higher Timeframe Perspective Are Important For Studying Price Dynamics; How Price Moves From Premium To Discount.
Looking Out For A Bullish Draw To Weekly Buyside @ 119.20 With Target 1 Being Daily Buystops @ 118.14 Going Into Next Week

GOLD #2– Ascending Triangle & HTF Pivot Confluence H2🟡 Market Structure :
Gold is trading within a medium-term bullish structure, currently compressing below a major resistance.
On the 2H timeframe, we clearly see an ascending triangle forming:
• Rising dynamic trendline support
• Horizontal resistance ceiling
The thicker pivot lines (Yearly > Monthly > Weekly > Daily) indicate higher-timeframe importance.
The thickest levels represent institutional zones.
➡️ Compression below HTF resistance = potential breakout setup.
🟡 Key Zones – HTF Pivots & Structure :
Major Resistance Zone : 5,100 – 5,120
Confluence of:
• Monthly Pivot
• Horizontal resistance
• Triangle upper boundary
Monthly Resistance / OB Target : ~5,550 – 5,600
Triangle Dynamic Support : 4,980 – 4,950
The thicker the pivot line, the stronger the level —
Yearly and Monthly pivots dominate the bias.
📝 Trading Plan :
🟡 Strategy 1 – Bullish Breakout
🟡 Entry : confirmed break and hold above 5,120
🟢 TP1 : 5,270 – 5,300
🟢 TP2 : 5,550 – 5,600 (Monthly resistance)
🔴 SL / Invalidation : below 5,040
Structure logic → compression leads to expansion.
🟡 Strategy 2 – Pullback Buy
🟡 Entry : retracement into 4,980 – 4,950 (triangle support)
🟢 TP : return to 5,100 zone
🔴 SL : below 4,900
Buy support, not resistance.
🧠 Core Logic In a bullish compression market :
Do not short directly into major HTF resistance without structural breakdown.
Thicker pivots = institutional liquidity levels.
Ascending triangle + Monthly/Yearly confluence =
Potential accumulation before expansion.
🎯 Summary :
2H Ascending Triangle + HTF Pivot Confluence =
Compression → Breakout potential → Expansion toward 5,500+
Bias remains bullish as long as 4,950 holds.

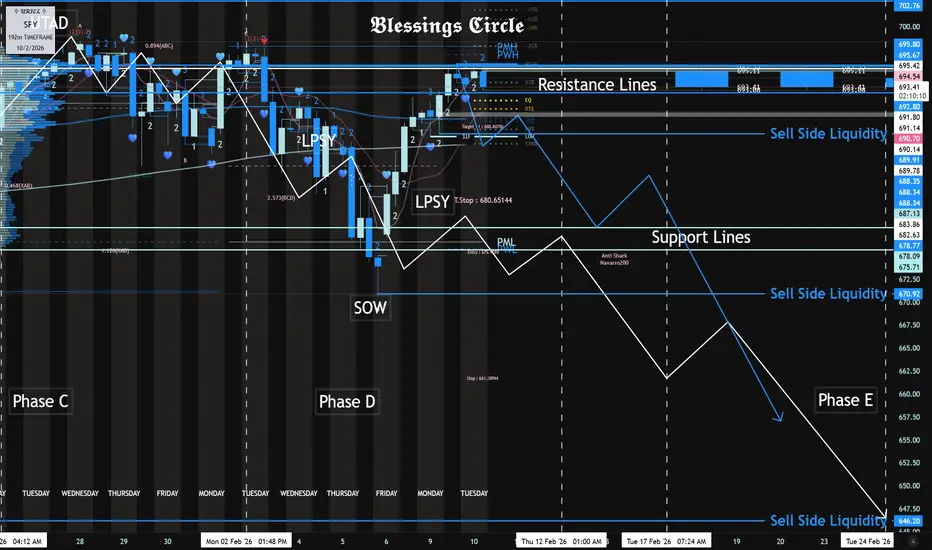
SPY Distribution Schematic Sub 650 by EOMAs Long As 695.80 - 695.67 Resistance Is Respected Today.
The Sells Targets Are As Follows:
SPY Sub 650 by Late Feb.
SPY Sub 600 by End of March.
Part Two:
XAUUSD – Bearish Rejection from Supply Zone (Short Setup)XAUUSD | Quick Analysis – Short Scenario
Price is currently trading inside a strong supply zone and clearly respecting the descending trendline.
The recent bullish move is only a corrective pullback within a bearish structure, not a trend reversal.
📍 Entry area: 5017
On a retest below the current supply zone.
🛑 Stop loss: 5090
Above the most recent high formed inside the supply zone.
🎯 Target:
The lower demand zone shown on the chart (around 4683).
🧠 Trade idea:
Supply rejection + bearish trendline + weak breakout
= higher probability of continuation to the downside.

BTC/USDT | Going back above 70,000? (READ THE CAPTION)After sweeping the initial Buyside Liquidity, BTCUSDT experienced a small correction and then went back higher to 69,482. Currently it's being traded at 69,100. If BTC stabilizes above 69,000, it could go higher to 71,000. But if it fails to hold above there in the coming 2 to 4 hours, it could drop lower to 67,000. However, as long as BTC stays above 66,000, it can still go and retest the resistances above to reach 71,000.
Targets for BTC, should it stay above 69,000: 69,500, 70,000, 70,500 and 71,000.
If it fails: 68,000, 67,500 and 67,000.

ADAUSD remains under bearish pressure below 3044 levelThe ADAUSD pair continues to display a bearish outlook, in line with the prevailing downward trend. Recent price action suggests a oversold bounce back, potentially setting up for another move lower if resistance holds.
Key Level: 3044
This zone, previously a consolidation area, now acts as a significant resistance level.
A failed test and rejection at 3044 would likely resume the bearish momentum.
Downside targets include:
2280 – Initial support
2150 – Intermediate support
2024 – Longer-term support level
Bullish Scenario (breakout above 3044):
A confirmed breakout and daily close above 3044 would invalidate the bearish setup.
In that case, potential upside resistance levels are:
3174 – First resistance
3340 – Further upside target
Conclusion
ADAUSD remains under bearish pressure, with the 3044 level acting as a key inflection point. As long as the price remains below this level, the bias favours further downside. Traders should watch for price confirmation around that level to assess the next move.
This communication is for informational purposes only and should not be viewed as any form of recommendation as to a particular course of action or as investment advice. It is not intended as an offer or solicitation for the purchase or sale of any financial instrument or as an official confirmation of any transaction. Opinions, estimates and assumptions expressed herein are made as of the date of this communication and are subject to change without notice. This communication has been prepared based upon information, including market prices, data and other information, believed to be reliable; however, Trade Nation does not warrant its completeness or accuracy. All market prices and market data contained in or attached to this communication are indicative and subject to change without notice.

XAGUSD: downside opportunuties🛠 Technical Analysis: On the H4 chart, Silver (XAGUSD) is consolidating after a sharp selloff from the recent peak. Price is currently capped by a descending trendline and a key resistance zone overhead, while the lower boundary of the formation is acting as short-term support. The Moving Averages show mixed conditions: price is holding above the fast MA, but remains below the higher-period averages, keeping the broader bias pressured. This compression typically precedes expansion, and a rejection/false breakout from the upper wedge line would reinforce the bearish continuation scenario. A confirmed breakdown from the pattern opens room for a move into the next major support area around 69–71. If momentum accelerates, the lower support band becomes the next downside objective near 64.
———————————————
❗️Trade Parameters (SELL)
———————————————
➡️ Entry Point: Approx. 81.00
🎯 Take Profit: 69.43
🔴 Stop Loss: 90.14
⚠️ Disclaimer: This is a potential trade idea based on current analysis; market conditions and price direction are subject to change based on news factors and volatility.

BTCUSD: Bearish Logscale Butterfly with Bearish RSI DivergenceJul 18, 2025:
Bitcoin has been setting up at the log adjusted 1.902 HOP for a Type 2 retest of the Logscale Bearish Butterfly for the last few months but recently pushed a bit above it and appears to be settling at the linear 1.902 HOP of the local price around the $118,000 area. Between $104,000 and $118,000 is a zone of linear of logscale Fibonacci confluence pointing towards the being the area to look for a more major downside reaction than we got off the initial Type 1 Reaction 1.618 PCZ reversal in 2021.
The most recent push to the linear 1.902 seems to have allowed the structure of the RSI to develop a more Bearishly Distributive and Divergent curve, while the MACD is in the process of developing a 2nd layer of Bearish Divergence. Ultimately at these highs we'd like to see the RSI weaken further as price begins to settle back within the 1.902 bearish zone of confluence before being more sure of downside.
Additionally, during the push higher, longer dated bearish call interest came in around the 123-125k levels which to me signals a newly formed hard resistance that will be hard to gap over and will make failure here more likely. I think if we do see failure we can of course fill the CME gap down at 91.8k, but ultimately the true first target is down at 30k with max targets down near the 0.886 around $4.8k and the 100 percent retrace down at around $3,123.51 over the coming quarters.
Taking into account the wide range in downside exposure I think the best and safest way to speculate on this downside would be through the buying of the March, 27th, 2026 Puts at the $95,000 strike or the closest IBIT equivalent March, 20th, 2026 Puts at the 58 strike this will give plenty of time, as well as plenty of range for the puts to appreciate 10's of thousands of dollars in value as BTC trades down into the targeted zones below it.
02/05/2026
Trade closed manually
Closed for now; details here:
www.tradingview.com
This is a Repost: because the original post from Jul 18, 2025, got taken down by a TradingView moderator for having a custom moving average indicator that was not made public. Despite the moving averages only just being simply and exponential moving averages anyone could add to their charts. In light of this issue I have published the multi-moving average indicator so hopefully that should stop mods from taking down past and future posts.
For the time being I will keep this post in neutral status as we've already moved down significantly, are in the oversold zones in the RSI, and are likely due for a retrace back up which I will go into details about on my next post which will be a repost from last week's idea which was also taken down by a moderator.

XAUUSD 2HAfter yesterday’s sharp sell-off, gold is completing a pullback into a key resistance zone aligned with Fibonacci levels.
Based on the current price action, a potential corrective move to the downside is likely.

$QQQ WEEKLY BREAKDOWN: BELOW 20WMA w/200DMA TARGET - Critical🚨 MARKET ALERT: The Weekly Breakdown Is Here - Critical Week and Critical Levels to Watch 🚨
NASDAQ:QQQ AMEX:SPY NASDAQ:NVDA NASDAQ:TSLA NASDAQ:AAPL
Good Morning ☀️
The Weekly chart is screaming danger and multiple timeframes are confirming bearish momentum. Here’s the complete technical breakdown and what you need to know going into next week.
CRITICAL LEVELS BREAKING DOWN:
NASDAQ:QQQ has closed BELOW the 20WMA - a rare and significant signal that typically precedes further downside. We’re already under the 100D SMA for the second time in 10 days, and my proprietary 10SMA/10EMA cross just flipped BEARISH (black line crossed pink from the underside). The 50WMA sits at $562, which represents approximately -6.5% downside from current levels. If we don’t bounce next week and close above my support Ribbon, significant downside remains on the table.
TODAY’S SETUP - FRIDAY DECISION POINT:
Bottom could form TODAY if market makers decide to bounce it - but it’s Friday, so there’s only ONE session left to work with. If bulls want to save this market structure, they need to show up immediately. However, last week’s close under the 20SMA is continuing into this week, and momentum remains decisively DOWN across multiple timeframes.
MY CURRENT DIRECTIONAL BIAS:
I’m staying BEARISH until we tap the 200D SMA below us (~$573 area on the daily timeframe). I believe we’ll crack down to test it, but here’s the critical distinction: if we simply TAG the 200D SMA and bounce, that’s a potential bottoming structure. BUT - if we LOSE the 200D SMA with conviction and start closing below it, that’s when a legitimate bear market begins. At that point, AMEX:SPY , NASDAQ:QQQ , and AMEX:IWM would all be in serious structural trouble.
A RISK BEARS AREN’T DISCUSSING:
I’m a bear based on the technical evidence, but I’m genuinely concerned about being in bounce territory. You can lose MASSIVE capital fighting relief rallies in oversold conditions. This is the danger zone where conviction needs to be balanced with discipline. Dead cat bounces can be vicious, and shorts can get squeezed hard when positioning gets too one-sided. This is where risk management matters MORE than directional conviction.
NEXT WEEK’S TRADING STRATEGY:
My plan is simple: PATIENCE, HEDGE POSITIONS, and LET THE MARKET SHOW ITS HAND. No heroics. No FOMO. No emotional revenge trading. I’m waiting for clear confirmation before loading either shorts OR calls. The worst trades happen when you force a position before the setup is truly there. Next week is about preservation and positioning - not speculation.
HISTORICAL ANALOG - 2008 PATTERN:
I’m tracking a 2008 market analog that’s eerily similar to our current structure:
• Sharp dive into the 200D SMA
• Sideways consolidation for approximately one month• THEN the real directional move reveals itself
We’re potentially in the “dive” phase right now. The question is whether we get the sideways chop or if this breakdown accelerates. The 200D SMA will be the ultimate truth-teller.
THE TECHNICAL VERDICT:
📉 Weekly Timeframe = BROKEN (closed below 20WMA)
📉 Daily Timeframe = BROKEN (under 100D SMA)
📉 My Custom Indicators = BEARISH (10SMA/10EMA cross confirmed)
However, I’m not chasing this breakdown. Risk/reward doesn’t justify aggressive short positioning until we see how price reacts at the 200D SMA. That’s the line in the sand that determines whether this is a healthy correction or the beginning of something more serious.
BOTTOM LINE:
Stay nimble, stay disciplined, and respect the price action. Let the market tell you where it wants to go - don’t impose your bias on it. The best traders wait for their pitch. This might be a wait-and-see week.
Related Tickers: NASDAQ:SQQQ NASDAQ:TQQQ TVC:VIX AMEX:GLD NASDAQ:TLT AMEX:DIA AMEX:IWM
What levels are you watching? Drop your analysis in the comments below.

US30 | Inflation Report Could Trigger VolatilityUS30 | CPI Data Set to Drive Next Major Move
The Dow pulled back from the all-time high near 50,470, in line with the previous outlook. Markets are now waiting for the U.S. CPI release, expected at 2.5%, which could trigger strong volatility.
Technical Outlook
The broader structure currently leans bearish, with price trading near the 49240 pivot.
📊 CPI Scenario
• Below 2.5% → bullish recovery toward 49,680 and 49,990
• Above 2.5% → bearish continuation toward 48,840 and 48,400
The market currently shows a bearish bias, with expectations leaning toward a higher CPI reading.
Key Levels
• Pivot: 49,240
• Support: 48,840 – 48,400
• Resistance: 49,680 – 49,990

Can BTC Sell off here?The market is downtrending and created a Lower Low. The last "buy to sell" candle before the push down was not mitigated. Confirmations are the downward impulse lines up with my Fib levels of .80- .886 and the reversal head and shoulders pattern with the clear close below the change of direction on higher timeframes. Yellow zone is the primary entry target with highest darker zones as secondary entries. Take Profit will align with equal lows but needs re-evaluation as market potential pulls back up into entry area. Will re-evaluate on higher timeframes for Take profit 2 and 3 zones.

WTI Crude Oil - Bullish EW Count - 11/02/2026This is not financial advice, always do your own research.
As global tension rises, one must consider a position in crude oil - and what a tempting position it is to monitor currently. It may be a little early, but soon it may be too late; crude oil moves quickly when it's ready.
A few technical points to analyse:
Complete counts of waves 1-5 and ABC (consistent on lower timeframes).
Descending wedge formation - giving TP1 target for a Bulkowski-defined price target.
MACD indicator is showing a prime signal for a move to the upside - moving averages potentially crossing on monthly close with histogram close to switching green (this idea is essentially frontrunning the signal).
Entry Zone: The potential entry zone in green is marked wide - oil is a volatile commodity and it's impossible to know if this will be a clean move to the upside, unless receiving some sort of catalyst event to push it. At the moment, we see a plausible count on lower timeframes for this last bounce in Dec 2025 leading to an impulsive 5 waves, however there are also counts for both above/below current price:
TP1: Based on descending wedge formation's price target.
TP2: Based on potential micro WXY target at 0.5 fib extension:
TP3: Based on potential micro ABC target at 0.618 fib extension and above - this increases the probability for a macro ABC as shown:
TP4: Based on potential motive wave 3 target - a minimum of 1 fib extension from C. This would imply another macro wave 4 and 5 incoming thereafter:
Previous structure:
As seen below, oil had previously been in a large Wolfe wave formation - marking the entry in March 2020 and exit upon hitting line AD in February 2022.
Gold is already signalling unrest and lack of economic confidence.
Gold tells the story. Oil will tell the tale.

EURUSD Local Bullish Bias!
HI,Traders !
#EURUSD has made a retest
Of the horizontal support
Level of 1.17914 and we are
Already seeing a bullish rebound
So we will be expecting
A further move up !
Comment and subscribe to help us grow !
