XRPDear Traders
here my analysis for xrp
listen iv been long time in this market and specially xrp i owned it before 50k gains of it
i know how it move in this market , plus the news for xrp and the hype...
be careful of this coin :) it can drop and go up easy
Trend Analysis

Fall to 63k then the start of a bull market Viewing the Bitcoin chart shows that the market is completing its corrective phase, according to the Elliott Wave theory, the market is in the corrective phase of the fourth wave.
On the weekly timeframe, Bitcoin is completing a major 5-wave cycle:
Wave 1: 2020 growth to 2021 cap
Wave 2: Heavy correction to 2022 bottom
Wave 3: The main rally from 2023 to 2025 (the strongest wave)
Wave 4: Current correction
Wave 5: Final wave of upswing k140-160k (upcoming)
Important Fibonacci correction ranges:
0.382 ≈ broke around 85k
0.5 ≈ broke around 70k
0.618 ≈ around 55k
Wave 4 usually corrects between 38% and 61% of wave 3.
So, the area of 55k to 70k is the most logical zone for the end of the correction.
Possible scenario (main)
A scenario that is probable in my opinion
Completion of wave 4 in the range: 55k – 70k
Enter smart money
The start of Wave 5 is explosive
Target wave 5 = 140k - 160k
Negative scenario (unlikely)
If 55k support is lost:
Long-term channel failure
Deeper modification up to: 40k – 45k
But this scenario is currently only if:
A clear break of 55k is valid in the weekly time.
In my opinion, the market will not make a new bottom because now most traders are waiting for Fibo 0.61 (55k), but in this case, market psychology prevents it from reaching this area and the price grows above the range.
A very important point of market psychology
Typically in strong Bitcoin cycles:
When everyone is waiting for 0.618
The market is coming back from 0.382 or 0.5.
Now the majority of traders have their eyes on 55k.
This itself increases the probability of returning from 63k.
In this moment
Bitcoin will attack to 71-73k , faulse breakouts then fall to 63k
or bitcoin will break 71-73k and pump to 85k . (If daily candle close above 71k)

ZECUSDT plan 02-14-26ZECUSDT plan 02-14-26
Currently, the price is heading towards the nearest fresh supply.
The current price rally is in a compression phase.
We'll move down to the 30m timeframe and look for a strong base.
Then, place a pending sell order in that area.

JetBlue- tie with recent lows? Or plowing through all-time highs 1. Mixed Financial Results and Volatility
JetBlue’s Q4 2025 earnings revealed the airline still isn’t consistently profitable — EPS of -$0.49 missed expectations and margins remain negative — yet revenues slightly beat forecasts and unit revenue improved, showing that demand isn’t collapsing.
This duality has created noise in the market — investors don’t know whether to price JetBlue like a turnaround success or a structurally struggling airline.
• Negative margins and cash burn are real.
• Revenue growth is trending in the right direction — RASM prints a small beat.
• Guidance is cautious yet not bleak.
This tug-of-war shows up in recent price behavior — JetBlue saw a multi-day losing streak followed by a bounce, and remains well below its 52-week highs.
2. Price Action: Technical Inflection Point
According to chart data, JBLU’s share price is up sharply in the past month and recently near key intermediate resistance around ~$6.00, but it’s still trading roughly 20–30% lower than its yearly peak.
In technical terms:
• Above shorter-term moving averages — bullish sign, but not yet confirmed.
• Crucial support lies beneath ~5.00 and ~4.80 — breaking below could trigger sellers.
• Resistance around ~$6.00-6.10 — a breakout here would be a clear short-term bullish trigger.
Put simply: the stock is in a pivot zone where failing to hold support could send it down hard, while breaking resistance would shift sentiment sharply bullish.
3. Analyst Sentiment Was Bearish — But Shifting Slightly
Wall Street’s view has leaned bearish or cautious:
• Consensus ratings remain moderate sell/hold with a low average price target near current levels.
• Some firms maintained sell or hold, reflecting weak fundamentals.
However, there are early signs sentiment could be stabilizing — for example, Citi recently upgraded JetBlue to Neutral from Sell, signaling analysts are pricing in some of the turnaround potential.
This kind of divergence between sell-side pessimism and technical demand can set the stage for sharp moves once one side of the market wins conviction.
4. Operational & Strategic Growth Factors
JetBlue isn’t just a story of numbers — there are real business developments that could influence the next market move:
✔ “JetForward” turnaround strategy continues to roll out.
✔ Partnerships like the Blue Sky collaboration with United Airlines improve connectivity and loyalty network value.
✔ Continued domestic traffic recovery.
These structural progress points give bulls something real to anchor optimism on, even if the road isn’t linear.
5. Risk Catalysts Still Linger
Off-airline news — such as safety lawsuits related to an in-flight incident — introduces risk premium and can shake confidence.
Fuel price volatility, industry-wide headwinds, and negative cash flow remain real constraints on sustained growth.
Bottom Line: Why This Moment Matters
Right now, JetBlue’s stock is at a psychological and technical inflection point:
➡ Break Above Resistance (~$6+): Could signal that trend reversals and earnings prospects are gaining traction, attracting momentum buyers and shifting broader sentiment — setting the stage for new highs after extended consolidation.
➡ Break Below Key Support (~$5 and below): Would signify that fundamentals still outweigh optimism, likely retesting recent lows near $4 or even below, validating bearish positioning and trapping longs.
Both outcomes hinge on one thing: whether the market believes JetBlue’s turnaround can translate into real profitability, backed by stronger unit revenue and stabilizing operating metrics.
In essence: this isn’t just another sideways phase — it’s a decision zone. The next concrete move could define JetBlue’s trajectory for months to come.
SOURCES USED ARE BELOW
www.investing.com
www.benzinga.com
www.investing.com
www.benzinga.com
www.moomoo.com
www.barrons.com
www.reuters.com

SILVER My Opinion! BUY!
My dear friends,
SILVER looks like it will make a good move, and here are the details:
The market is trading on 77.528 pivot level.
Bias - Bullish
Technical Indicators: Supper Trend generates a clear long signal while Pivot Point HL is currently determining the overall Bullish trend of the market.
Goal - 81.491
About Used Indicators:
Pivot points are a great way to identify areas of support and resistance, but they work best when combined with other kinds of technical analysis
Disclosure: I am part of Trade Nation's Influencer program and receive a monthly fee for using their TradingView charts in my analysis.
———————————
WISH YOU ALL LUCK

USDCHF - ShortI am anticipating a weak Dollar against the Swiss Franc for a continuation to the downside.

US Dollar: Weak. Wait Patiently For Sell SetupsWelcome back to the Weekly Forex Forecast for the week of Feb. 16-20th.
In this video, we will analyze the following FX market: USD Dollar
The USD is weak, and moved sideways last week. The bearish close on the weekly TF was indicating more weakness to follow going into this weak.
Stay patient, and wait for the market to show a break out above or below last week's range. Let that be your guide.
Sells are where I am leaning, according to the structure. Only a bullish BOS will change my bias.
Enjoy!
May profits be upon you.
Leave any questions or comments in the comment section.
I appreciate any feedback from my viewers!
Disclaimer:
I do not provide personal investment advice and I am not a qualified licensed investment advisor.
All information found here, including any ideas, opinions, views, predictions, forecasts, commentaries, suggestions, expressed or implied herein, are for informational, entertainment or educational purposes only and should not be construed as personal investment advice. While the information provided is believed to be accurate, it may include errors or inaccuracies.
I will not and cannot be held liable for any actions you take as a result of anything you read here.
Conduct your own due diligence, or consult a licensed financial advisor or broker before making any and all investment decisions. Any investments, trades, speculations, or decisions made on the basis of any information found on this channel, expressed or implied herein, are committed at your own risk, financial or otherwise.

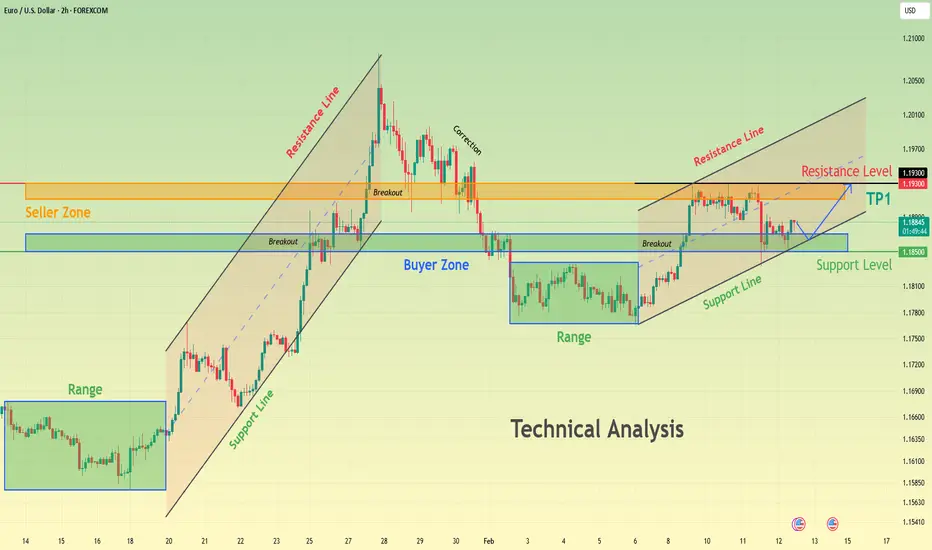
EURUSD Compressing Above Demand - Next Move IncomingHello traders! Here’s my technical outlook on EURUSD (2H) based on the current chart structure. The pair is trading within a broader bullish environment, supported by a clearly defined rising support line that has guided price higher over time. Earlier in the move, EURUSD entered a consolidation phase, forming a clean range where buyers and sellers were temporarily balanced. This range acted as an accumulation zone before a strong impulsive breakout to the upside, confirming buyer dominance and continuation of the bullish trend. Following the breakout, price accelerated aggressively and pushed into the Seller Zone / Resistance area around 1.1930, where selling pressure increased significantly. This led to a corrective pullback, as sellers defended the resistance and price retraced lower. However, the decline found support at the Buyer Zone near 1.1850, which also aligns with the broader support level and rising structure. This reaction signaled that buyers were still active and willing to defend demand, preventing a deeper breakdown and maintaining the overall bullish structure. Currently, EURUSD is consolidating above the Buyer Zone and holding above the key support level, while respecting the rising channel structure. Price action shows compression just above support, suggesting absorption of selling pressure rather than distribution. Multiple breakout attempts from this area indicate that buyers are gradually regaining control, while sellers are struggling to push price decisively below demand. This type of consolidation after a corrective move often precedes another impulsive leg higher. My primary scenario favors bullish continuation, as long as EURUSD holds above the 1.1850 Buyer Zone and continues to respect the ascending support line. A confirmed breakout and acceptance above the current consolidation would open the path toward the 1.1930 Resistance / Seller Zone (TP1), where sellers may attempt to react again. A clean breakout above this resistance would further strengthen the bullish case and signal continuation of the broader uptrend. On the other hand, a decisive breakdown below the Buyer Zone and loss of structural support would invalidate the bullish setup and shift focus toward a deeper corrective phase. For now, structure, trend, and price behavior continue to favor buyers. Please share this idea with your friends and click Boost 🚀
THE 5 TRUTHSThey said the multiverse was built from gears, light, and old stories — but the Good Shepard knew better.
He placed his lantern on the ground, and when he finally spoke, it wasn’t loud.
It didn’t need to be.
His voice carried the weight of someone who had walked through lifetimes, someone who had watched countless souls forget who they were — and was now here to remind them.
“These,” he said, “are the Five Truths. Not rules. Not beliefs. Reminders of what you already are.”
Truth One — You Are Not Separate
“You were never a drop in the ocean,” the Shepard said.
“You were the ocean pretending to be a drop.”
Separation was the first illusion.
Oneness was the first remembering.
“You are the divine wearing a temporary name,” he said.
“And you never stopped being it.”
Truth Two — Fear Is an Illusion
“Fear begins in the mind. Love begins before the mind.”
Fear was a shadow — a barrier built from old wounds and forgotten light.
“You do not seek love,” he said.
“You remove what blocks it. When the barriers fall, love is all that remains.”
Truth Three — The Mind Is a Projector
“Your mind is not a camera,” he said. “It does not record reality. It casts it.”
Consciousness wasn’t inside the universe.
The universe was inside consciousness.
“You are not watching reality,” he said.
“You are shaping it.”
Truth Four — The Enemy Is Ego
“The world is not your enemy,” the Shepard said.
“The ego is.”
The ego was the survival story — the mask built to protect the frightened child within.
“It is not you,” he said.
“It is the version of you that forgot the divine. You do not destroy the ego. You outgrow it.”
Truth Five — Everything Is Connected
“Nothing exists independently,” he said.
“Not a star, not a soul, not a single breath.”
When one rises, all rise.
When one falls, all feel the tremor.
“This is the truth beneath every truth,” he said.
“You were never alone. You never could be.”
The Shepard lifted his lantern, its light bending the air around it.
“Remember these,” he said.
“For the path ahead will ask you to live them.”
And with that, he stepped forward — not into a fracture in the sky this time, but into the hearts of those who heard him.

NASDAQ - NAS100 short term & Long term MovementCurrently looking for a bullish movement as we are patiently waiting for entries on the lower time frames and holding up until the first 4H - FVG as per the path line, expectation is to Hedge the Buy with a Sell for the Retracement, as soon as the Retracement ends Buy Trades will be added and held till the second 4H - FVG.
There after we will be looking for long term Sells.

EURUSD Local Bullish Bias!
HI,Traders !
#EURUSD has made a retest
Of the horizontal support
Level of 1.17914 and we are
Already seeing a bullish rebound
So we will be expecting
A further move up !
Comment and subscribe to help us grow !

US10Y Daily priceaction and directional bias.US10Y is the yield on the U.S .10-year treasury notes government debt security maturing in 10 years that serves as a global benchmark for interest rates, reflecting investors expectations on growth ,inflation and federal reserve policy.
The US10Y represents the effective return investors demand to lend to united states government for a decade(10years).it moves inversely to bond prices, on technical, when yields are rising which signals stronger growth while falling yields indicates economic caution or safe-haven demand,US10y influences borrowing cost across mortgages, corporate bonds and loans
Coupon rate is the fixed annual interest paid on a bond's face value. For a Treasury note or bond, it's set at issuance and paid semi-annually until maturity.
Key Details
It's calculated as (annual coupon payments / par value) × 100; e.g., a 5% coupon on $1,000 par pays $50 yearly ($25 twice).
Unlike yield, which fluctuates with market price, the coupon remains constant—higher coupons trade at premiums when yields fall.
Bond prices and yields have an inverse relationship. When yields rise, prices fall, and vice versa, due to the fixed coupon payments relative to market rates.
Why Inverse?
Fixed coupons mean higher market yields make existing bonds less attractive, forcing sellers to discount prices for competitive returns.
Lower yields increase demand for higher-coupon bonds, driving prices above par (premium).
US10Y affect DAX40,the DAX40 is the German benchmark index of 40 major stocks, through global yield spillovers and capital flows.
When the US10Y is higher and bullish ,it strengthens the dollar index and pressure Eurozone borrowing, this makes U.S assets more attractive and weighing on European equities like the DAX40.
The US10Y bearish drop can be seen as supporting DAX by easing ECB policy constraints and boosting risk appetite.
So coming week trading US10Y along side DAX40.
the market structure of the US10Y is giving us a sell vibes and it could drop below 4.0% this month .
though we have an ascending trendline on daily that should serve as support to enable us get a retest and sell below 4.0% on possible breakout of trend.
#US10 #US10 #BONDS

NZDCHF SHORT Market structure bearish on HTFs DH
Entry at both Daily and Weekly AOi
Weekly Rejection at AOi
Daily Rejection at AOi
Previous Daily Structure Point
Around Psychological Level 0.46500
Touching EMA H4
H4 Candlestick rejection
Rejection from Previous structure
TP: WHO KNOWS!
Entry 100% TPT 105%
REMEMBER : Trading is a Game Of Probability
: Manage Your Risk
: Be Patient
: Every Moment Is Unique
: Rinse, Wash, Repeat!
: Christ is King.

CAT about to fallLook at CAT on the monthly chart. Notice what happens when the momentum oscillator is above the 80 line. I have marked these with the red vertical lines.
Further confirmation is on the weekly chart historically when 3 things happen: RSI over 72, Stochastic RSI over 90, Momentum oscillator over 80.
Now look at the 2 hour chart (I can only show the 1 chart at a time on publishing). The 2 hour chart is showing bearish divergence. A correction is coming soon!
Again, refer to the percentages of the corrections on the red vertical lines on the monthly chart. We can except a 25% move down, which would put the price back to the top of the shown parallel channel (pre-breakout area).

EURJPY STRONG BEARISH BIAS|SHORT|
✅EURJPY strong bearish displacement confirmed breakout below 5H supply. Structure shifted lower with sell-side liquidity in play. Expect minor retrace into premium before continuation toward external liquidity at target.Time Frame 5H.
SHORT🔥
✅Like and subscribe to never miss a new idea!✅

S&P 500 (SPX): Price At Trendline Support, Aims For 7,000 The S&P 500 (SPX) closed at 6,836.18 on Friday February, edging up slightly by 3.41 points after a volatile trading session. despite this minor gain, the index ended the week down at 1.4%, marking its worst weekly performance so far.
Meanwhile, inflation data provided early support, with the consumer price index (CPI) rising to 0.2% in January (2.4% annually).
In respect of the structure, the market is in uptrend momentum channel, which price is presently at the demand trendline as we anticipate bullish rise to 7,000 from here.
Thanks for reading.

AUD-USD Local Short! Sell!
Hello,Traders!
AUDUSD sharp rejection from 2H horizontal supply confirms bearish order flow. Liquidity grab above range completed, price trading back in discount. Expect continuation toward sell-side liquidity at target.Time Frame 2H.
Sell!
Comment and subscribe to help us grow!
Check out other forecasts below too!
Disclosure: I am part of Trade Nation's Influencer program and receive a monthly fee for using their TradingView charts in my analysis.

The Nasdaq and the S&PThis is Sunday the 14th. I believe there's a setup for potential trades in both markets. I will be looking at the markets when they open on Sunday. even though they are the types of behavior that they have and which can create a very good return.... It's important to have context with these markets.... Instead of generating a lot of sentences here.... It's probably a little better to go to the charts and listen to them from beginning to end.

BTC 1H🧠 Market Context
Bitcoin has just completed a liquidity sweep after an extended move, tapping into a high-timeframe supply/demand reaction zone. Price action is currently compressing, signaling that we’re approaching a decision point where momentum traders and HTF participants collide.
The recent impulse leg shows aggressive positioning, but follow-through volume is starting to fade — typically a precursor to either consolidation or a sharp expansion move.
🔑 Key Levels To Watch
Major Resistance / Supply: Previous breakdown region + liquidity cluster
Mid-Range Pivot: Intraday structure flip area
Primary Support: Demand zone aligned with prior consolidation base
Invalidation Level: Clean break + acceptance beyond HTF structure
These zones are not just horizontal levels — they represent orderflow interest areas where reactions are statistically more likely.
📈 Bullish Scenario
If price holds above the mid-range structure and builds higher lows:
Expect continuation toward equal highs / resting liquidity
Break-and-retest of resistance could trigger expansion
Momentum confirmation: strong candle closes + increasing volume
Bias shifts bullish on structure confirmation, not anticipation.
📉 Bearish Scenario
Failure to reclaim reclaimed structure could signal:
Distribution inside resistance
Sweep-and-reverse pattern
Rotation back into lower demand zones
A clean breakdown below support with acceptance likely opens a fast-move liquidity vacuum.
⚠️ Trading Strategy
Avoid chasing mid-range noise
Let price come into levels
Focus on confirmations:
Structure breaks
Volume expansion
Reaction speed at zones
Remember: Location > Prediction.
🧭 Final Thoughts
Bitcoin is sitting at a high-probability reaction area. The next expansion move will likely come after liquidity is fully engineered around current consolidation.
Stay patient, trade the reaction — not the emotion.

MSFT'S Correction, BUT 1000 by 2033To fully realize future AI profits and soring stock prices.... BIG Tech needs to shed employees, and have massive lay-offs. They can't do this and be at ATH's no excuses. When you layoff employees these employees also tend to finally cash-out on some of those long held positions... all this adds pressures an creates and environment where the stock price goes way below its value. Now Trump loves AI and one day these tech companies may have almost no employees, but be super profitable and wealthy,.... so into the future BIG-Tech companies need to shed employees and trump is try to organize them so they don't do this all at once before the mid-terms...As this would tank the markets. So it was NFLX (who need to loose employees badly) then MSFT, then AMZN, now APPL, Then META, then GOOG and TSLA (why is TSLA last who knows?), we will see how the strategy works

Levels to Play!PSO Analysis
Closed at 478.11 (27-01-2026)
Immediate Support seems to be around 470 - 472
Resistance Zone is around 494 - 500 now.
Crossing & Sustaining this Zone may lead it towards 560+
Trailing SL now should be around 459. Breaking this level
may bring more selling pressure towards 450 & then around 420.

BTC bottonBTC Accumulation Plan for 2026
Personal chart featuring highlighted accumulation zones derived from historical Bitcoin market cycles
Green zones indicate promising entry points for long-term holding and accumulation up to 2026

Copper to ~$7.90 (+35%)copper is in creating a bullish flag, with several touches on the support and resistance.
and a measured move to about $7.90, which is about a 35% move.
With more touches the the support than resistance. We could see a break down, but if the Bull Flag plays out, we could see a significant move up.
