US100 Price Update – Clean & Clear ExplanationUS100 is currently trading under strong selling pressure after failing to sustain above the ascending trendline and the previous supply zone around 25,700–25,900. The sharp rejection from this area confirms that sellers remain in control.
Price has now broken below key structure support near 25,200–25,000, signalling a bearish continuation rather than a simple pullback. The recent impulsive bearish candle shows strong momentum, suggesting that any short-term bounce could be corrective.
As long as price remains below 25,700, the bias stays bearish. A short-term retracement toward 25,300–25,500 could offer selling opportunities, followed by a continuation lower toward 24,500. Only a strong reclaim above the broken trendline would invalidate this bearish scenario.
“If you come across this post, please like, comment, and share. Thanks!”
Trend Analysis

Selena | XAUUSD – 30M | Intraday Recovery From DemandFOREXCOM:XAUUSD PEPPERSTONE:XAUUSD
After a strong bearish impulse, XAUUSD reached a major intraday demand zone and printed a sharp rejection. Price is now attempting a corrective recovery, but upside remains capped by a descending trendline and supply zone around 4,900–4,930. The move currently looks like a pullback within a broader corrective phase.
Key Scenarios
✅ Bullish Case 🚀 (Intraday)
Holding above 4,760–4,780 support
🎯 Target 1: 4,900
🎯 Target 2: 4,930–4,960 (trendline + supply zone)
❌ Bearish Case 📉 (Failure Scenario)
Breakdown below 4,760
🎯 Downside target: 4,640–4,600 demand zone retest
Current Levels to Watch
Resistance 🔴: 4,900 – 4,960
Support 🟢: 4,760 → 4,640
⚠️ Disclaimer: This analysis is for educational purposes only. It is not financial advice.

TheGrove | EURUSD buy | Idea Trading AnalysisEURUSD broke through multiple Support level and is now holding above the trendline and key level zone. The current pullback toward the marked support cluster suggests a potential continuation of the bullish move, provided price holds this structure.
EUR/USD is trading within a rising channel, with price holding above the ascending support line after a clear bullish and is moving on Resistance LEVEL.
Hello Traders, here is the full analysis.
GOOD LUCK! Great BUY opportunity EURUSD
I still did my best and this is the most likely count for me at the moment.
-------------------
Traders, if you liked this idea or if you have your own opinion about it, write in the comments. I will be glad ⚜️

BTCUSDT Short: Sellers in Control - Next Stop $69,000 SupportHello traders! Here’s a clear technical breakdown of BTCUSDT (3H) based on the current chart structure. BTC previously traded within a well-defined consolidation range, where price moved sideways for an extended period, indicating market balance and accumulation. This ranging phase eventually resolved to the upside, leading to a strong impulsive rally. The bullish expansion culminated at a clear pivot high, where buying momentum began to fade and profit-taking emerged. From this pivot point, market structure shifted, and BTC transitioned into a descending channel, characterized by consistent lower highs and lower lows. Price respected the channel boundaries well, confirming controlled bearish pressure rather than a disorderly sell-off.
Currently, BTC has broken below a key Supply Zone around 73,500–74,000, which previously acted as strong resistance. This breakdown confirms a bearish continuation scenario rather than a temporary pullback. Price briefly attempted to reclaim this zone but failed, suggesting acceptance below former resistance. Below current price, the Demand Zone around 69,000 stands out as the next major area of interest. This level represents a strong historical demand area and a potential zone for buyers to step in.
My primary scenario favors further downside continuation as long as BTC remains below the descending supply line and the broken supply zone. Any pullback toward the supply line or the 73,500 area is viewed as a corrective retest and a potential short opportunity rather than a bullish reversal. The main downside objective remains the 69,000 Demand Zone (TP1), where partial profits can be considered and where a stronger reaction is likely. If price reaches this demand area, market reaction will be critical in determining whether BTC forms a base for a bounce or continues lower. However, a strong reclaim and acceptance back above the supply zone and the descending supply line would invalidate the bearish scenario and signal a potential trend shift. Until that happens, structure, trend, and price behavior continue to favor sellers, with downside pressure dominating the current market phase. Manage your risk!

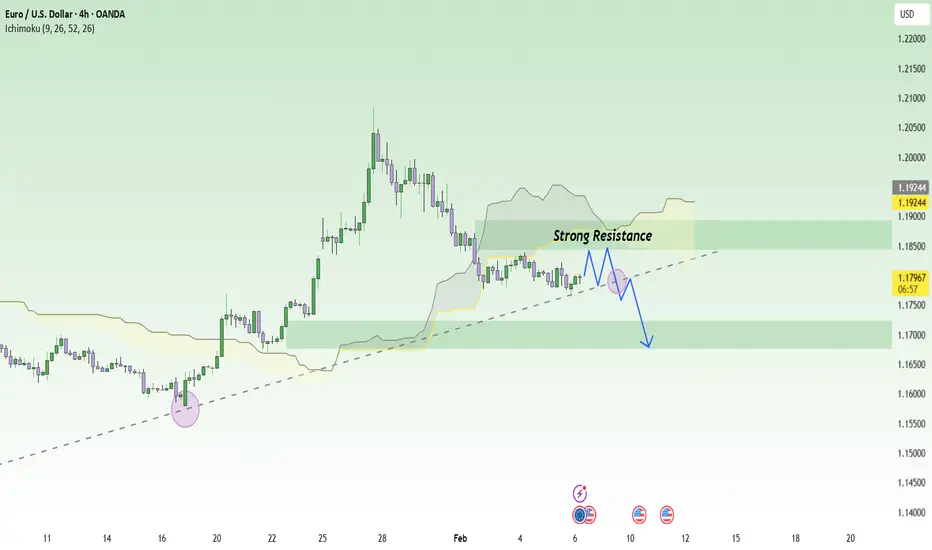
Don’t Rush to Buy EURUSD – The Bearish Trend Is Speaking UpEURUSD is currently leaning toward a short-term BEARISH trend, as recent news continues to favor the U.S. dollar over the euro . The ECB has kept interest rates unchanged with a rather cautious tone , while Eurozone data and momentum remain too weak to support a sustainable EUR recovery. In contrast, the USD is still supported by expectations that U.S. interest rates will stay higher for longer , making EURUSD rallies vulnerable to selling pressure.
On the chart, after the strong rally at the end of January , price has entered a corrective phase and is now trading below the Ichimoku cloud. This signals that bullish momentum has faded , and the market is shifting into a “technical rebound within a short-term downtrend” . Recent candles are compressing around the 1.17–1.18 zone, which may look like accumulation, but in reality it is more likely consolidation before a downside break if price fails to clear overhead resistance.
The 1.1840 area stands out as a clear resistance zone (supply confluence + cloud resistance) , where selling reactions are highly likely. If price pulls back toward 1.1840 but fails to hold, the higher-probability scenario is a renewed move lower, with an initial focus on 1.1700, and a deeper extension toward 1.1677, in line with the marked targets.
USDJPY 30Min Engaged ( Bearish Reversal Entry Detected )⚡Base : Hanzo Trading Alpha Algorithm
The algorithm calculates volatility displacement vs liquidity recovery, identifying where probability meets imbalance.
It trades only where precision, volume, and manipulation intersect —only logic.
✈️ Technical Reasons
/ Direction — SHORT / Reversal 156.640 Area
☄️Bearish rejection confirmed through sharp candle body.
☄️Lower-high forming beneath resistance supply region.
☄️Volume decreasing confirms exhaustion in price rally.
☄️Sellers regained imbalance with heavy top rejection.
☄️Algorithm detects fading demand and shift to control.
⚙️ Hanzo Alpha Trading Protocol
The Alpha Candle defines the day’s real control zone — the first battle of momentum.
From this origin, the Volume Window reveals where the next precision strike begins.
⚙️ Hanzo Volume Window / Map
Window tracked from 10:30 — mapping true market behavior.
POC alignment exposes institutional bias and breakout potential zones.
⚙️ Hanzo Delta Window / Pulse
Delta window monitors real buying vs. selling power behind each move.
Tracks volume aggression to expose who controls the candle — buyers or sellers.
When Delta aligns with Volume Map, momentum becomes undeniable.

Gold next move?Gold is facing a strong resistance around the 4900 level, and the price has been repeatedly rejected from this zone, causing it to move downward each time it reaches this area. As long as the market does not achieve a confirmed close above this level, it will remain difficult for price to sustain any upward movement.
Additionally, the market has already collected liquidity on the downside, which increases the probability of further consolidation or corrective moves. Therefore, it is advisable to wait for a clear market close above the 4900 level. Once a strong close is established above this resistance, gold may then continue its move toward the upside.

SOL potential breakdown !SOL / USDT
Solana is breaking down Major Trendline support and also forming a H&S bearish pattern
Possible targets : 59$ and 32$
Currently Bears are in control
Keep an eye on it

Bearish Descending Channel with Continuation Setup
This is a BTC/USD 1-hour chart showing a clear downtrend inside a descending channel. Price has been making lower highs and lower lows, respecting the channel boundaries. The Ichimoku Cloud is mostly above price, acting as dynamic resistance, which confirms bearish momentum. A BOS (Break of Structure) is marked, indicating continuation of the bearish move after a pullback into resistance. Price is currently trading near the lower half of the channel, suggesting selling pressure remains strong, with a projected downside target around the lower support zone (near 64k) if the trend continues.

Eliana | BTCUSD – 30M – Intraday Market ConditionBITSTAMP:BTCUSD COINBASE:BTCUSD
After distribution near the 79,000–78,000 resistance range, BTC experienced a strong impulsive sell-off, confirming bearish dominance. The breakdown below 73,000 accelerated momentum toward the 69,000 liquidity pocket. Current bounce appears corrective rather than a trend reversal. As long as price remains below the broken structure and supply zones, overall bias stays bearish, with only intraday pullback opportunities for buyers.
Key Scenarios
❌ Bearish Case 📉 (Primary Bias) →
Rejection below 72,900 – 73,500 keeps sellers in control.
🎯 Target 1: 69,150
🎯 Target 2: 67,800
🎯 Target 3: 66,500
✅ Bullish Case 🚀 (Relief Bounce Only) →
Strong hold above 69,100 demand may trigger a corrective move.
🎯 Target 1: 72,900
🎯 Target 2: 75,000
🎯 Target 3: 76,800
(Bullish move is corrective unless structure flips)
Current Levels to Watch
Resistance 🔴: 72,900 – 76,800
Support 🟢: 69,100 – 67,800
⚠️ Disclaimer: This analysis is for educational purposes only. Not financial advice.

THE KOG REPORT - UpdateEnd of day update from us here at KOG:
Yesterday we gave the hot spots and range we expected price to play in, and although we missed the lower hot spot by a few pips, we got the bounce from that region into the defence box above. We mentioned this morning that there was no break above, and due to the price action, to expect another correction during the NY session. The defence held, the bias level broke and we managed to complete all of our targets in a matter of hours.
For now, I’m expecting more of this whipsawing and the mega range but I have two key levels here. 5040-50 resistance and 4810-30 support. I would like to see a break above to confirm the target we already have for the high, however, that lower wick is concerning. Another attempt to break below 4600 could be on the cards here, so let’s monitor the price action tomorrow and wait for Excalibur and the indicators to give us the direction.
All in all, another decent day on the markets, even though staying ahead is taking a lot of effort.
From Camelot this morning:
Price: 5054
RED BOXES:
Break above 5060 for 5090. 5110 and 5140 in extension of the move
Break below 5025 for 5010✅, 4999✅, 4970✅ and 4956✅ in extension of the move
As always, trade safe.
KOG

Bitcoin to crash 70% in 2026 to $35k? - January 2026This chart is so simple it should be illegal. Influencers push out super-cycle nonsense while the chart screams the most obvious return of gravity.
Two oscillators at the bottom of the above 1 month chart:
RSI
RSI closes below 54 on the monthly (red circles). If the month of January closes as is below 54, then the next 700 days will be a grand nothing burger. 2 years of zip. Look left, this time is not different. Influencers will still publish daily videos “Black rock is buying”.
Stochastic RSI
Here we see momentum crossing down 20 (Green circles) for the first time since January 2021. Each and every event throughout Bitcoin’s history saw 70% corrections at a minimum, 90% corrections at the maximum. A 70% correction could be conservative, with a forecast to $37k and 90% as low as $12k.
Is this time different?
No. Come on, seriously? How for gone are you?
Will I short?
No. I never short any market, there’s never any need to do that. Only long what is oversold and beaten down. And right now it’s Christmas come early as 99% of the market chase shinny objects. Me? I'm chasing 0.01% that's about to explode on ideas already published and yet so few have commented on.
Ww
==========================================
Disclaimer
Right. Listen up, you desperate, hopeful goblins. Before you read this and immediately sell your kids’ shoes to bet on a Bitcoin crash because some bloke on the internet drew some red circles… a word.
This isn’t financial advice. It’s not even good advice. It’s a chart with some lines and circles I made while avoiding proper work. Treat it with the same respect you’d give a horoscope written by a drunk pigeon.
I am a moron. Seriously, I tried to short Gold at $2k, din't you read the comments? I’m a stranger with a drawing tool. My greatest financial achievement this year was finding a 10 cent coin in the laundromat. Do not model your life on my squiggles. You wouldn’t let me perform surgery on you with a spoon, so don’t let me perform surgery on your portfolio with a stochastic RSI.
I Won’t Short It. I said I won’t short. Know why? Because I’m a coward. Or wise. It’s the same thing. So if it moons and you shorted because of me, you’re not only poorer, you’re also braver than I am. And bravery in finance is just a pretty word for “stupidity.”
In summary: This is for entertainment. If you lose all your money, you can’t have my 20 cents.

Elise | XAUUSD · 30M – Liquidity Grab → Bullish ContinuationOANDA:XAUUSD
Gold executed a classic liquidity grab below support, trapping weak sellers before aggressively reclaiming structure. Each dip into demand has been met with strong buying pressure, showing smart-money accumulation. The current pullback appears corrective, and as long as price holds above support, continuation toward the higher resistance zone remains favored.
Key Scenarios
✅ Bullish Case 🚀 → 🎯 Target: 5,040 – 5,080
❌ Bearish Case 📉 → Failure to hold 4,820 may expose price back toward the lower demand zone.
Current Levels to Watch
Resistance 🔴: 5,040 – 5,080
Support 🟢: 4,780 – 4,820
⚠️ Disclaimer: This analysis is for educational and informational purposes only. It is not financial advice. Please conduct your own research before trading

EURUSD: Triangle Resistance Holds - Bearish Bias Toward 1.1730Hello everyone, here is my breakdown of the current EURUSD setup.
Market Analysis
EURUSD previously traded within a well-defined consolidation range, where price moved sideways for an extended period, reflecting temporary balance between buyers and sellers and gradual liquidity accumulation. This range eventually resolved to the downside, initiating a sustained bearish move that developed into a clean downward channel, marked by consistent lower highs and lower lows. This structure confirmed strong seller control and an orderly bearish continuation rather than a panic-driven sell-off. After reaching the lower boundary of the descending channel, selling pressure weakened and price staged a corrective rebound. This rebound led to a breakout above the channel resistance and triggered a sharp bullish impulsive move, which reclaimed the Support Zone and extended into the Resistance Zone around 1.1800–1.1810.
Currently, EURUSD is trading below the Triangle Resistance Line, with price showing a weak pullback and consolidation just under the resistance zone. This behavior suggests a classic bearish retest scenario, where former support has flipped into resistance. The lack of impulsive bullish continuation and repeated rejections from the triangle resistance further reinforce the bearish bias.
My Scenario & Strategy
My primary scenario favors short continuation, as long as EURUSD remains below the 1.1800 Resistance Zone and the descending triangle resistance line. The recent bullish push appears corrective and liquidity-driven rather than the start of a sustainable trend reversal. From a structural perspective, the market has failed to reclaim higher highs, and the rejection from resistance confirms that sellers remain in control. As long as price stays capped below resistance, rallies are viewed as selling opportunities rather than signals of bullish continuation. The first downside objective lies near the 1.1730 Support Zone, which represents a key demand area and a prior reaction level. This zone is expected to act as the first major downside target where buyers may attempt a reaction or short-term stabilization. If EURUSD reaches the support zone and shows strong rejection or consolidation, a temporary bounce is possible.
However, a decisive breakdown and acceptance below 1.1730 would confirm further bearish continuation and open the door for a deeper move toward lower demand areas. The short bias remains valid as long as price respects resistance and the descending structure stays intact. A clean breakout and acceptance above the triangle resistance and the 1.1800 zone would invalidate the short scenario and shift focus back toward bullish continuation. Until then, overall structure clearly favors sellers.
That’s the setup I’m tracking. Thank you for your attention, and always manage your risk.

GBPUSD 3M CLS - Daily OB Confirmed More Downside comingHi friends, new 3M range created and confirmed. As always we are looking for the manipulation in to the key level around the range. Don't forget confirmation switch from manipulation phase to the distribution phase to make the setup valid. Stay patient and enter only after change in order flow. If price reaches 50% of the range take partial or full close.
👊 Trade Visual
I promised myself I’d become the person I once needed the most as a beginner. Below are links to a powerful lessons I shared on Tradingview. Hope it can help you avoid years of trial and error I went thru.
📊 Sharpen your trading Strategy
⚙️ 100% Mechanical System - Complete Strategy
🔁 Daily Bias – Continuation
🔄 Daily Bias – Reversal
🧱 Key Level – Order Block
📉 How to Buy Lows and Sell Highs
🎯 Dealing Range – Enter on pullbacks
💧 Liquidity – Basics to understand
🕒 Timeframe Alignments
🚫 Market Narratives – Avoid traps
🐢 Turtle Soup Master – High reward method
🧘 How to stop overcomplicating trading
🕰️ Day Trading Cheat Code – Sessions
🇬🇧 London Session Trading
🔍 SMT Divergence – Secret Smart Money signal
📐 Standard Deviations – Predict future targets
🎣 Stop Hunt Trading
💧 Liquidity Sweep Mastery
🔪 Asia Session Setups
📀 Gold Strategy
🧠 Level Up & Mindset
🛕 Monk Mode – Transition from 9–5 to full-time trading
⚠️ Trading Enemies – Habits that destroy success
🔄 Trader’s Routine – Build discipline daily
💪 Get Funded - $20 000 Monthly Plan
🧪 Winning Trading Plan
⭕ Backtesting vs Reality
🛡️ Risk Management
🏦 Risk Management for Prop Trading
📏 Risk in % or Fixed Position Size
🔐 Risk Per Trade – Keep consistency
🧪 Risk Reward vs Win Ratio
💎 Catch High Risk Reward Setups
☯️ Smart Money - Who control Markets
Adapt useful, Reject useless and add what is specifically yours.
David Perk

Bitcoin - Sweep, Reclaim, Then Continuation Lower?Higher Timeframe Context
Price continues to respect a broader bearish structure, with lower highs forming after the previous distribution phase. The recent downside expansion did not occur randomly, it aligned with higher timeframe weakness and persistent sell-side pressure. Even though support has reacted before, the overall order flow still favors sellers until proven otherwise. This keeps any upside move categorized as corrective rather than a true shift in trend.
Liquidity Event and Support Reclaim
The key technical development here is the sweep of a weekly low followed by a close back above it and inside a strong weekly support zone. This type of behavior often signals engineered liquidity rather than genuine acceptance below the level. When price quickly reclaims support after taking stops, it typically creates the fuel for a relief move, as trapped shorts begin to cover and responsive buyers step in.
Short-Term Repricing Potential
With liquidity now collected from below, price has room to rotate higher in the near term. The path above contains inefficiencies that remain unfilled, particularly the daily imbalance that sits overhead. Markets tend to revisit these gaps as part of delivery, especially after a sweep and reclaim sequence. In addition, a cluster of lower timeframe consolidation rests in that same region, making it an attractive draw for price before any larger directional decision.
Confluence With Lower Timeframe Targets
The projected push higher is not expected to mark a bullish reversal, but rather a controlled retracement into areas where liquidity is resting. A sweep of the intraday consolidation would effectively reset positioning and potentially provide higher timeframe sellers with improved entry locations. When corrective rallies move into imbalance while the macro structure remains bearish, they often transition into continuation legs once the rebalancing is complete.
Why The Bearish Bias Remains Intact
Despite the strong reaction from support, nothing in the current structure suggests a confirmed shift in market direction. The broader pattern still points downward, and rallies should be viewed through the lens of distribution until market structure decisively changes. If price delivers into the overhead targets and begins to show rejection, it would reinforce the idea that the recent reclaim was simply a setup for continuation rather than accumulation.
Conclusion
The sweep and reclaim of weekly support opens the door for a temporary move higher, primarily driven by imbalance fills and liquidity resting within nearby consolidations. However, with the higher timeframe structure still leaning bearish, the expectation is for this relief rally to eventually exhaust itself and transition into another leg lower.
___________________________________
Thanks for your support!
If you found this idea helpful or learned something new, drop a like 👍 and leave a comment, I’d love to hear your thoughts! 🚀

Bitcoin (BTC): Might Have Been Wrong on Timing, History RepeatsThis whole time we've been looking for an H&S pattern to form for us to get a perfect entry from the upper right shoulder and upon the breakdown of the neckline but what actually happened was a repeat of history.
The behavior similarities never go away; while we were aiming for March to be the start of the bear market, we might actually be in one already.
Hear me out here, we are near the 200 EMA, and once the price fixes another weekly candle below the current neckline zone, then there is a very high probability that we will see the price fall as low as $40-50K.
The last bullish move (which we thought to be the right shoulder) will most likely not happen so now we go with this plan.
Swallow Academy

Wave (2)- Wave (3)
I see two possibilities; Blue or Brown ?
Technical Section:
Wave (2)- Sharp Correction
Common Ratios for Wave 2:
Wave 2 = either 61.8% of Wave 1 or 76.4% of Wave 1
Long Term support levels:
The Blue Path: $ 57655 (once complete the market will reverse ..)
The Brown Path: $ 47986 (Possible and probable (Middle East war))
Wave (3)
Wave 3 = either 1.618 x length of Wave 1
or 2.618 x length of Wave 1
or 4.236 x length of Wave 1
Long Term resistance levels:
1 x length of Wave 1= $ 181000 (always travels beyond the end of wave 1)
1.618 x length of Wave 1= $ 258000
2.618 x length of Wave 1= $ 383000
4.236 x length of Wave 1= $ 584000

AMZN Wait For The Crack!This is a complete structure with 4 points, 3 waves, and a hook revealing a rising wedge.
The first mini-crack has already taken place.
The structure is all set up, valid, and ready to crack! All you have to do is wait.
🚨CAUTION! To all the bulls!
If you enjoy the work:
👉 Boost
👉 Follow
👉 Drop a solid comment
Let’s push it to 6,000 and keep building a community grounded in truth, not hype.

GOLD Forming a sideways StructureGold is currently trading inside a clear range-bound structure, following a strong bearish move earlier in the session. Price is consolidating between major support near 4,560 and key resistance around 5,100, forming a sideways.
Gold fell toward 4,750 today, extending a 3.8% loss from the previous session and remaining on track for its second consecutive weekly decline as selling pressure persists the pullback follows a period in which the metal repeatedly hit record highs in January, driven by heightened geopolitical risks, concerns over Federal Reserve independence, and speculative buying in China.
Technical Outlook
If price maintains support above 4,800, we could see an upside reaction toward 4,959 / 5,100.
If price breaks below this support, downside targets come in around 4,702, followed by 4,559.
Traders should wait for confirmation at these key zones to determine the next directional move.
You may find more details in the chart,
Trade wisely best of Luck Buddies.
Ps; Support with like and comments for better analysis Thanks for Supporting.

XAUUSD – Brian | H1 Weekend OutlookXAUUSD – Brian | H1 Weekend Outlook: Volatility Reset & Range Opportunities
Gold delivered a sharp volatility spike in early Asia on Feb 6, flushing down toward the 4,680 area before quickly reclaiming ground as risk sentiment stabilised and the USD softened. The earlier drop looks driven by position reduction and portfolio rebalancing (traders covering equity losses), rather than a clean trend continuation. The recovery back above 4,830 confirms that buyers are still active when price returns to value.
Market Structure (H1)
On the H1 chart, price has transitioned into a two-way environment:
We’ve moved from an impulsive drop into a descending channel / corrective structure.
The rebound is strong, but still behaves like a corrective bounce inside the larger pullback.
This sets up a high-probability range/rotation into the weekend, where liquidity runs and mean-reversion moves can appear.
Key Zones To Watch
1) Upper Supply / Sell Pressure
5,100 – 5,200 zone (overhead supply)
This is the main area where rallies may face profit-taking and sell pressure. If price tags this zone and stalls, the market may rotate back down.
2) Mid-Range Reaction Area
~4,820 – 4,900 (current balance / pivot area)
This is the “decision zone.” Holding above it supports another push higher; losing it increases the probability of a deeper pullback.
3) Lower Demand / Liquidity Floor
4,650 – 4,700 (demand + volatility base)
The prior flush low area. If the market revisits this zone, watch for absorption and a potential rebound—especially if volatility spikes again.
Weekend Game Plan (Brian Mindset)
Primary expectation: sideways rotation with spikes (weekend-style volatility)
Best approach: trade reactions at the zones, not in the middle of the range
Bias handling:
Above the pivot → favour pullback-buys toward resistance
Into supply → be alert for rejection and rotation sells
Into demand → watch for absorption before considering longs
In a volatility-reset phase, levels and reactions matter more than prediction.
✅ Follow the TradingView channel to catch the next structure update early and exchange ideas with Brian.

Chumtrades xauusd friday trade planMarket Context
Gold is currently trading within a wide range, with the short-term structure still bearish. Price remains capped below the descending trendline, and each rebound weakens as it approaches resistance, indicating defensive, short-term capital flow with no clear signs of accumulation for a reversal yet.
Key Macro Factors
Markets remain under pressure from concerns about higher-for-longer interest rates, as monetary policy has not shifted toward easing. U.S. labor data volatility keeps gold highly sensitive to news, while rate-cut expectations for March–April remain low, offering insufficient support for a sustained bullish move. Geopolitical risks persist but currently act more as noise than a trend driver.
Market Expectations
Buyers are looking for short-term technical rebounds from demand zones, while sellers are waiting for pullbacks into resistance to continue distribution. Overall, the market appears to be positioning for a strong breakout, with elevated volatility risks heading into the weekend.
Intraday Trading Strategy
Bias remains SELL, trading in line with the prevailing structure. Look to sell on pullbacks into the 4,900–4,950 resistance area or near the descending trendline. BUY setups are strictly short-term reaction trades at support, with no intention to hold positions for long. Avoid chasing price during high-volatility moves.
Support zones: 4,825–4,836 | 4,800–4,814 | 4,750–4,766 | 4,640–4,700.
Resistance zones: 4,900–4,950 | 5,000 | a break above 5,100 would invalidate the bearish structure.
Friday Notes ⚠️
Fridays often carry the risk of sudden sell-offs, especially after 22:00 (VN time). On news-driven sessions, price can move fast and aggressively, increasing the risk of stop hunts. With wide volatility, tight risk management, smaller position sizing, and capital preservation should take priority over profit-seeking.

EUR/USD | Going to the bearish breaker (READ THE CAPTION)Good afternoon folks, Amirali here.
As you can see in the hourly chart of EURUSD, in the early hours of today, it reached the Bullish OB zone, then Swept the liquidity pool and then went up, hitting the IFVG and then gone above it, now being traded at 1.1796.
I'm eying the Bearish Breaker for a potential reversal. However if it goes through the bearish breaker, the targets are: 1.1805, 1.812, 1.819 and 1.1826.
If it reacts to the Bearish Breaker, the targets are: 1.1790, 1.1784, 1.1778 and 1.1772.
