Its Enough Watch the smaller timeframes (daily 1D or 4-hour); if you see a "Slight Regular Bullish Divergence" on the smaller timeframes when touching the yellow line, this is a safe entry signal
Trend Analysis

BTC Major level to hold.BTC Major level to hold. Huge level we are testing. Needs to hold or going lower.

Great spot to buy btcWe should most likely get a relief rally from these areas and possibly a wick down to 58k so playing it safe

Is 16000 - 19000 Possible for BTC??BTC Analysis
CMP 66200.71 (05-02-2026)
Hit the Target of Cup & Handle around 120000 - 123000 & then crashed.
Now it may bounce back from 61000 - 63000 towards 80000.
However, breaking the important Support zone (61000 - 63000)
may drop the price further around 48000 & then around 33000.
For long term investment, the most attractive buying range is
around 16000 - 19000 (if it comes).

Bitcoin - So now it is happeningIt took longer than I originally thought, but now it's happening. The great exodus from the Ponzi scheme has begun. The rat poison squared has started to take effect. According to reports, it is the institutional rats that are fleeing first, abandoning the sinking ship as quickly as possible to limit the damage to their investors. The early adopters will probably hold on to their dream for a while longer, until they too realize what a landslide, indeed an avalanche, has been set in motion this time. I am curious to see whether the downward movement will accelerate or whether it will be a prolonged agony, with supposed recoveries/dead cat bounces.
One thing is clear, however: for Bitcoin to ever regain its credibility, it must rise above the green dotted line so that everything can return to “the way it was.”
How likely is that to ever happen?

Sell the USDFed will cut rates. Deleveraging events always pushed the Fed to cut regardless of who is Chair.
Buy 5 year bonds, not the back end. US debt burden will keep long rates elevated.
US is not a safe haven anymore = only EUR can fill that gap. Sell USD. Buy EUR, GBP,CHF,CAD,AUD.
Most currency trends are governed by the relative spread between 2yr yields on each side of the currency pair, +/- a sovereign risk premium. DXY is a basket trade, but the trade works once 2yr US yields start to fall. Which they will.

btc wBitcoin is in a previously executed ABc move at the ceiling in the pullback direction to the broken trend line and from there it will fall accordingly.

BTCUSD Analysis – Downtrend, Key Zones, Structure (Educational) BTC remains in a strong downtrend after extended selling pressure from the highs. Price recently reached a significant support cluster near ~65,000, where short-term buyers are attempting to stabilise action. The dominant trend remains bearish until we see a higher low above recent swing highs. Key resistance levels to watch are ~68,000 followed by ~70,000–72,000 where selling pressure increased previously. On the downside, the critical support zone around ~65,000–63,500 must hold to prevent accelerated declines. A confirmed break below ~63,500 opens risk toward ~61,000 and lower structural levels. A bounce off the current demand area can offer a potential buy zone, with early entries targeting range support and confirmation of higher lows. Buyers should look for clear bullish reactions, volume confirmation, and break above minor resistance before scaling in. Risk areas are defined below ~63,500. Use disciplined stops under the support cluster. Overall bias remains bearish until price actions change structure and break above key resistance clusters.

Ethereum Fake Breakout? Deep Drop After Hitting $4000After breaking above $4000, Ethereum boosted confidence among many holders — and a large number of traders entered right at that level.
But Bitcoin’s sharp drop triggered massive stop-loss hits across the market, revealing that the breakout was fake and most likely a stop-hunting move.
That’s why we saw such a deep correction.
I personally exited around $3800 with a small loss, and I shared the signal in the link below.
Even I was trapped by this fake breakout.
📉 Next support levels:
$2500
$1500
What’s your outlook?

NZDUSD: false breakout setup🛠 Technical Analysis: On the H4 chart, NZDUSD remains in a broader bullish structure after the earlier “global bullish signal” from the base. The recent pullback formed a corrective descending channel, but the latest dip produced a clear false breakout below the lower boundary. Price has now reclaimed the key demand area around 0.5989–0.5991, turning it back into near-term support. The pair is holding above the rising SMA100 and SMA200, suggesting the short-term trend is still constructive despite the correction. A sustained hold above the reclaimed support increases the odds of a push back to the upper resistance zone near 0.6086. If price slips back below 0.5989 and fails to recover quickly, the bullish scenario weakens and the move could extend toward lower supports.
———————————————
❗️ Trade Parameters (BUY)
———————————————
➡️ Entry Point: 0.59893
🎯 Take Profit: 0.60857
🔴 Stop Loss: 0.59255
⚠️ Disclaimer: This is a potential trade idea based on current analysis; market conditions and price direction are subject to change based on news factors and volatility.

BTC - NEW ANALYSIS: MORE CAUTIOUS!BTC - NEW ANALYSIS: MORE CAUTIOUS!
This is a new review with a more cautious and conservative analysis, considering a slightly deeper drop.

Zeta Global: structure reset on the weeklyZeta Global Holdings Corp. operates in marketing technology, providing data-driven customer intelligence and automation solutions for enterprises.
On the weekly chart, ZETA has completed a breakout above the long-term descending trendline and is currently holding a clean retest zone. The key support area sits between 17.8 and 18.4, where the weekly MA100 aligns with the 0.786 Fibonacci retracement. This confluence strengthens the structure and confirms acceptance after the impulse. Volume expanded on the breakout and cooled during the pullback, suggesting controlled price action rather than distribution. Weekly MACD is turning higher after a prolonged reset, while RSI remains above neutral territory, supporting a shift in market phase. Volume profile highlights upside attraction zones, with the first major area near 29–30 and a higher zone around 40.
From a fundamental perspective, the company shows improving financial quality. Market capitalization is around $5B, with consistent positive operating cash flow. Quarterly operating cash flow reached $57.9M, while free cash flow increased to $52.4M, both growing strongly year over year. Revenue continues to expand, with Q4 2025 estimates near $378M and expected EPS of $0.23. ZETA does not pay dividends, focusing instead on reinvestment and growth, while maintaining manageable debt and a solid balance sheet.
This is a higher-timeframe positioning idea where the market gradually reassesses the business after a corrective phase. Calm structure, improving fundamentals, and clear technical logic.

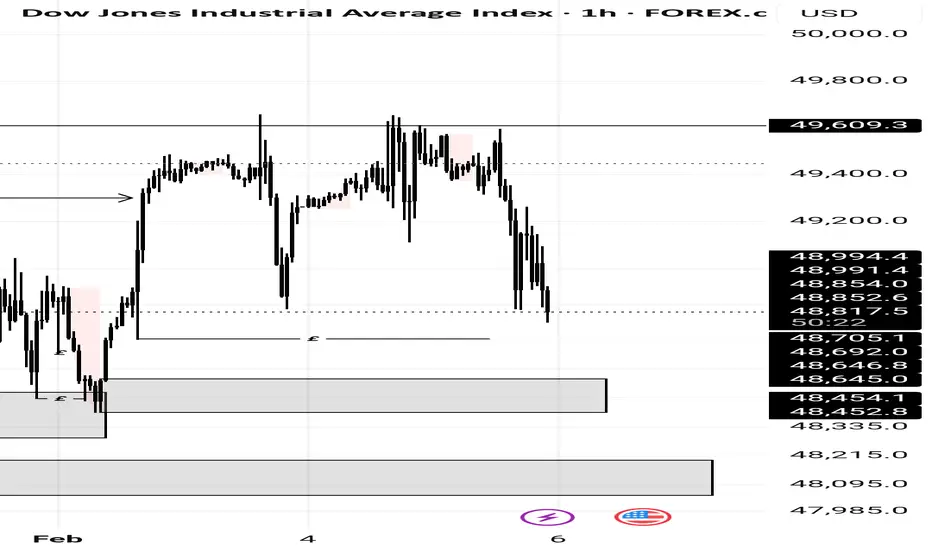
US30The market has respected and followed a series of demands leading to buys. Swept an equal high and is heading down now for a more buy in the line of the previous buys. Tho there rest a demand below have 3 zones of equal lows which if the most current demand fails, it will head for the demand below

Currently near Strong Trendline Support.BBFL Analysis
CMP 48.50 (08-02-2026)
Currently near Strong Trendline Support.
It should bounce from the current level.
It has the potential to touch 55 - 57 & then around 68.
However, it should not break 45 - 46 this time.

GBPUSD H1 OutlookPrice completed a full bearish leg into the daily low, followed by a clear Market Structure Shift (MSS), indicating seller exhaustion and the start of bullish intent.
After the MSS, price impulsively moved up, breaking internal structure and confirming short-term order flow has flipped bullish.
Current move is a healthy pullback into demand, aligning with the previous structure break and premium/discount logic.
⸻
🔹 Technical Breakdown
• HTF Context: Reaction from daily low → liquidity grab
• Structure: Bearish BOS completed → bullish MSS confirmed
• Entry Logic: Pullback buy into demand after MSS
• Confluence:
• Daily low liquidity sweep
• Bullish MSS
• Discount zone retracement
⸻
📈 Trade Plan
Buy Zone: 1.3560 – 1.3575
Targets:
• TP1: Daily High
• TP2: 1.3710
• TP3: Bearish Order Block (HTF supply)
⸻
❌ Invalidation
A clean break and close below the daily low invalidates the bullish setup and shifts bias back to bearish.

$BTC WEEKLY GOD CANDLE FORMING200WMA up next.
$50k you back the truck up.
WHO'S READY FOR VALHALLA !? 👼

Nothing just see chart History repeats itself.
Current Price and Recent Movement: According to Yahoo Finance data, Bitcoin closed at around $63,596 on February 5, 2026, a 13.23% drop in one day. The price had previously dropped as low as $66,000.
· Critical Support Levels: Many analysts consider the $65,000 level to be a key technical support. This level is both psychologically important and is the intersection of several technical indicators (such as Fibonacci levels and the ascending channel). A decisive break of this level could increase the risk of further declines.
· Major Resistance (Sell Ceiling): The $85,000-$95,000 area is considered heavy resistance. High trading volume in this area indicates that many buyers are at a loss and may sell to get out of the market as the price approaches this range.

BITCOIN (BTC) — THE FALL HAS ONLY JUST BEGUN⚠️ THE GREAT BITCOIN REVERSAL — THE STORM NO ONE IS READY FOR ⚠️
For years, Bitcoin INDEX:BTCUSD climbed with the arrogance of a king convinced its throne was eternal.
But every empire falls.
And the chart…
The chart has been whispering the truth long before anyone wanted to hear it.
Today, that whisper has become a SCREAM. 📉⚡
🔥 1. The Final Wave Has Broken — and So Has the Illusion
The macro Wave 5 top is in.
Perfect confluence.
Perfect exhaustion.
Perfect euphoria.
The same pattern that ended EVERY Bitcoin mega-cycle… just printed again.
This wasn’t a top.
It was THE top.
The moment the bull cycle let out its final breath. 💀📈
🩸 2. Smart Money Has Already Left the Building
While retail celebrated “new highs,” Smart Money carved out:
• Stop hunts
• Liquidity grabs
• Breaker blocks
• Distribution ranges
• A devastating SOW
• And the cleanest market structure break BTC has shown since 2018
Institutions aren’t buying dips.
They are offloading the mountain .
The crowd doesn’t see it — yet.
⚡ 3. A Market Structure Collapse Echoing 2014, 2018 and 2021
Each cycle’s death began the same way:
A gentle pullback…
A sudden rejection…
Then a violent swing failure ,
followed by the HTF structure snapping in half.
That exact sequence is happening right now .
This is not a correction.
This is a cycle reset .
🎯 4. Fibonacci Retracements Don’t Lie — They Warn
Every true macro Wave 2 in history has returned to:
🔻 0.786
🔻 0.886
🔻 1.0 – 1.618 extensions
Where do they converge this time?
👇
🔮 $6,000 – $1,250
The forgotten land of 2017 mania…
A level BTC has avoided for 8 years.
But the cycle demands balance.
And balance always returns.
🌪️ 5. Price Action Has Flipped From Confidence to Panic
The candles have changed character:
• Weak closes
• Long tall wicks of rejection
• Failed rallies
• Imbalances breaking lower
• Bull traps everywhere
• A violent displacement to the downside
This isn’t cooling off.
This is unwinding.
📉 6. Market Cycle Psychology Has Entered Its Darkest Phase
We just exited Euphoria.
We are in Complacency.
Next comes:
😨 Anxiety
😱 Fear
💀 Capitulation
🔥 Anger
🌑 Depression
Only after that does a new accumulation begin.
And that’s why Wave 2 is infamous.
It destroys what Wave 1 built.
🚨 THE VERDICT: THE DOWNFALL IS IN MOTION — AND WE ARE EARLY
From $126K to $90K was not the crash.
It was merely the first spark in a forest full of dry leaves.
Wave A has barely begun.
Wave B will deceive.
Wave C will devastate.
The endgame target remains:
🎯 $1,250 – $6,000
The cycle reset.
The cleanse.
The opportunity of the decade — but only after the fire burns everything above it.
🔥 This is not fear. This is structure, math, psychology, liquidity, and time itself.
And all of them point in the same direction. Down, Down And Down
🔥 Follow this idea to stay ahead of the next macro move.
📈 We’ll update the chart as the structure unfolds — Wave A, Wave B trap, and the full Wave C capitulation zone.
💬 Drop your thoughts below — agree or disagree, the chart will decide.
🚀 Turn on notifications so you don’t miss the next critical breakdown.
⚠️ DISCLAIMER: This analysis is for educational and informational purposes only.
Not financial advice. Always manage risk and make decisions based on your own research and personal strategy.
#Bitcoin #BTC #Crypto #CryptoAnalysis #TradingView #BTCUSD #BearMarket #ElliottWave #SmartMoney #PriceAction #MarketCycle #Fibonacci #TechnicalAnalysis #CryptoCrash #CryptoWarning

ADA Price Prediction 2026CRYPTOCAP:ADA
What is Cardano (ADA)?
Cardano (ADA) often gets praised (or criticized) as a "research-driven" Proof of Stake (PoS) powerhouse. Its real edge however, lies in being a deliberate slow-burn contrarian bet against crypto's hype machine.
Founded by Charles Hoskinson in 2017, ADA skips flashy moonshots for formal verification and peer-reviewed papers. It turns the blockchain into a fortress for boring-but-bulletproof enterprise adoption rather than retail gambling.
ADA’s growth focuses on scalability, interoperability and sustainability while having a clear five stage development roadmap.
Cardano is not just "optimized for scalability", it is prepared for regulatory survival. Traditional chains like Ethereum drown in gas wars and exploits while ADA steadily marches along.
The Cardano Settlement Layer (CSL) and its Cardano Computation Layer comprise its two-layer design. This is fused with its Ouroboros PoS to enforce mathematical certainty over probabilistic chaos.
Such a combination creates a compliance powerhouse, equipping it when governments crack down.
Stake ADA not for 5% yields, but as digital gold for tokenized RWAs that banks can actually touch.
ADA's "slowness" is its genius. While others chase 2026 pumps, Cardano builds the infrastructure that survives when 90% of alts die. Controversially, it is less a trader's toy and more a sovereign wealth fund for the blockchain era.
ADA price prediction and outlook
Analysts project Cardano's trajectory through governance milestones, Leios scalability, and treasury yield strategies rather than rapid retail pumps. ADA's fixed 45 billion supply creates predictable staking economics.
It has ~71% locked yielding steady 4-5% Annual Percentage Yield (APY). This favors patient capital over speculative flips.
The Van Rossum Hard Fork and Ouroboros Leios position Cardano for enterprise DeFi, while $10 million RWA tokenization attracts regulated inflows. Forecasts for 2026 range $0.51 to $0.93 average, with bullish cases hitting $1.40 plus if the $0.82 Fibonacci clears.
Fear & Greed at 32 suggests accumulation before protocol catalysts ignite momentum. ADA rewards protocol conviction over market timing.
Market analysis, not investment advice.
ADA price history and performance overview
ADA price history
Cardano's ADA reached its all-time high (ATH) of $3.10 on September 2, 2021. This was fueled by decentralized finance (DeFi hype) and smart contract rollout through its Alonzo upgrade excitement during peak bull euphoria.
Conversely, its earliest recorded low hit $0.01733 on March 13, 2020 around the COVID market panic. ADA's boom-bust cycles tied to protocol milestones, governance shifts, and broader altcoin sentiment rather than fleeting partnerships.
This reveals Cardano's patient grind.
Well-known is its research delays which preserved capital while competitors burned out. It positioned ADA as crypto's "slow-but-steady" survivor through bear winters.
ADA's latest performance
From January 13 to 20, 2026, ADA traded between $0.395 lows and $0.428 highs. It delivered a positive 4.2% weekly gain with the van Rossem hard fork buzz and Leios scalability previews driving momentum.
Market cap stabilizes around $15.2 billion with 35.9 billion ADA circulating from 45 billion total supply. Recent ADA price charts show consolidation near $0.415 after modest 18% year-to-date (YTD) recovery from 2025's 72% crash, but momentum builds.
Staking inflows defend key supports while governance treasury unlocks spark measured upside tests. It is mirroring Cardano’s compression behavior before its potential surge to the upside in 2026.
On-chain and technical analysis
Support and resistance
ADA faces a pivotal stand at $0.3663, now entrenched as primary support after rebounding from intraday lows of $0.3604 during consolidation. With its current intraday peak at $0.3740 and a sharp wick to $0.3409 just 36 hours prior (from weekly high $0.4277), the question lingers.
Can ADA anchor higher lows above $0.36 to rebuild momentum?
Next support layers at $0.355 and $0.34 align with recent volume shelves.
Resistance caps first at $0.38, then $0.40–$0.42.
Broader 2026 framing holds between $0.33 floors and $0.43 selling walls, with governance catalysts testing this range-bound structure.
Momentum indicators
Trading indicators reveal neutral positioning without overextension.
ADA's 14-day Relative Strength Index (RSI) hovers ~48–52 (balanced territory). On the other hand, its Moving Average Convergence Divergence (MACD) line flirts with zero-line crossover (histogram ~0.005 positive).
It underscores consolidation rather than explosive buying.
This setup echoes Cardano's measured tempo. It could justify its defense of $0.3663 because of its anticipated Leios upgrade sometime in 2026 and fork proposals.
Price confirmation however remains paramount.
Holding above $0.36 validates the bullish momentum. Conversely, slipping under $0.355 risks framing recent upward price action as a dead-cat bounce rather than protocol-driven continuation.
Moving averages and volume
On 4-hour charts, ADA clings above its 50-period moving average at $0.372 and 200-period moving average near $0.358. It maintains a constructive intermediate structure despite volatility spikes.
Volume rises on pullbacks to these levels show accumulation patterns, drawing institutional dip-buyers tied to steady staking (~70% supply locked). True upside conviction demands a clean $0.38 break with expanding volume.
This signals the next leg toward $0.43 resistance. Without it, range trading persists ahead of first quarter catalysts.
On-chain cues
ADA exchange reserves hit 2026 lows with staking ratio climbing to 71% (~25.5B locked), shrinking liquid supply. Active addresses up 15% YTD reflect governance participation increase, amplifying price sensitivity to treasury unlocks (e.g., January's 350 million ADA extension).
This setup primes outsized moves when protocol momentum aligns.
Key milestones for ADA
1. 2015-2017: IOHK Founded & Byron Launch
IOHK formed by Charles Hoskinson for peer-reviewed Cardano development. Mainnet launched July 2017 with Ouroboros PoS and ADA distribution.
2. 2018-2020: Shelley Staking Era
Shelley activated August 2020, enabling stake pools with ~70% ADA delegated for 4-5% APY security.
3. 2021: Alonzo & DeFi Launch
Alonzo Hard Fork (September 2021) introduced Plutus smart contracts. ADA hit $3.10 ATH, SundaeSwap debuted.
4. 2023-2024: Chang/Voltaire Governance
Chang Forks enabled Delegated Representative (DRep) voting and ~$600M treasury as a decentralized sovereign wealth fund.
5. 2025: Midnight & Leios Scaling
Midnight privacy chain launched with Ouroboros Leios (not full mainnet yet) targeting 10,000 TPS. Treasury diversified into DeFi yields.
6. 2026: Van Rossum Hard Fork
First Quarter Protocol version 11 activates with 350M ADA treasury extension for RWA tokenization and enterprise focus.
FAQ
How does Cardano's staking work?
ADA holders delegate to stake pools without losing custody, earning 4-5% APY from block rewards while securing the Ouroboros PoS network. Over 71% of supply currently participates.
What makes Cardano different from Ethereum?
Cardano's dual-layer design (CSL for transactions, CCL for contracts) and peer-reviewed Ouroboros provide deterministic finality. It avoids Ethereum's gas congestion and probabilistic risks.
When is the next Cardano hard fork?
Van Rossum Hard Fork (Protocol Version 11) targets the first quarter of 2026. It enhances DRep governance and paves the way for Leios scaling to 10,000 TPS.
Is Cardano suitable for real-world assets?
Absolutely. Its $10 million RWA tokenization fund and formal verification make ADA ideal for compliant, auditable asset tokenization like bonds and real estate.
What's ADA's total supply cap?
ADA’s total is fixed at 45 billion tokens with around 36 billion circulating. It ensures predictable inflation via staking rewards rather than unlimited issuance.

When I was heavily shorting $PLTR close to $200 many people wereWhen I was heavily shorting NASDAQ:PLTR close to $200 many people were telling me I had low IQ because I had no understanding about the company. I have not received a DM or reply for many weeks about Palantir.
They are all silent now. Palantir to double digits!

DAX40 4HR CHARTThe DAX is Germany's primary stock market index, tracking the performance of the 40 largest and most liquid blue-chip companies listed on the Frankfurt Stock Exchange, such as Adidas, BMW, and Siemens. It serves as a key barometer for the German and broader European economy, representing about 80% of the exchange's market capitalization.
German 10-Year Bond Impact
The German 10-year Bund yield acts as a benchmark risk-free rate in the Eurozone, influencing DAX valuations through its effect on discount rates for future corporate earnings and borrowing costs. Rising Bond yields, like the recent jump to 2.65% amid fiscal spending plans, often pressure DAX stocks downward by making bonds more attractive relative to equities and increasing company financing expenses, though optimism from economic stimulus can drive simultaneous gains as seen when DAX rose 3.7% alongside a 20bps yield spike. Conversely, falling yields support higher stock multiples by lowering opportunity costs.
ECB Rate Decisions
ECB rate cuts typically boost the DAX by reducing borrowing costs for companies, stimulating economic activity, and weakening the euro to aid exporters in the index. For instance, anticipated 25bps reductions have propelled DAX toward record highs by easing monetary restrictions and supporting growth-sensitive sectors. Hawkish holds or hikes, however, can weigh on the index via higher yields and tighter financial conditions.
#GER40 #EU10Y #GER40 #GER30 #DAX

BTC at a Significant Zone: Key Level to WatchBitcoin (BTC) is currently trading around a significant technical zone. If the price holds and shows clear acceptance above this area, it could indicate strength and increase the probability of an upward move. This zone will be critical in determining whether bullish momentum can continue.
Disclaimer: This analysis is for informational purposes only and does not constitute financial advice. Trading cryptocurrencies involves substantial risk, and losses can exceed expectations. Always trade responsibly. *
