ETHUSDOnce again 3,800 support holds price up. Waiting to see if we can get a break above H1 resistance and trendline to look for buys.
Trend Lines

GOLD → Consolidation. The fundamental backdrop is changing...FX:XAUUSD stabilizes after a week-long decline, failing to consolidate above $4050. The market is taking a pause before new impulses. Focus on 4030 and 3980...
Investors are closing positions before the end of the week and month, the reason being the uncertainty surrounding the deal with China and Powell's less dovish stance on policy: a 25 bp rate cut is already priced in. The probability of a December cut has fallen to 72.8% (from 91.1% a week ago). Powell emphasized that decisions depend on data, which is not available due to the shutdown.
The strong dollar (2-month highs) is putting pressure on gold. Weak data from China (PMI fell to 49.0) is reducing demand from the largest consumer.
The balance is tipping towards weak fundamentals...
Resistance levels: 4030, 4085
Support levels: 3982, 3955, 3915
Technically, bears are keeping the market below 4030 - strong resistance. If buyers enter the market (there are currently no fundamental reasons for this) and the bulls are able to break through 4030 and keep the price above this level, we will have a chance for growth. But under the current circumstances, I expect a correction to support before a possible rise.
Best regards, R. Linda!

ARDX – Double Rising Window Hints Bullish ContinuationARDX – CURRENT PRICE : 6.06
The stock has broken above its long-term downtrend line accompanied by strong volume (look at red arrow). This breakout was confirmed by the formation of a Rising Window (1), signaling the end of the previous bearish phase.
Another Rising Window (2) appeared recently, again on high trading volume, reinforcing bullish sentiment and indicating the likelihood of a continuation in the uptrend. Take note also that the RSI has climbed into bullish territory (above 50), suggesting a shift in momentum towards buyers’ control and further room for upside before reaching overbought conditions.
ENTRY PRICE : 5.80 - 6.10
FIRST TARGET : 7.00
SECOND TARGET : 8.00
SUPPORT : 5.11 (bottom of the Rising Window area)

EthereumEthereum's price was rejected at support at 3700, now in an uptrend heading towards the 0.5 Fibonacci level, favoring continuation of the long movement to the resistance at 4100.

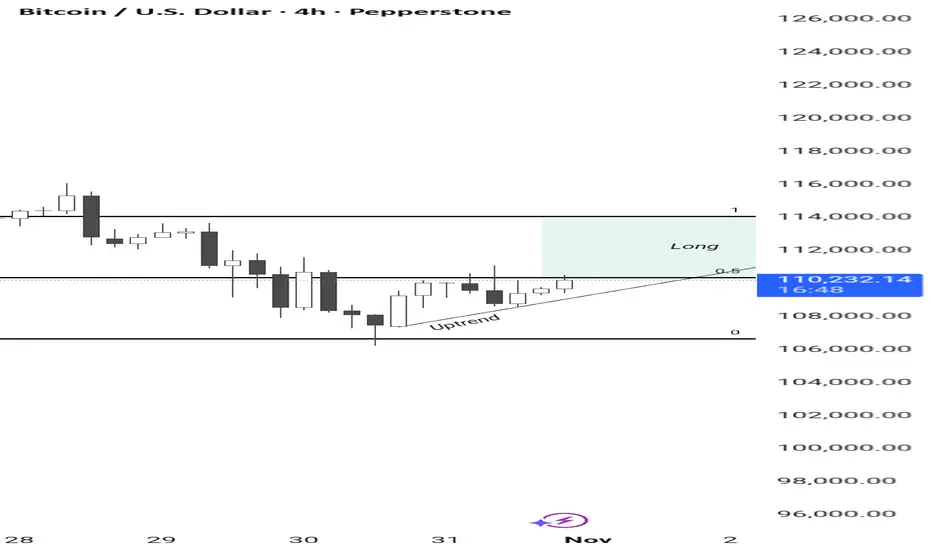
Bitcoin Bitcoin rejected the price at the support level of 107000, now in an uptrend at the 0.5 Fibonacci level, favoring a continuation of the long movement to the resistance at 114000.
critical 70k btc incomingbtc is looking extremely bearish with all indicators on negative divergence i doont see ant momentum and pass 120 we have topped on btc . if we go to 100k and dont hold we are going to btc go to next support around 70k

BTC DominanceBitcoin Dominance gives up 1 year after each halving. You should accumulate altcoin as long as Bitcoin dominance is above 50%.

Cardano - Realistic take4 separate times that RSI Divergence has occurred in oversold territory has hinted and displayed positive upside shortly after.
*Bullish Shark harmonic could be forming.
My current price to add more: ~.45 range.
No current TP at this time.

S&P Nearing Major Resistance (Update)This updates my previous S&P chart back last year showing the S&P still had room to run until any major resistance. We're nearing that major resistance at 7577. Looks like it might hit around January 2026.
The trouble is this trend is heating up and we needed a pullback to 6295. With all the excitement from Nvidia and other major Hyperscalers I'm worried it's going to just go straight to Major resistance. *If it does* we could be looking at a decently large pullback next year (finishing around August) down to that 6295 area and back into the supporting trend line for the next big uptrend to start.
If however we slow down here and get a pullback back to 6295 then I think we're good to make it over the major resistance without that big pullback next year.
Either way once we hit the major resistance at 7577 we'll need to get close to that lower trend line at some point to begin a new bull run.
Good luck and take caution as we approach this resistance!

GBPCHF signs of rising.GBPCHF got strong before market close today and broke the RESISTANCE. We will see when markets reopen if it is a real BreakOut or FakeOut for a continuing the Uptrend

GOLD (XAU/USD): Supply Zone Detected - Selling Now is HIGH RISKGold is retesting a key supply zone, which aligns with a recently violated horizontal support cluster and a rising trend line.
⚠️ HOWEVER —there’s a strong possibility that traders may aggressively sell, expecting a deeper bearish move.
For now, the price nicely respected the 3900 psychological support
that previously was a resistance.
Given the current setup, it’s best to avoid initiating short positions today.
Let’s hold off until the Fed Rate Decision announcement and observe how the market responds.

USD/CHF Coiled for November BreakoutThe Swiss Franc is back on the defensive this week, with USD/CHF up more than 1.2% in the wake of the Fed rate decision. The three-day advance has extended into technical resistance heading into the weekly and monthly close, and the focus now turns to a potential inflection off this key zone.
USD/CHF is trading within the confines of a proposed ascending pitchfork extending off the monthly lows. The break of the weekly opening-range on Fed-day extended into the 75% parallel with price now testing resistance at 8040- a region defied by the 100% extension of the advance off the monthly low and the April swing low. A topside breach / close above this threshold would expose the September / October swing highs at 8072/76. Strength surpassing this hurdle would be needed suggest that a more significant low is in place / a larger trend reversal is underway with subsequent resistance objectives eyed at the 100% extension of the broader September advance at 8120 and the August high / May low at 8172/85 (both levels of interest for possible exhaustion / price inflection IF reached).
Initial support rests with the August low-day close (LDC) at 8007 and is backed by the objective October open at 7964. Losses below this threshold would invalidate the near-term uptrend with a break / close below the July LDC at 7911 ultimately needed to mark resumption of the broader downtrend towards the yearly lows.
Bottom line: USD/CHF continues to coil within the broader September range, and the focus is on a breakout of this multi-week consolidation pattern. From a trading standpoint, a good zone to reduce long-exposure / raise protective stops- losses should be limited to 7964 IF price is heading higher on this stretch with a close above 8076 ultimately needed to fuel the next major leg of the advance.
-MB

All Priced In - Selling to CommenceFundamentals all baked in with price to sales ratio at previous 2021 post-covid highs will push to profit locking and selling pressure.
NASDAQ:GOOGL price target in the ~$230 range.
RSI weekly divergence and upper log line hit confluence with top fundamental ratios.

How to trade gold stably as the weekly and monthly charts close?#XAUUSD TVC:GOLD OANDA:XAUUSD
As we expected, gold broke through the previous strong resistance at 4030 and continued its bullish trend, reaching a high of 4046, very close to our target of 4050. Although the price of gold retreated somewhat after the brief surge, from the daily chart, the short-term price of gold is still above the MA5 moving average, while from the 4-hour chart, the middle band coincides with the MA20. Therefore, I don't think this means the bulls have given up; on the contrary, it's more like a way to better accumulate momentum at the bottom. This strategy remains effective, and we can still consider going long on gold when the price retraces to the 3985-3975 range.

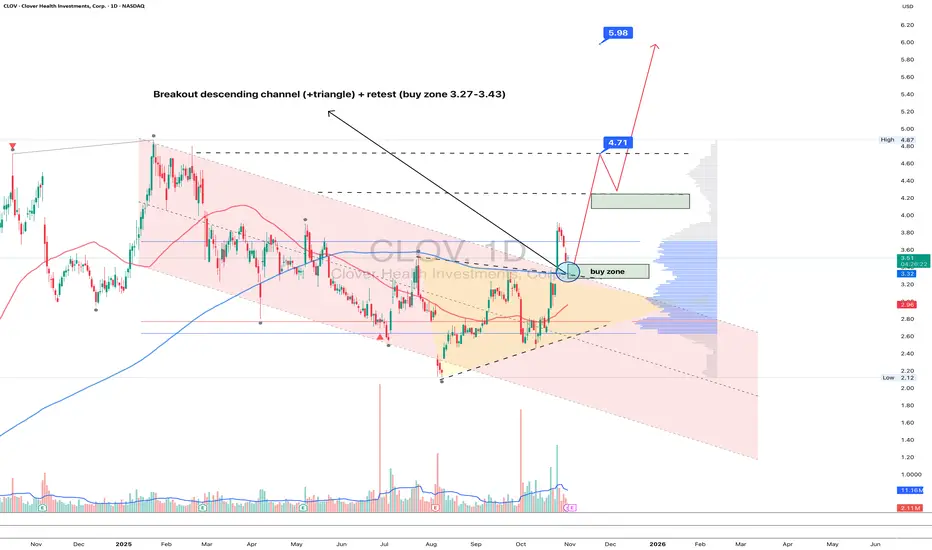
CLOV 1D - Health Is Back in TrendOn the daily chart, Clover Health (CLOV) has broken out of its descending channel and triangle, now pulling back for a retest near 3.27–3.43 - a key buy zone aligned with the MA50. Buyers are clearly regaining control, and the setup looks ready for continuation.
Technically:
– first clean breakout of the downtrend since January 2025;
– volume expansion on bullish candles, suggesting institutional accumulation;
– holding above the former resistance turned support.
Upside targets: $4.71 (local volume peak) and $5.98, offering +70% potential upside if momentum sustains.
From a fundamental perspective, Clover Health is stabilizing its business:
– a leading player in Medicare Advantage, with an expanding senior member base;
– Q3 results show 40% reduction in net loss and +18% YoY revenue growth;
– leveraging AI-driven healthcare analytics to improve efficiency and patient outcomes;
– with high short interest, a confirmed breakout above $4.70 could ignite a short squeeze.
Tactical plan: accumulation near 3.27–3.43, add above 4.70, targets 4.71 → 5.98. Sometimes the healthiest trend is the bullish one.
SOL/USDT: Bearish Channel Holds as Price Faces Mid-Range ResistSOL/USDT is consolidating inside a downward channel, with a clear sequence of lower highs and impulse legs defining the structure. Price is currently hovering near mid-range resistance, showing hesitation below the descending trendline.
A rejection at this level could lead to a move back toward the $169 support, completing the projected downside leg. The broader tone remains bearish while channel boundaries continue to guide and limit momentum.

LCI LongThe primary long-term trend remains bullish, as the 200-day SMA (black line) is sloping upward and price has taken support from it..
RSI suggests weak momentum, close to the oversold zone, hinting at possible short-term rebound potential.
In my view, stock broke the trendline yesterday and today, it tried to break above it but couldn't succeed. If it breaks it next week, it will be a very positive signal.
The stock seems to be bouncing from support. A decisive daily close above 310–316 would be the first bullish signal of trend reversal.
If the price holds above 300 and closes above 316–320, momentum could turn positive.
Upside targets: 330 → 363 → 392.

NZDJPY the 90.00 is target but after short-term fall first The broader technical structure for NZDJPY remains fundamentally bullish. However, our analysis suggests the pair may be due for a short-term corrective pullback before the primary uptrend resumes.
We are monitoring two potential scenarios:
Direct Continuation: The market could continue its upward momentum imminently, with an initial projected target offering a 200-pip gain from the current level.
Corrective then Impulsive (Preferred Scenario): A more probable path is a deeper 300-pip corrective decline towards a key support zone. This would create a more robust technical foundation. A strong bullish reversal from that support would then be expected to initiate the next significant impulsive wave, targeting a 500-pip advance toward the primary objective at the 90.00 psychological and technical resistance level.
A strategic approach would be to wait for a confirmed bullish reversal following any potential pullback, entering with a stop-loss placed below the identified support to define the risk clearly.
DISCLAIMER: ((trade based on your own decision))
<<press like👍 if you enjoy💚

USDJPY Eyes 153.20 Support as Fed Signals Patience on Rate CutsHey Traders,
In today’s trading session, we’re monitoring USDJPY for a buying opportunity around the 153.200 zone. The pair remains in a broader uptrend and is currently in a correction phase, approaching a key support and resistance area aligned with the ascending trendline.
Structure: USDJPY continues to print higher highs and higher lows, maintaining strong bullish momentum. The 153.200 level serves as a critical zone of confluence where buyers have historically stepped in.
Fundamentals:
Recent Fed commentary emphasized patience before cutting rates, citing the need for more evidence of cooling inflation. This reinforces a hawkish tone, supporting the Dollar
Trade safe, Joe.

XAUUSD – Gold Eyes a Breakout Above $4,030: Momentum Still Build🟢 XAUUSD | Gold Breakout Setup – Educational Analysis
Gold continues to show constructive price action following sustained bullish momentum across intraday timeframes. After a healthy consolidation phase, the market is now testing a critical resistance zone around $4,030.
A clean breakout and confirmed 1H close above $4,030 would signal renewed strength, aligning with the broader bullish structure observed on higher timeframes (4H & Daily).
🔹 Technical Outlook
The current structure suggests the potential for continuation toward higher liquidity zones if the breakout holds.
Sustained trading above $4,030 would confirm buyer control, invalidating the short-term correction phase.
📈 Trade Plan (Educational Setup)
Entry (Buy Stop): $4,030
Stop Loss (SL): $4,000
Take Profit Targets (TP):
TP1 → $4,060
TP2 → $4,090
TP3 → $4,120
TP4 → $4,150
TP5 → $4,180
TP6 → $4,210
💡 Analyst’s Commentary
This setup aims to capture the potential breakout continuation, with risk contained below the $4,000 psychological support.
Momentum confirmation on H1 and H4 closes will be key for trade validation.
Traders may consider partial profit-taking along the way and trailing stops to secure gains.
⚖️ Risk/Reward: ≈ 1 : 3.5
🕓 Timeframe: H1 – Short-Term Swing
⚠️ Disclaimer:
This analysis is shared for educational and research purposes only as part of Middle East Trading Academy’s ongoing market study.
It does not constitute financial advice or an investment recommendation.

GBPCHF: The Fake Breakout Tale
This is the daily chart!
It is broken below a main level!
but it might be fake!
Most of the CHF start to change their direction after reaching this level.
GBPCHF will by a great probability.
And this is the chart of latest 3M! a bearish channel is obvious here!
Fluctuations are considerable for this pair!
Two Scenarios are clear in it!
We might break the yellow up,
Or we might react to the green

GOLD | Bearish Momentum Holds Below Pivot Zone GOLD | Bearish Momentum Holds Below Pivot Zone
Gold remains under bearish pressure as it trades below the pivot zone at 4,034–4,053, signaling continued weakness amid cautious sentiment ahead of upcoming U.S. data.
🕯 Momentum remains negative, but a breakout above the pivot zone could quickly shift the tone back to bullish.
Key Levels
Pivot Zone: 4,034 – 4,053
Resistance: 4,082 · 4,105 · 4,189
Support: 4,004 · 3,982 · 3,921
Trading Plan:
Sell Setup: Shorts valid below 4,038, targeting 4,004 / 3,982 / 3,921.
Buy Setup: Longs valid only above 4,053, targeting 4,105 / 4,152.
Premium Takeaway
Gold remains in bearish control below 4,053, with potential to drop toward 3,982–3,921.
A confirmed 1H close above 4,053 would shift bias to bullish, opening the path toward 4,105–4,189 in the short term.

CADCHF — Daily vs 4H ChartCADCHF — Daily vs 4H Chart 📉
The overall trend remains bearish, and I don’t see any sign of a Market Structure Shift (MSS) yet.
On the 4H timeframe, I notice a short-term bullish move, but I expect a bearish reaction from the Daily “Orange” resistance zones.
I’ll look to sell once a clear price-action confirmation appears.
Target: Nearest psychological level
🎯 Goal 001 → 0.55200
OANDA:CADCHF
