Natural gas Near expiration, the spread between spots and future is about 1000 pounds, it may goes to ranges between 3.5-3 7. But near target is about 3 95
Trend Lines

POTENTIAL BUY CONTINUATION ON USDCAD or lowerlevelsThis position on USDCAD here and if it break, we tap into the lower level for the buy.
This looks like a return to base with structure (if the next few candles present bullish opportunity)
Will keep an eye on it to see whether an opportunity present itself

AB=CD Harmonic pattern on EURJPY: CAN THE SHORT BE FOR LONG?Recent push by EURJPY into higher highs have formed a AB=CD harmonic pattern on that indicates a potential reversal. As like every trading strategy that comes with pros and cons, it is best to trade with sufficient SL as the trade is a potential interest to me

Liquidity Hunter | Smart Money PlaybookSmart Money Footprint | Market Structure & Liquidity Trader
Hunting liquidity sweeps and smart money footprints across major sessions.
I break down the market the way institutions move it:
SFP • Break of Structure • Premium/Discount • Session Timing • Fakeouts
Daily charts, scalps, and tactical explanations.
Follow if you want to trade with the real flow — not against it.
Drop a comment once at all this information 🤑🔥❤️📉

It's Clear... Isn't it? This chart lays out the cycle tops and bottoms of bitcoin going back to the halving in 2012.
What we can clearly identify is that every major cycle low started a run for 1065 days into new All time Highs.
If this is true still, we should be headed down for an entire year.
However,
like many indicators, I believe they become unusable.
Over time if something works, too many people use it to identify a trade, whether that's institutions or retail as a collective.
This chart should scream bear.
However, I love the counter trade.
Every major figurehead is screaming bear, I just don't believe that to be the case. If everyone is shorting, what happens. if everyone sold what happens.
Counter trade. Most people think they understand, until they don't.
A trade can always flip, you cannot hold conviction because you want it to go a certain way, you have to be ready to change your mind when the time is right.
I am Bullish. For now.
Run the table.
BITSTAMP:BTCUSD

Will gold prices fall again after bottoming out and rebounding?Gold Technical Analysis: Gold prices initially fell below 4000 today, but rebounded during the US session. A significant reversal in initial jobless claims data propelled gold to around 4082, reversing the overall downward trend and pushing prices back into range-bound trading. While there were intraday rebounds, gold ultimately met resistance and fell, with higher highs continuing to decline, indicating a clear overall weakness. As I repeatedly emphasized yesterday, gold was poised for a drop, and I stressed the 4100 resistance level. I also repeatedly highlighted the strategy of selling on rallies. The key resistance level to watch is the 4080-4100 range, which was the sideways trading area at the end of yesterday's session.
Currently, the bears still have the upper hand. The short-term effective support is in the 4000-3990 range, while the resistance has been emphasized in the 4080-4100 area. If this area is touched again, another short position can be taken. In short, today's theme is still a weak downward trend with fluctuations. In terms of operation, you can wait for entry based on the above support or resistance levels. The slowdown in the fluctuation pace has extended the market cycle, so every entry requires sufficient patience.

tradingview is faggots posted idea at 102k and they made it hidden.
Freedom of speak. Constitution rules not you.

BTC USd still down trend Btc hadn’t is still in downtrend it make bullish divergence but it only plays for lower highs also perfectly respected trend line

Short first, then long; perfectly grasping the market rhythm.On Tuesday, the bottoming strategy suggested that gold should pay attention to the 4000 level for a rebound and correction. As expected, it rebounded to around 4040. After the opening, a short position was arranged at 4052, which reached the profit target of 4030 as expected. Then, a long position was arranged at 4000, which was closed at 4015. The intraday strategy was to first short and then long, reaping a profit of 37 pips!
Gold prices continued their weak opening on Tuesday, with selling pressure emerging after breaking below short-term moving averages yesterday. Although delayed data such as the September non-farm payrolls will be released this week, the results may reinforce the Federal Reserve's stance of holding rates steady, putting continued pressure on gold prices. Overall, gold prices are likely to adjust this week. With no major data releases today, the market focus is on speeches by Federal Reserve officials and changes in expectations for interest rate cuts.
Gold's technical outlook remains bearish. The hourly chart is still within a standard downward channel. After rebounding to around 4055 at the open, it fell back again, indicating a weak corrective structure. No effective reversal signal has been seen in the short term. The strength or weakness of the European session will be the key observation point for today's trend. The watershed above is still the 4045-4070 area. As long as the price continues to be pressured below this range, the bearish structure is likely to continue. The first support level to watch is the 4000 mark. If it breaks down effectively, the bearish target will continue to be around 3980. In terms of trading strategy, if there is a rebound to the 4045-4070 area before or after the European session, consider shorting gold in batches, following the channel structure. The overall outlook remains bearish.

$ETH Macro planI made this CRYPTOCAP:ETH cheatsheet. I'm looking to bid 2900-2700 area. As you can see we lost the level on weekly timeframe. And retesting it this week. A close below means we will likely go to my marked area.

IREN on $48 Support Target $98IREN looks to be holding support still even with all the flood of fear through the market. I've never seen so much talk of a bubble when there's zero signs of a bubble. This would lead me to suspect IREN will hold the green trend line and follow the course up from here. But it's important to keep in mind that red trend is it's long term trend.

A rebound after hitting bottom is bound to face pressure again.#XAUUSD OANDA:XAUUSD TVC:GOLD
Gold rebounded after falling to around 3997, forming a V-shaped pattern and has now largely recovered its Asian session losses. However, judging from the timeline, the mid-term correction is not yet completely over. During the NY session, we should continue to pay attention to the 4000-3980 range. Only a break below this level can open up further downside potential. Similarly, as I mentioned before, the market is expected to remain volatile before the data release, so the short-term upside resistance level to watch is 4055-4060, and the key resistance level is 4080-4090. If gold prices first touch 4055-4060 and encounter resistance during the NY session, consider shorting gold with a small position.
Gold: Watching for a Short Squeeze Into 4100 SupplyGold is trading inside an ascending micro-channel and building pressure for a potential short squeeze into the major supply zone between 4085–4100.
This zone lines up with:
HTF supply
Channel resistance
Liquidity resting above previous highs
Session timing confluence (afternoon reversal window)
My Plan:
Expecting a possible final squeeze into 4100 followed by a sharp fade/sell-off into the afternoon session. This would create a high RR A+ reversal setup if price rejects the supply zone with clean structure.
Why This Matters
Momentum is still bullish intraday, making the squeeze likely
But macro levels above are stacked with sellers
Perfect scenario for liquidity grab → reversal
Levels to Watch
🔼 4085–4100 (sell zone / squeeze target)
🔻 4050
🔻 4025
🔻 4000 (major intraday target if rejection is strong)
Bias: Bearish after the squeeze completes.
Invalidation: Strong breakout + acceptance above 4105.

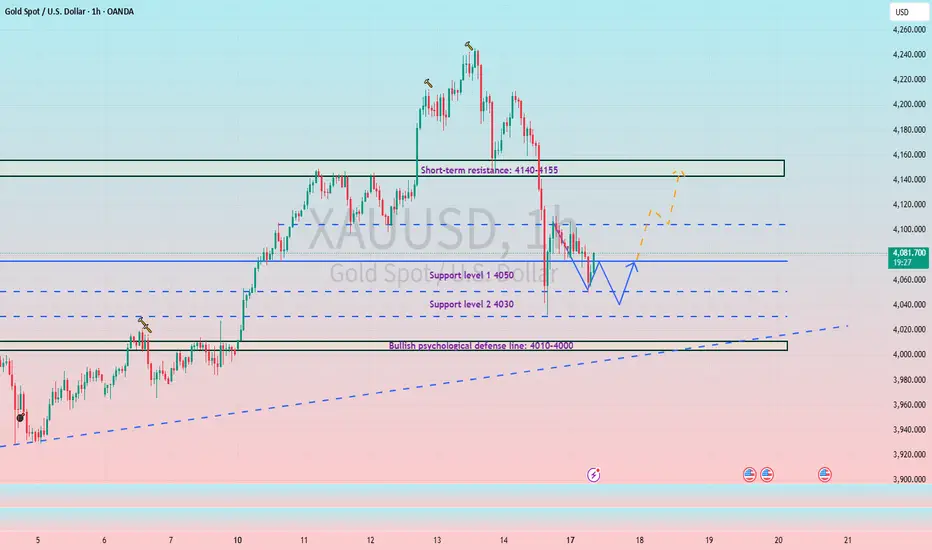
Gold Rebounds at Channel Support – Short-Term Bullish OutlookXAU/USD – Gold Analysis
After the recent drop in gold and the continued strength of the U.S. dollar, price has reached the lower boundary of the ascending channel. As long as this level doesn’t break, it remains a positive sign. Today’s candle has left a bullish wick with a solid body, showing that there is still buying interest at this support.
For today, I expect gold to move toward the mid-channel area, where the next reaction will give us more information about the short-term trend. Even though gold appears to be forming a bearish structure overall, it still needs to grab liquidity to the upside before continuing lower.
That’s why, for now, my bias for today is bullish, expecting a corrective move upward before the market decides its next major direction.

EURAUD Buy IdeaA clear bullish structure is shown with price creating HHs and HLs. We aim to get a retracement into the premium zone for a buy to the previous high.

Gold Falls as Rate-Cut Bets Fade | Bears Take ControlGOLD | Overview
Gold extends its decline for the fourth straight session as traders scale back expectations for further Fed rate cuts this year.
Several Fed officials have signaled caution, pushing rate-cut odds below 50%, while investors wait for delayed U.S. economic data to gauge the economic outlook.
This shift in sentiment continues to pressure gold in the short term.
Technically:
Gold remains in a bearish structure while trading below the 4054 pivot level, with downside momentum targeting 4015 and 3983.
A break below 3983 would extend losses toward 3962.
A bullish recovery would require a 1H candle close above 4055, which could lift the price toward 4083 and 4105, with further extension to 4135 if buying strength increases.
Key Levels
Pivot Line: 4054
Support: 4015 · 3982 · 3962
Resistance: 4083 · 4105 · 4135

How to properly seize gold trading opportunities?Gold Technical Analysis: Reviewing yesterday's gold price performance, it showed a clear downward trend overall. Specifically, the gold price moved downwards along the five-day moving average. This trend often suggests a short-term weak market from a technical analysis perspective. During the US session, the gold price experienced a significant decline, which undoubtedly exacerbated the tense atmosphere in the market.
From the daily chart analysis, gold closed yesterday with a medium-sized bearish candlestick with upper and lower shadows. This candlestick pattern contains a wealth of market information. The presence of the upper and lower shadows indicates that both the bulls and bears exerted their strength briefly during the struggle, but ultimately the bears prevailed, pushing the price lower and closing with a bearish candlestick. This forms a "three-day losing streak" pattern on the daily chart, indicating a short-term weak trend. From a trend perspective, the bearish pattern in the gold market remains unchanged.
Based on the above technical analysis and market trends, we can make a reasonable prediction for the future price movement of gold. We expect the price to further test the support level of the daily chart's lower trendline. Therefore, our trading strategy for today remains unchanged: shorting on rallies. Specifically, we will focus on the 10-day moving average as our entry point for shorting. On the downside, we will first look at yesterday's low. If the price breaks below yesterday's low, we can expect it to fall further. Taking into account various factors, we have identified the following specific resistance and support levels. The resistance levels are 4050-4070 and 4100, respectively. These levels have historically exerted downward pressure on prices and are key resistance areas that we need to pay close attention to during trading. The support levels are 4005-3980 and 3930, respectively. These levels are crucial points where prices may find support and rebound. Regarding trading recommendations, we suggest entering short positions in the 4050-4070 range. It is important to note that the market is fraught with uncertainty and risk, and the above trading strategy is for reference only. When making investment decisions, investors should fully consider their own risk tolerance and investment goals, and make decisions prudently. We hope every investor can have good luck in the market and achieve their investment goals. In summary, today's gold trading strategy is to primarily sell on rallies and secondarily buy on dips. The key resistance level to watch in the short term is 4050-4070, and the key support level is 4005-3980. Please keep up with the pace.

Gold Eyes 4,000 — Key Buy Zone Ahead!!Hey Traders,
Today we’re keeping a close watch on XAUUSD, which continues to trade firmly within its medium-term uptrend. Price is currently pulling back in a healthy correction, and the 4,000 zone stands out as a major confluence level — a structural support, previous reaction area, and dynamic trend touchpoint.
A controlled dip into this zone could attract fresh buyers, especially with markets still leaning toward risk caution and demand for safe-haven flows remaining elevated. As long as the broader trend structure holds, Gold may attempt another leg higher from this area.
Trade safe,
Joe.

AUDUSD: Watching 0.6470 as Fed Cut Bets GrowHey Traders,
In today’s session we’re monitoring AUDUSD for a potential buying opportunity around the 0.64700 zone. The pair remains in a clear uptrend, and price is currently pulling back toward a major trend support / S&R confluence at 0.64700 — a level where bulls have previously stepped in with conviction.
On the macro side, I continue to think that the incoming data will ultimately force the FED into a December cut, despite the market still being mixed on the odds. If that scenario plays out, it would set the stage for broad USD weakness, which aligns perfectly with a bullish continuation on AUDUSD.
A reaction from the 0.64700 area could offer a solid continuation setup if the trend structure holds.
Trade safe,
Joe.

GOLD → Retest 4050 in a weak market...FX:XAUUSD is bouncing off support at 4000 and forming a correction towards 4050, an important resistance level. The market's main focus is on the September employment report (NFP), which will be released on Thursday.
Key pressure factors:
The strong dollar is supported by hawkish statements from the Fed and risk aversion. The probability of a rate cut in December has fallen to 42%.
Support for gold: Demand for government bonds has lowered the yield on 10-year Treasuries, allowing gold to rebound to $4045.
A series of negative labor market reports keeps risks alive.
Gold remains under pressure. A break below $4000 will open the way to $3950, while a rise above $4050 will require weak NFP data or dovish Fed rhetoric. The week will determine the direction
Resistance levels: 4050, 4090
Support levels: 4000, 3965
The market is beginning to doubt the local bullish structure. Strong trend support is breaking down and the previously broken level is being retested. If the bears keep the price below 4045-4050, gold could continue to decline. However, it is worth keeping an eye on the news in the second half of this week...
Best regards, R. Linda!

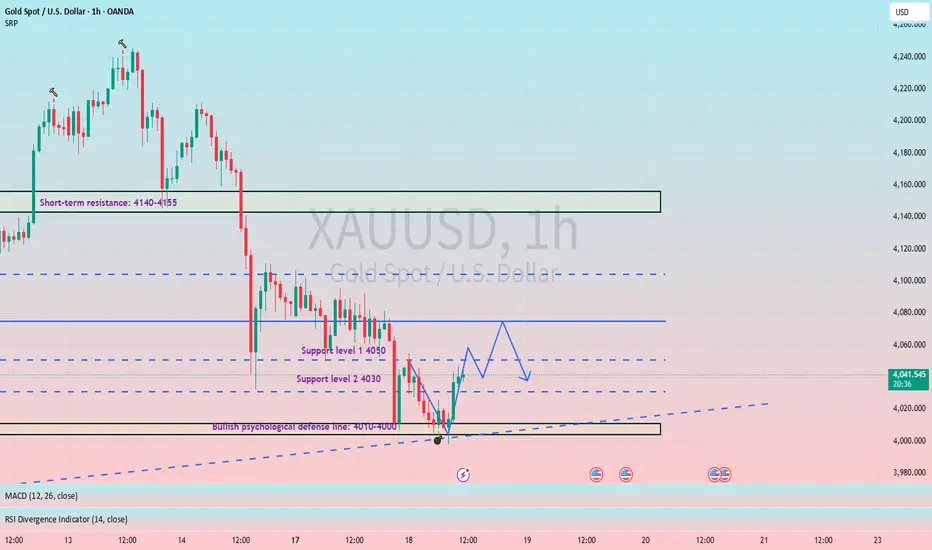
How to navigate volatile market conditions after the government #XAUUSD TVC:GOLD OANDA:XAUUSD
As I mentioned on Friday, if the closing price failed to stabilize above 4110-4120, gold would weaken further on Monday. Sure enough, gold again fluctuated downwards, testing the 4050 support level.
With Friday's panic selling gradually subsiding and the US government reopening, significant fluctuations are unlikely in the short term. Key data such as NFP and PMI may be released this week. Before the data is released, the market may be relatively cautious, and I think the market may tend to fluctuate and recover.
Short-term support levels to watch are 4050-4030. If the price retraces and tests this support again during the European session, we can try to continue going long on gold.
USD/CAD: Breakout Alert: 2 Strong Bullish Patterns Say YesAs you can see, 📈USDCAD is resuming its growth.
After completing a bullish accumulation, the price is currently breaking both the neckline of an ascending triangle and of an inverted head and shoulders formation on a 4H timeframe.
I anticipate that the price will continue to rise and reach the 1.4070 resistance soon.

$BTCUSD: $77KBITSTAMP:BTCUSD looks like it's coming down to the yellow line -- $77K area. It's in free fall right now. Let's see if it'll bounce there.
