ETH-The final drop before the cows come home (SHORT TERM SHORT)hello all 👋🙋♂️🙋♀️ Thank you so much for coming today
Let's get right to it💡. Today we are looking at a 4 hour view of ETHEREUM. I have noticed several things about ETH price action and what it could indicate.
⬆️ above on chart 📈📉 you can see I have labeled
major trend line (support line)
We have made contact with this long standing trend line and have seen some bullish pressure after doing so.
🤸🤸♂️
HOWEVER
There has been a Head and shoulders bearish pattern formed on the 4 hour view in which we did go down from but bounced back up to make a bearish flag 🐻🧸
🌊🏄♂️🏄♀️
MORE RECENTLY
We have formed a bearish harmonic pattern, which leads me to believe we will try to continue our head and shoulders pattern (with a drop in price) ⏬🔻But will catch support at our major trend line ~(3800)
🐼This is a Short term short Idea. The cryptocurrency market is extremely volatile.💣
This is not financial advice
🐶
Always have a stop loss ✋🛑💲 set🆗
Any thoughts 💭💡, questions 🙋♀️🙋♂️❓, good 👍, bad👎, happy 😄 or sad 😥, in the comments always welcome.😄
Jazerbay ☯️
Trendlinebounce

Role of International Trade1. Promotes Economic Growth
One of the most significant roles of international trade is its contribution to economic growth. By opening access to larger global markets, countries can sell more than they could within their domestic boundaries. This increased demand encourages higher production, leading to better utilization of resources and economies of scale. Export-oriented industries often grow faster, contributing positively to a nation’s Gross Domestic Product (GDP). For developing countries, international trade provides opportunities to accelerate growth by integrating with global value chains.
2. Efficient Allocation of Resources
International trade is based on the principle of comparative advantage, which states that countries should specialize in producing goods and services they can produce most efficiently and at lower opportunity cost. For example, a country rich in natural resources may focus on mining or agriculture, while a technologically advanced country may specialize in manufacturing or services. This specialization leads to efficient allocation of global resources, minimizing waste and maximizing productivity worldwide.
3. Enhances Consumer Choice and Living Standards
Trade allows consumers access to a wide variety of goods and services that may not be available domestically. Products such as electronics, automobiles, medicines, clothing, and food items can be sourced from different parts of the world at competitive prices. Increased competition among producers also leads to better quality and innovation. As a result, consumers enjoy lower prices, improved quality, and greater choices, which significantly enhances living standards.
4. Encourages Industrial Development
International trade supports industrialization, especially in developing and emerging economies. Exposure to global markets encourages industries to improve efficiency, adopt new technologies, and meet international quality standards. Export-led growth strategies have helped many countries transform from agrarian economies into industrial powerhouses. Trade also attracts foreign direct investment (FDI), which brings capital, managerial expertise, and advanced technology.
5. Generates Employment Opportunities
Trade expansion leads to job creation in export-oriented industries such as manufacturing, agriculture, logistics, shipping, finance, and information technology. As companies expand production to meet global demand, they require more labor. Although trade can sometimes lead to job displacement in less competitive sectors, overall it creates better employment opportunities and encourages skill development. Governments can support workforce transition through training and education programs.
6. Facilitates Technology Transfer and Innovation
International trade plays a crucial role in spreading technology and innovation across borders. Imports of advanced machinery, equipment, and software help domestic industries modernize production processes. Multinational companies often share best practices, research methods, and technical knowledge with local firms. This exchange accelerates innovation, increases productivity, and strengthens a country’s technological capabilities.
7. Strengthens International Relations
Trade fosters cooperation and interdependence among nations. Countries engaged in trade are more likely to maintain peaceful relations, as economic ties create mutual benefits. Trade agreements and economic partnerships promote dialogue, trust, and collaboration on broader global issues such as climate change, security, and sustainable development. Thus, international trade also plays a diplomatic role by strengthening global stability.
8. Supports Economic Diversification
For many countries, especially those dependent on a single commodity or sector, international trade encourages diversification. By exploring new export markets and products, economies reduce dependence on limited resources and minimize vulnerability to price fluctuations. Diversification improves economic resilience and helps countries better withstand global economic shocks.
9. Increases Government Revenue
Trade generates significant revenue for governments through customs duties, tariffs, and taxes on imports and exports. These revenues can be used to fund public services such as infrastructure, healthcare, education, and social welfare programs. While many countries are reducing tariffs under free trade agreements, trade-related economic growth still expands the tax base.
10. Promotes Global Economic Integration
International trade is a foundation of globalization. It connects countries into a single economic system where goods, services, and capital flow more freely. This integration helps align production standards, financial systems, and business practices. While globalization presents challenges such as inequality and environmental concerns, its benefits—driven largely by trade—have lifted millions out of poverty worldwide.
11. Challenges and Responsible Trade
Despite its advantages, international trade also presents challenges. Trade imbalances, protectionism, unfair trade practices, environmental degradation, and social inequality are important concerns. Therefore, the role of international trade must be supported by fair trade policies, strong regulations, environmental protection, and inclusive growth strategies. Sustainable and ethical trade ensures that the benefits are widely shared.
Conclusion
The role of international trade in the modern world is multifaceted and indispensable. It drives economic growth, promotes efficiency, enhances consumer welfare, supports industrial and technological advancement, and strengthens global cooperation. While challenges exist, well-managed international trade remains a powerful engine for development and prosperity. In an increasingly interconnected global economy, countries that actively and responsibly engage in international trade are better positioned to achieve long-term economic stability and improved quality of life for their citizens.

Global Currency Reset: Concept, Drivers, and ImplicationsThe idea of a Global Currency Reset (GCR) refers to a broad restructuring or realignment of the world’s monetary and currency systems. It is not a single event with a universally agreed definition, but rather a conceptual framework used to describe major changes in exchange rates, reserve currencies, monetary policies, and global financial architecture. Throughout history, global currency systems have undergone resets—sometimes gradually and sometimes abruptly—driven by economic crises, geopolitical shifts, technological change, and evolving trade relationships. In the modern context, discussions around a global currency reset have intensified due to rising debt levels, inflationary pressures, digital currencies, and the changing balance of global economic power.
Historical Background of Currency Resets
Historically, currency resets have often followed periods of severe economic imbalance. One of the most prominent examples was the Bretton Woods system established after World War II, which pegged major currencies to the US dollar, and the dollar itself to gold. This system effectively reset the global monetary order, stabilizing exchange rates and facilitating post-war reconstruction. However, when the United States suspended gold convertibility in 1971, the world transitioned to a fiat currency system, marking another significant reset.
Other examples include hyperinflation-driven currency reforms in countries like Germany (1923), Zimbabwe (2009), and Venezuela (multiple times), as well as the formation of the Eurozone, where multiple national currencies were replaced by a single shared currency. These episodes illustrate that currency resets are not theoretical—they are recurring responses to systemic stress.
Key Drivers Behind a Global Currency Reset
Several structural forces are often cited as drivers that could lead to a global currency reset in the modern era:
Excessive Global Debt
Governments, corporations, and households worldwide are carrying historically high levels of debt. When debt becomes unsustainable, currencies may be devalued, restructured, or replaced as a way to reduce real debt burdens.
Inflation and Monetary Expansion
Large-scale money printing, especially after financial crises and pandemics, has increased concerns about currency debasement. Persistent inflation can erode trust in fiat currencies, increasing calls for monetary reform.
Shift in Global Economic Power
The dominance of the US dollar has been a cornerstone of the global financial system. However, the rise of emerging economies, particularly China and India, has fueled discussions about a more multipolar currency system.
Geopolitical Tensions and Sanctions
Economic sanctions and trade conflicts have encouraged some nations to reduce dependence on the dollar and develop alternative payment systems, accelerating fragmentation in the global currency framework.
Technological Innovation
The emergence of blockchain technology, cryptocurrencies, and central bank digital currencies (CBDCs) is reshaping how money is issued, transferred, and stored, potentially laying the groundwork for a reset.
Role of the US Dollar and Reserve Currencies
At the heart of global currency reset discussions lies the role of the US dollar as the world’s primary reserve currency. The dollar dominates international trade, foreign exchange reserves, and global debt markets. While this dominance provides stability and liquidity, it also creates vulnerabilities. US monetary policy decisions have global consequences, sometimes leading to capital flows, currency volatility, and financial instability in emerging markets.
A global currency reset does not necessarily imply the collapse of the dollar, but it could involve a rebalancing—with greater roles for other currencies such as the euro, Chinese yuan, or even a basket-based system similar to the IMF’s Special Drawing Rights (SDRs).
Digital Currencies and the Reset Narrative
One of the most transformative elements in modern currency discussions is the rise of digital currencies. Central banks around the world are exploring or piloting CBDCs to improve payment efficiency, enhance financial inclusion, and maintain monetary sovereignty in the face of private cryptocurrencies.
CBDCs could act as a soft reset by changing how money circulates without abandoning existing currencies. On the other hand, decentralized cryptocurrencies like Bitcoin are often viewed by proponents as alternatives to fiat systems, especially in countries facing currency instability. While unlikely to replace national currencies entirely, they influence how people perceive and trust traditional money systems.
Potential Forms of a Global Currency Reset
A global currency reset does not have to be a dramatic overnight event. It can take multiple forms:
Gradual Devaluation and Realignment: Exchange rates adjust over time to reflect economic realities.
Introduction of New Monetary Frameworks: Greater reliance on currency baskets or regional monetary arrangements.
Digital Transformation: Widespread adoption of CBDCs and reduced reliance on physical cash.
Debt Restructuring and Inflation Management: Using controlled inflation or policy reforms to manage excessive debt.
In extreme scenarios, resets can involve currency redenomination or replacement, but such outcomes are typically localized rather than truly global.
Implications for Global Trade and Markets
A currency reset would have profound effects on international trade, capital markets, and investment strategies. Exporters and importers would face changing competitiveness due to currency realignments. Financial markets could experience volatility as investors reprice assets and reassess risk.
For emerging markets, a reset could provide relief from dollar-denominated debt pressures, but it could also introduce uncertainty if capital flows become unstable. Developed economies may face challenges in maintaining financial dominance and policy independence.
Impact on Individuals and Businesses
For individuals, the effects of a currency reset are often felt through inflation, changes in purchasing power, interest rates, and asset prices. Savings held in cash may lose value during inflationary resets, while real assets such as equities, real estate, and commodities may act as hedges.
Businesses must adapt to changing exchange rates, supply chain adjustments, and new regulatory frameworks. Companies engaged in international trade or finance are particularly sensitive to currency realignments.
Myths and Misconceptions
The term “global currency reset” is sometimes associated with conspiracy theories promising sudden wealth redistribution or instant revaluation of certain currencies. In reality, monetary resets are complex, policy-driven processes aimed at restoring stability, not creating overnight riches. Understanding the economic fundamentals behind currency changes is essential to separating credible analysis from speculation.
Conclusion
A Global Currency Reset is best understood as an evolving process rather than a single dramatic event. It reflects the continuous adaptation of the global monetary system to economic imbalances, technological change, and geopolitical realities. While the current system faces significant challenges—ranging from debt and inflation to digital disruption—a reset, whether gradual or structural, aims to restore confidence, stability, and efficiency in global finance.
For policymakers, investors, and individuals alike, the key lies in awareness and adaptability. History shows that currencies change, systems evolve, and financial resilience comes not from predicting exact outcomes, but from understanding the forces that drive transformation in the global monetary order.
Unlocking Currency DerivativesStrategies, Instruments, and Risk Management in the Global FX Market
Currency derivatives are powerful financial instruments that allow traders, investors, and corporations to manage foreign exchange (FX) risk, speculate on currency movements, and enhance portfolio efficiency. As global trade, capital flows, and cross-border investments continue to expand, understanding and effectively using currency derivatives has become essential. Unlocking currency derivatives means not only knowing what these instruments are, but also mastering how, why, and when to use them.
Below is a detailed, structured explanation of currency derivatives, their types, uses, strategies, risks, and relevance in modern financial markets.
1. Understanding Currency Derivatives
Currency derivatives are financial contracts whose value is derived from an underlying currency pair (e.g., USD/INR, EUR/USD).
They allow participants to lock in future exchange rates or profit from changes in currency prices.
These instruments are widely used in international trade, investment hedging, and speculative trading.
Currency derivatives trade both on exchanges (standardized contracts) and over-the-counter (OTC) markets (customized contracts).
2. Why Currency Derivatives Matter
Exchange rates are influenced by interest rates, inflation, geopolitics, trade balances, and central bank policies.
Sudden currency fluctuations can significantly impact profits, costs, and asset values.
Currency derivatives help manage uncertainty by transferring risk from those who want to avoid it to those willing to take it.
They provide transparency, liquidity, and price discovery in global FX markets.
3. Major Types of Currency Derivatives
Currency Forwards
Customized OTC contracts to buy or sell a currency at a predetermined rate on a future date.
Widely used by corporates to hedge import/export exposure.
Currency Futures
Exchange-traded, standardized versions of forwards.
Offer transparency, daily mark-to-market settlement, and lower counterparty risk.
Currency Options
Give the buyer the right, but not the obligation, to buy or sell a currency at a specific rate before or on expiry.
Useful for asymmetric risk protection.
Currency Swaps
Agreements to exchange principal and interest payments in different currencies.
Commonly used by banks, governments, and large institutions.
4. Participants in the Currency Derivatives Market
Hedgers
Corporations, exporters, importers, and investors protecting against adverse currency movements.
Speculators
Traders seeking to profit from anticipated currency fluctuations.
Arbitrageurs
Participants exploiting price inefficiencies across markets.
Institutional Players
Banks, hedge funds, asset managers, and central banks providing liquidity and depth.
5. Hedging with Currency Derivatives
Currency derivatives allow businesses to stabilize cash flows and protect profit margins.
Importers hedge against currency appreciation, while exporters hedge against depreciation.
Options provide flexible hedging by allowing participation in favorable moves while limiting downside risk.
Effective hedging improves financial planning, budgeting, and investor confidence.
6. Speculative Trading Strategies
Directional Trading
Taking long or short positions based on macroeconomic or technical analysis.
Carry Trade
Borrowing in a low-interest currency and investing in a high-interest currency.
Volatility Trading
Using options strategies such as straddles and strangles to profit from large price movements.
Range Trading
Benefiting from stable currency movements using option selling strategies.
7. Role of Interest Rates and Central Banks
Interest rate differentials are a major driver of currency prices.
Central bank actions, such as rate hikes, quantitative easing, and forward guidance, directly impact FX markets.
Currency derivatives allow traders to position themselves ahead of policy announcements.
Understanding monetary policy cycles is critical to unlocking consistent returns.
8. Risk Management in Currency Derivatives
Currency derivatives involve leverage, which can magnify gains and losses.
Key risks include market risk, liquidity risk, counterparty risk, and regulatory risk.
Stop-loss strategies, position sizing, and diversification are essential risk controls.
Margin requirements and mark-to-market settlements demand disciplined capital management.
9. Regulatory Framework and Market Integrity
Exchange-traded currency derivatives are regulated to ensure transparency and reduce systemic risk.
OTC markets have evolved with central clearing and reporting requirements.
In countries like India, regulators such as SEBI and RBI oversee currency derivative markets.
Compliance enhances investor protection and market stability.
10. Currency Derivatives in Portfolio Diversification
Currency exposure can be both a risk and an opportunity.
Currency derivatives help investors diversify beyond equities and commodities.
They provide low correlation benefits during global market stress.
Professional portfolios often use currency overlays to optimize returns.
11. Technology and the Evolution of FX Derivatives
Electronic trading platforms have increased accessibility and execution speed.
Algorithmic and high-frequency trading play a growing role in FX derivatives.
Advanced analytics, AI models, and real-time data improve decision-making.
Retail participation has increased due to lower entry barriers.
12. Challenges and Common Mistakes
Overleveraging due to low margin requirements.
Trading without understanding macroeconomic drivers.
Ignoring implied volatility and time decay in options.
Lack of a clear risk management framework.
13. Strategic Mindset for Mastery
Successful currency derivative trading requires patience, discipline, and continuous learning.
Combining macroeconomic insights with technical analysis enhances accuracy.
Keeping a trading journal helps refine strategies.
Long-term consistency matters more than short-term profits.
14. Future Outlook of Currency Derivatives
Globalization and cross-border investments will continue to drive demand.
Emerging market currencies will see increased derivative participation.
Regulatory clarity and technological innovation will expand market depth.
Currency derivatives will remain a cornerstone of global financial risk management.
Conclusion
Unlocking currency derivatives is about transforming complexity into opportunity. These instruments empower market participants to hedge risk, speculate intelligently, and navigate global financial uncertainty with confidence. When used with proper knowledge, discipline, and risk control, currency derivatives become not just tools of protection, but engines of strategic growth in the modern financial ecosystem.

Forex Major Pairs Trading (EUR/USD, USD/JPY, GBP/USD)1. EUR/USD – The Euro vs. the US Dollar
The EUR/USD is the most traded currency pair globally, representing the economies of the Eurozone and the United States. Its daily trading volume is massive, providing excellent liquidity and tight spreads.
Key Characteristics
High liquidity and low transaction cost
Moderate volatility, making it suitable for beginners and professionals
Strongly influenced by monetary policy divergence between the European Central Bank (ECB) and the Federal Reserve (Fed)
Factors Influencing EUR/USD
Interest Rate Decisions
When the Federal Reserve increases interest rates, USD strengthens, causing EUR/USD to fall, and vice versa. The same logic applies to ECB policy moves.
Economic Data Releases
Important indicators include:
US Non-Farm Payrolls (NFP)
Eurozone CPI (Inflation)
US GDP, PMIs, and Retail Sales
These reports can cause sharp intraday movements.
Risk Sentiment
In risk-off scenarios (fear in markets), USD strengthens as a safe-haven asset.
In risk-on environments (market optimism), EUR may strengthen.
Geopolitical events
Political instability in Europe, US policy changes, or global crises can greatly influence the pair.
Trading Strategies for EUR/USD
Trend following using moving averages
Breakout trading during major economic announcements
Range trading during low-volatility sessions (especially Asian session)
EUR/USD typically reacts cleanly to technical levels due to its high liquidity.
2. USD/JPY – The US Dollar vs. the Japanese Yen
The USD/JPY pair is the second most traded major pair. It is known for its sensitivity to interest rates, risk sentiment, and carry trade strategies.
Key Characteristics
Yen is considered a safe-haven currency
USD/JPY reacts strongly to bond market movements, especially US Treasury yields
Volatile during risk events (war, market crash, recession fears)
Factors Influencing USD/JPY
US Treasury Yield Movements
The Japanese Yen is highly sensitive to bond yields.
Rising US yields → USD strengthens → USD/JPY rises
Falling yields → JPY strengthens → USD/JPY falls
Bank of Japan (BOJ) Policies
Historically, the BOJ has maintained ultra-loose monetary policy, causing long-term yen weakness. When BOJ hints at tightening, the pair may fall sharply.
Global Risk Sentiment
In risk-off situations, investors shift to JPY, leading to USD/JPY decline.
In risk-on environments, JPY weakens, and the pair rises.
Government Intervention
Japan sometimes intervenes directly in forex markets when the yen becomes extremely weak or volatile. Such interventions cause sudden, sharp movements.
Trading Strategies for USD/JPY
Yield-driven trading: following bond yield trends
Safe-haven trading: buying JPY during risk-off events
Breakout strategies during Tokyo and London overlap
Carry trade strategy (borrowing yen at low rates to invest in higher-yield currencies)
USD/JPY often moves in clear directional waves, making trend trading effective.
3. GBP/USD – The British Pound vs. the US Dollar (‘Cable’)
Known as Cable, the GBP/USD pair is one of the most volatile major pairs. It represents the economies of the United Kingdom and the United States.
Key Characteristics
Higher volatility compared to EUR/USD
Influenced heavily by UK political events, BOE policy, and economic data
Provides good opportunities for short-term traders due to fast movements
Factors Influencing GBP/USD
Bank of England (BOE) Monetary Policy
Changes in interest rates, forward guidance, and inflation control measures significantly affect GBP.
UK Economic Data
High-impact indicators include:
CPI inflation
Wage growth
GDP data
Manufacturing & Services PMIs
Political Events
GBP/USD is sensitive to political developments such as:
Brexit negotiations
UK general elections
Government budget announcements
Risk Sentiment and Global Flows
During global uncertainty, USD strengthens, causing GBP/USD to fall.
Trading Strategies for GBP/USD
Volatility-based strategies (like Bollinger Bands)
News trading, especially during UK economic releases
Breakout strategies due to frequent sharp movements
Swing trading because the pair forms strong medium-term trends
GBP/USD is ideal for traders who can handle higher volatility and sharp reversals.
General Tips for Trading Major Currency Pairs
Follow Central Banks Closely
Policies from Fed, ECB, BOE, and BOJ shape the market direction.
Use Proper Risk Management
Volatility varies by pair; set stop-loss levels accordingly.
Watch Global Risk Sentiment
Safe-haven currencies like JPY behave differently from risk-on currencies like GBP.
Monitor Economic Calendars
High-impact events such as NFP, CPI, interest rate decisions, and geopolitical news greatly influence major pairs.
Combine Technical and Fundamental Analysis
Major pairs respond strongly to both analysis methods.
Conclusion
Trading major currency pairs like EUR/USD, USD/JPY, and GBP/USD provides opportunities for traders of all levels due to their high liquidity, consistent volatility, and predictable responses to economic data and central bank policies. Each pair has unique characteristics: EUR/USD is stable and technically clean, USD/JPY reacts strongly to yields and risk sentiment, and GBP/USD offers high volatility with rich trading opportunities for experienced traders. Understanding the factors driving these pairs and applying disciplined risk management is essential for long-term success in the forex market.

ESG Investing and Sustainable Finance1. Understanding ESG Investing
ESG stands for Environmental, Social, and Governance — the three key pillars used to evaluate the sustainability and ethical impact of an investment.
Environmental (E):
This pillar examines how a company manages its environmental responsibilities. Factors include carbon emissions, energy efficiency, waste management, pollution control, renewable energy use, and climate change mitigation strategies.
Example: Companies that reduce greenhouse gas emissions or invest in renewable energy are seen as environmentally responsible.
Importance: Investors assess environmental performance to gauge how well a company can manage climate-related risks and comply with emerging environmental regulations.
Social (S):
This component focuses on how a company interacts with people — employees, customers, suppliers, and communities. It includes labor practices, employee welfare, diversity and inclusion, human rights, product safety, and community engagement.
Example: Firms that promote gender equality, maintain fair wages, or engage in ethical supply chains demonstrate strong social values.
Importance: Socially responsible companies tend to attract loyal customers, maintain a motivated workforce, and avoid reputational risks.
Governance (G):
Governance deals with corporate leadership, internal controls, and shareholder rights. It assesses board diversity, executive pay, ethical business conduct, transparency, and anti-corruption policies.
Example: Companies with independent boards, fair executive compensation, and transparent reporting systems score high in governance.
Importance: Good governance reduces the likelihood of fraud, mismanagement, and unethical behavior — ensuring long-term stability.
In ESG investing, these three dimensions help investors identify organizations that are not only financially sound but also sustainable and ethical in their operations.
2. The Rise of ESG Investing
ESG investing has evolved from a niche concept to a global mainstream movement. Several factors have contributed to this shift:
Investor Awareness:
Modern investors, particularly millennials and Gen Z, are increasingly motivated by values. They prefer to invest in companies that align with their ethical and environmental beliefs.
Regulatory Push:
Governments and international bodies are promoting ESG standards. For example, the European Union introduced the Sustainable Finance Disclosure Regulation (SFDR), and India’s Business Responsibility and Sustainability Report (BRSR) mandates ESG disclosures for top-listed companies.
Corporate Accountability:
Global corporations are under growing pressure to adopt ESG frameworks, not only to attract investors but also to secure long-term sustainability and brand credibility.
Risk Management:
ESG factors are now recognized as essential to identifying long-term risks such as environmental disasters, regulatory changes, or social unrest that could affect business performance.
According to data from the Global Sustainable Investment Alliance (GSIA), ESG-related investments surpassed $35 trillion globally by 2023, representing about one-third of all professionally managed assets.
3. The Concept of Sustainable Finance
While ESG investing focuses on evaluating company performance using sustainability metrics, sustainable finance refers to the broader financial system that supports sustainable development.
Sustainable finance integrates environmental, social, and governance considerations into all aspects of financial decision-making — including banking, insurance, and capital markets. It aims to channel capital toward projects and companies that contribute positively to society and the planet.
Key components of sustainable finance include:
Green Finance:
This focuses on funding environmentally friendly projects — such as renewable energy, energy-efficient infrastructure, sustainable agriculture, or water conservation.
Example: Green bonds are debt instruments used to finance environmental projects.
Social Finance:
This supports initiatives that improve social well-being — such as affordable housing, education, healthcare, or employment generation.
Climate Finance:
A subcategory of sustainable finance, it targets investments that mitigate or adapt to climate change. This includes funding clean technologies and climate-resilient infrastructure.
Impact Investing:
This approach seeks measurable positive social and environmental outcomes alongside financial returns. Investors directly fund projects or enterprises that deliver tangible societal benefits.
4. Interconnection Between ESG Investing and Sustainable Finance
ESG investing is a subset of sustainable finance. While ESG focuses on assessing companies through sustainability metrics, sustainable finance provides the financial infrastructure — such as green bonds, sustainability-linked loans, and climate funds — to support those ESG-driven companies and initiatives.
In other words:
ESG provides the criteria for evaluation.
Sustainable finance provides the capital for transformation.
Together, they form a comprehensive ecosystem where financial decisions contribute to a greener, fairer, and more transparent global economy.
5. Benefits of ESG Investing and Sustainable Finance
Long-Term Value Creation:
ESG-aligned companies tend to perform better in the long run due to better risk management, innovation, and adaptability.
Lower Risk Exposure:
Firms adhering to ESG standards are less likely to face regulatory fines, lawsuits, or reputational damage.
Improved Access to Capital:
Sustainable companies attract more investors, as many institutional funds now mandate ESG compliance.
Enhanced Reputation and Brand Loyalty:
Consumers increasingly support ethical and eco-conscious brands, boosting market share.
Positive Societal Impact:
Capital is directed toward solving global issues like climate change, poverty, and inequality, leading to inclusive growth.
6. Challenges in ESG and Sustainable Finance
Despite its growth, ESG investing faces several obstacles:
Lack of Standardization:
Different rating agencies use varying ESG criteria, leading to inconsistent evaluations of the same company.
Greenwashing:
Some companies falsely claim to be sustainable to attract investors — a practice known as “greenwashing.”
Data Limitations:
Reliable and comparable ESG data is scarce, especially in emerging markets.
Short-Term Market Pressures:
Investors often prioritize quarterly profits over long-term sustainability goals.
High Implementation Costs:
Transitioning to sustainable practices can be expensive, particularly for small and medium enterprises (SMEs).
7. Global and Indian Perspective
Globally, regions like Europe and North America lead in ESG adoption, with institutional investors such as BlackRock and Vanguard emphasizing sustainability mandates. The United Nations Principles for Responsible Investment (UN PRI) and the Paris Agreement have further driven ESG integration into the financial system.
In India, ESG and sustainable finance are gaining momentum:
SEBI (Securities and Exchange Board of India) has made ESG reporting mandatory for the top 1,000 listed companies under the BRSR framework.
The Reserve Bank of India (RBI) has initiated policies supporting green and social financing.
Indian banks like SBI and HDFC are issuing green bonds to finance renewable energy and social projects.
This marks a clear shift in India’s investment culture — aligning financial growth with sustainability.
8. The Future of ESG and Sustainable Finance
The future of finance lies in sustainability-driven innovation. Artificial intelligence, big data, and blockchain are being used to enhance ESG data transparency and traceability. Governments are introducing carbon pricing, taxonomy regulations, and sustainability-linked incentives to encourage responsible investing.
As climate risks and social inequalities intensify, ESG and sustainable finance will continue to evolve — not as alternatives but as the new standard of global financial practice.
Conclusion
ESG investing and sustainable finance represent more than just financial trends — they are part of a paradigm shift in how societies view growth and prosperity. They align economic success with social well-being and environmental preservation. By integrating sustainability into financial systems, investors and institutions are not only securing returns but also shaping a resilient, equitable, and sustainable future for generations to come.
In essence, profit and purpose are no longer opposites — they are partners in the global mission toward sustainable development.

Global Finance Control on Central BanksIntroduction
Central banks are the cornerstone of a nation’s monetary and financial stability. They regulate the money supply, manage interest rates, maintain price stability, and act as lenders of last resort during crises. Examples include the Federal Reserve (U.S.), the European Central Bank (ECB), the Bank of Japan (BoJ), and the Reserve Bank of India (RBI). However, in today’s deeply interconnected global economy, the autonomy of central banks is not absolute. They operate within a global financial system heavily influenced by international capital flows, global trade dynamics, foreign exchange markets, and powerful multinational institutions.
The control of global finance over central banks is a topic of major debate among economists and policymakers. While central banks are officially independent, their actions are shaped by the pressures and movements within global markets. Understanding this interplay is critical to analyzing how global economic policies are formed and how nations maintain financial sovereignty.
1. The Role and Functions of Central Banks
Central banks serve several core functions within national economies:
Monetary Policy Implementation – They regulate interest rates and control money supply to achieve economic stability.
Price Stability and Inflation Control – Ensuring that inflation remains within target levels protects the value of money and public confidence.
Financial Stability and Regulation – Central banks oversee financial institutions to prevent systemic crises.
Foreign Exchange Management – They manage exchange rates, foreign reserves, and currency interventions.
Lender of Last Resort – During financial distress, central banks provide emergency liquidity to banks and financial institutions.
Economic Growth Promotion – By influencing credit availability and investment, central banks indirectly promote growth and employment.
In theory, these functions are carried out independently from political or external influences. However, in the era of globalized finance, maintaining such independence has become increasingly difficult.
2. The Global Financial System and Its Influence
The global financial system is a web of interconnected markets and institutions, including international banks, hedge funds, multinational corporations, and supranational organizations such as the International Monetary Fund (IMF) and World Bank. It is characterized by:
Cross-border capital flows
Global investment funds and currency trading
Interconnected banking networks
International debt and credit markets
Global rating agencies and financial intermediaries
These elements create a financial ecosystem in which no central bank can act in isolation. The decisions made by one major central bank—particularly the U.S. Federal Reserve—can ripple across the globe, influencing exchange rates, asset prices, and borrowing costs in multiple countries.
3. The U.S. Federal Reserve’s Global Dominance
The U.S. dollar is the world’s primary reserve currency, accounting for nearly 60% of global reserves and the majority of international trade settlements. As a result, the Federal Reserve (Fed) exerts substantial indirect control over global financial conditions.
When the Fed changes its interest rates or monetary policy stance, the effects are immediate and widespread:
Emerging markets experience capital inflows or outflows based on the attractiveness of U.S. yields.
Currency values fluctuate as investors shift between the dollar and other currencies.
Global borrowing costs rise or fall depending on U.S. Treasury yields.
For example, the 2013 "Taper Tantrum" occurred when the Fed announced it would reduce its quantitative easing program. This led to a massive outflow of capital from emerging markets, causing currency depreciation and market volatility worldwide. Central banks in countries like India, Brazil, and Indonesia were forced to raise interest rates or intervene in currency markets to stabilize their economies.
Thus, while national central banks manage their domestic economies, their room for maneuver is constrained by decisions made in Washington.
4. The Role of the IMF and World Bank
Institutions such as the International Monetary Fund (IMF) and the World Bank play a central role in influencing the monetary policies of developing and emerging nations. While these institutions provide financial assistance and development loans, their programs often come with policy conditionalities.
For instance, countries seeking IMF loans during balance-of-payment crises are required to implement austerity measures, fiscal discipline, and structural reforms, which often restrict the central bank’s ability to conduct independent monetary policy.
Examples include:
The Asian Financial Crisis (1997–1998), where IMF intervention imposed tight monetary and fiscal controls on countries like Thailand, Indonesia, and South Korea.
Latin American debt crises of the 1980s, where IMF programs demanded strict monetary policies and privatization measures.
Such conditions reflect how global financial institutions can indirectly control the policy framework of central banks, particularly in financially vulnerable nations.
5. Global Capital Flows and Market Pressures
Modern financial markets operate on a 24-hour global cycle, with trillions of dollars moving across borders daily. These massive flows of “hot money” can destabilize currencies and bond markets, forcing central banks to adjust their policies even if they conflict with domestic economic needs.
For instance:
A sudden capital outflow can devalue a country’s currency, raise import costs, and fuel inflation.
To counter this, the central bank may need to raise interest rates, which can slow economic growth.
Conversely, large capital inflows can create asset bubbles and inflationary pressures, requiring monetary tightening.
In this sense, global financial markets act as a disciplinary mechanism, rewarding or punishing central banks based on their policies. Nations with high fiscal deficits or loose monetary policies often face downward pressure on their currency or increased borrowing costs in global bond markets.
6. Exchange Rate Systems and Dependence
Exchange rate management is another area where global finance limits central bank independence. Most countries today operate under floating exchange rates, meaning their currency value is determined by market forces. However, even floating currencies are vulnerable to speculative attacks and global shocks.
Countries that peg their currency to the dollar or euro must align their monetary policies with the anchor currency’s central bank, effectively surrendering policy control.
For example, countries in the Eurozone have ceded national control to the European Central Bank (ECB), which sets a unified monetary policy for 20 diverse economies.
Similarly, economies with dollar pegs, like Hong Kong or Saudi Arabia, must follow U.S. interest rate trends to maintain currency stability.
Thus, through exchange rate mechanisms, global finance exerts control over domestic policy decisions.
7. The Power of Global Financial Institutions and Rating Agencies
Global credit rating agencies such as Moody’s, Standard & Poor’s, and Fitch Ratings have significant influence on national monetary conditions. A downgrade in a country’s sovereign rating can lead to higher borrowing costs, reduced investor confidence, and currency depreciation.
Central banks must often take preemptive actions—such as tightening monetary policy or maintaining high reserves—to maintain favorable credit ratings. This dependence on external validation further diminishes true policy autonomy.
Similarly, international investment banks and hedge funds influence global liquidity conditions. Their collective actions can amplify or counteract central bank policies, shaping market expectations and financial stability.
8. The Challenge of Central Bank Independence
Central bank independence is designed to prevent political interference and maintain policy credibility. However, true independence is a relative concept. Central banks must balance domestic economic objectives with global realities, including:
Exchange rate volatility
Global interest rate movements
Commodity price fluctuations
Investor sentiment and risk appetite
For smaller or developing economies, these external pressures can severely constrain policy options. Even advanced economies are not immune—consider the European Central Bank, which must balance the interests of both strong economies like Germany and weaker ones like Greece or Italy.
9. Global Crises and Central Bank Coordination
During periods of global crisis, such as the 2008 Global Financial Crisis or the COVID-19 pandemic, central banks often act in coordination. The Federal Reserve, ECB, Bank of Japan, and others engaged in synchronized interest rate cuts and quantitative easing programs to inject liquidity into global markets.
While such cooperation stabilized financial systems, it also highlighted the growing interdependence of global central banks. The Fed’s swap lines—temporary currency exchanges with other central banks—became essential tools to ensure global dollar liquidity, reinforcing U.S. dominance over international finance.
This global coordination is beneficial during crises but underscores the reality that national policies are now part of a global financial ecosystem dominated by major economies and institutions.
10. The Digital Era and Future of Central Banking
The rise of digital currencies, blockchain technology, and decentralized finance (DeFi) introduces new challenges to central banks’ control. Central Bank Digital Currencies (CBDCs) are being developed to maintain monetary sovereignty in an era of financial globalization.
However, even with digital innovation, global finance remains interconnected. A digital dollar or euro could enhance the global influence of their respective central banks, while smaller nations could find their financial systems further marginalized.
11. Implications for Developing Economies
For developing nations, dependence on foreign investment, external debt, and imported inflation makes them particularly vulnerable to global financial forces. When major central banks tighten policy, capital flows reverse, currencies weaken, and debt servicing costs rise.
This “financial dependency” limits the ability of central banks in emerging markets to pursue independent monetary policy. The solution often lies in:
Strengthening domestic financial markets
Diversifying reserves
Promoting local currency settlements
Building policy credibility and transparency
Such measures can help shield national economies from excessive global influence.
Conclusion
Central banks were originally established to safeguard national monetary stability, but in the 21st century, their independence is constrained by the immense power of global finance. International capital flows, financial institutions, rating agencies, and dominant currencies—especially the U.S. dollar—shape the policy space available to even the most powerful central banks.
Global financial control is not always direct or conspiratorial—it operates through market mechanisms, investor sentiment, and institutional interdependence. The challenge for modern central banks is to balance national economic priorities with global financial realities.
In an increasingly integrated world, complete autonomy is impossible. Yet, by fostering transparency, coordination, and prudent macroeconomic management, central banks can navigate these global pressures effectively. The key lies not in resisting globalization but in managing interdependence wisely, ensuring that the pursuit of global stability does not come at the expense of national sovereignty and economic justice.

GBPJPY – Riding the Bull, Eyeing a FadeThe bulls have had their fun. Structure’s been marching cleanly inside this rising channel since mid-October, and we’re now brushing up against a breaker block from the previous selloff.
Price is trading deep in the premium zone — good spot to start watching for exhaustion, not blindly shorting it. If we get a clean rejection from this breaker or the upper trendline, I’ll scalp a short back toward the midline.
Main bias stays bullish overall, but every trend needs to breathe. I’m just looking to catch that breath before it exhales back up again.
“Not financial advice, just how I see it unfolding. Let’s see if the market agrees.”

AUDCAD potential long setupLooking at AUDCAD this morning and noticed the 3 bounces off the Monthly 50EMA (overlayed on this 4H chart). The pair is stuck in a wide range after a strong September rally linked to the gold (commodities) strength and above forecast AUD economic data. The pair is also sitting at a critical trend line support while RSI is positioned well for a move upward.
Fundamentally, precious metals are erasing Friday's losses while a meeting between President Trump and Australian PM Albanese is set to take place Monday morning to discuss a critical minerals deal (among other topics), which could boost the AUD significantly. In the meantime the Canadian government continues to follow Brussel's lead in economic obliteration and CAD insignificance.
I could be wrong, I'm a nobody.

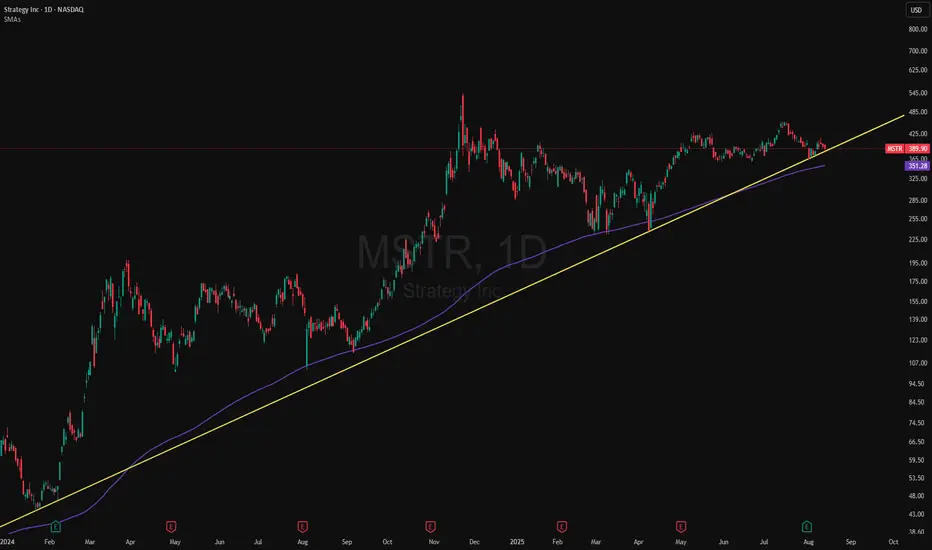
MSTR Holding the Line: Support Tested AgainMSTR (MicroStrategy) continues to respect its ascending trendline, a bullish sign showing buyers remain in control.
Technical Points:
Price tapped the trendline support for the fourth time and bounced, confirming its strength.
Volume remains stable during pullbacks, suggesting these dips are being absorbed by buyers rather than panic selling.
As long as MSTR holds above $1,400 (trendline + previous support zone), the bullish structure remains intact.
Next targets: $1,600, then $1,750, with potential for new highs if Bitcoin strength continues.
Bottom line:
Repeated successful tests of the trendline show strong market confidence. Unless this trendline breaks with conviction, the path of least resistance is still up.
Nat Gas: Heating Up into the WinterBrief Overview on Natural Gas
Natural Gas is a commodity generally traded on the premise of weather forecasts indicating cooler or warmer seasons. This allows traders to speculate on demand for the product as it generally trades higher with cooler temperatures. Today we are looking at the weekly chart.
Thesis: Technical Analysis Pointing to a Bounce
This analysis is mainly focused on the lasting demand zone that Natural Gas time and time again respects and typically bounces from. The weekly chart points to the likelihood that the R/R is favorable for a long position at these levels in the 2.20's. Not only do we see NG tap back into this heavy demand zone, but we also can see a Cup & Handle on the weekly chart signaling potential greater upside.
Demand Zone offers strong R/R as it dips back in to these levels.
Cup & Handle can represent even further upside, but will rely on the initial rebound to prompt the possibility of it playing out.
There is also a trendline (not pictured) that is supporting the current bounce we are seeing today from the 2.18/2.19 level. It is important to note that the commodity has been seeing higher lows since the Spring.
Lastly, a tap of fundamentals play into this idea as well. Though winter demand is always priced in, this year forecasts have repeatedly painted the picture that this winter will be historically mild. Due to these forecasts implying less seasonal demand for Nat Gas, a shift in the shorter-term and more accurate models as we approach the winter season will sharply move the price of Nat Gas and represents that the current price is truly pricing in a very mild winter. This basis supports the idea of great R/R on this LONG trade idea.
Disclosure
I am currently in a long position in Natural Gas after entering on the Friday (10/18) Close
My position includes: AMEX:UNG Credit Spread 13/12P , AMEX:BOIL common shares
If this thesis holds up, I would plan to roll my credit spread contracts into further expirys
Thanks for reading!
Not Financial Advice

2025 DHI Long Term BuyWatching a long-term buy opportunity on NYSE:DHI in 2025
The Jeanius Indicator give me the following buy signals:
Testing an uptrend line from the 3M timeframe
Took out liquidity at an untested low
Structural uptrend
The Jeanie also gives signals on the chart every time this combination happened in the past!

$MRK Long-Term BuyHealthcare could possibly be the next rotation coming out of this tech bull run. Using the Trade Jeanie (Jeanius Screener/Indicator), I was able to see the current technical buy signals happening on NYSE:MRK :
Inside a HTF fair value gap (12M timeframe)
Testing a HTF uptrend line (3M timeframe)
Larkuidity (Liquidity) Sweep
The Jeanius Indicator shows green 'Combo' labels every time this same combination of signals happened
The Jeanius Screener lets me filter my favorite tickers to see which ones are currently sweeping liquidity

Silver price alining bullishly in the key Daily Chart
I think we might get more upside moves in the Gold and Silver price.
I think the daily silver chart is looking for a buy entry today. Long term trend-line is in a bullish alignment and it's coming out of an oversold state offering attractive buy prices to investors.
I EXPECT SOME SELLING to occur for the next little while and perhaps a move down and then a brief consolidation before a move up.

$SPX A bullish or bearish day? SP:SPX Based on the technical factors that emerge, we are right on the first finger to pivot out of the bear trend. We are officially meandering the bullish pull away with strong momentum right? But we've already have that on our side. Does that mean it will diminish? Or will it continue the alarmingly strong moment.
In this video, I will stay away from the SP:SPX , because the momentum will exhaust soon.

Art of Trading - Trendlines 101First of all, I would like express my gratitude to all the followers and the support I have recently received from the community!
This one is for everyone who has recently started with TradingView or are existing users but are very new to the art of trading.
Today we'll be looking at "Trendlines" with a certain example that might leverage the importance of these lines.
Before we get started, I want to mention a couple of qualities that are very essential for trading,
-Patience
-Resilience
lack thereof which, the markets would definitely and repeatedly teach you!
So, what is a trendline? Any two closes connected by a straight line can be called a trendline. Usually used in higher TF's (timeframes)but can also be used on smaller TFs.
What is it's purpose? Once a certain trend has been established in a given TF and such line has been drawn, these can be used to identify supports or resistance where a probable bounce and continuation of the trend could occur.
If the market is trending upwards, a line connecting the lows of two candles, usually the first breakout candle and the lowest pullback candle, can be established as a support trendline (see illustration).
The same applies for a market that is trending downwards which will give us a resistance trendline.
Trendlines in my opinion will always be respected by a market, and also act as, for the lack of a better word, magnets, pulling the asset towards it. So when an asset is hovering around a support trendline, chances are that the asset is pulled towards it. If the trend is strong enough the asset bounces, it not it breaks through. Once broken through support becomes resistance and vice versa.
There will be of course instances when the asset breaks through a trendline but still closes above the trendline, faking participants out of the market, usually referred to as shaking out weak hands. But that's a topic for a different time.
Now that you are aware what Trendlines are, what can you infer from the illustration above? Leave a comment!
If you like this sort of posts, hit boost, so I can prepare more such content. I'm also only human, and still learning, and if you think the information I provide is erroneous, please let me so I can correct and learn together with you! Learning never stops! See you in the next one, peace!
______________________________________________________________________________________
Please use my referral link if you are looking to start a subscription! I would definitely recommend it as it provides the best tools to enable you become the best version of the trader that you deserve to be!
www.tradingview.com
Also if you want me to analyse any asset, feel free to leave it in the comments or dm, I'll make sure to share my opinion on it!

asian paints ready for reversalasian paints at longterm weekly trendline support and horizontal support
cmp 2981 sl 2885 target 3101 and 3224

XAUUSD⚡️FOMC Minutes eyed⚡️❤️MY FOREX TEAM❤️
INFORMATION
Gold price (XAU/USD) holds above $2,000 during the early Asian session on Monday. US economic data suggests inflation is stickier than expected and prompted financial markets to dial back expectations that the Federal Reserve (Fed) would start cutting interest rates in June. At press time, the gold price is trading at $2,014, gaining 0.12% on the day.
💲BUY GOLD 1980-1985 💲
SL @ 1977
TP 1 @ 1990
TP 2 @ 1998
TP 3 @ 2009
💲SELL GOLD 2027-2030 💲
SL @ 2035
TP 1 @ 2020
TP 2 @ 2010
TP 3 @ 2000
Everyone success..👍👍👍
❤️MY FOREX TEAM - Technical Analysis
Technical indicators SMA | EMA | MACD | SAR | VWAP | RSI | MARKET TREND | NEWS
❤️NOTE
XAU/USD holds above $2,000, PBOC rate decision, FOMC Minutes eyed
❤️MONEY CAPITAL MANAGEMENT
⚡️ Only Trade With Risk Capital
⚡️ Cut Losses Short, Let Profits Run On
⚡️ Avoid Using Too Much Leverage
⚡️ Avoid Taking Too Much Heat
⚡️ Do Not Give in to Greed
⚡️ Take profit equal to 4-6% of your capital
⚡️ Stop lose equal to 2-3% of your capital

Bottom fishing in Aavas finance!Aavas finance is a Nifty500 stock which has been taking a support on trendline.
Recently the stock has shown good volume accumulation near the trendline and jumped from the same.
The stock looks good technically as a buy on dip candidate uptil 1450 with a SL of below 1355 DCB.
The targets are 1750,2000++.
Idea is shared for educational purposes and should not be considered as a recommendation.

#AUDJPY potential turnaroundHello dear traders and friends. Let's take a look at the AUDJPY chart and explore the potential bullish move that could happen from around here.
As observed in the 4-hour timeframe chart, the overall direction of the price is bullish , characterized by higher highs (HH) and higher lows (HL). The price respects a bullish trendline acting as support, with clear bullish bounces occurring each time the price reaches or gets close to this line.
Simultaneously, in the 1-hour timeframe chart, the price is forming a double bottom , corresponding with a bullish divergence between price and the momentum (Stoch) oscillator. The crucial aspect of these two confluences is that they are occurring in an important supportive area, namely the static support area and the bullish trendline, which adds to the possibility of the divergence working out.
From a candlestick perspective, we also observe the formation of a bullish engulfing candle in the 1-hour timeframe, which can be interpreted as a morning star if combined with two previous candles.
If you've found this analysis helpful, please take a moment to like, comment, or share your thoughts with me.

AUDJPY Counter Trendline BreakoutWe expect further upside on this pair, signalled by the breakout of the counter trendline. We can also see the breakout, close and retest of price above a key level further supporting our directional basis.

MTL, so hot recently BINANCE:MTLUSDT
I found lots of KOLs shilling this coin on Twitter.
Keep your eyes on it. Main buy zone is around 1.24 - 1.25 , that should be epic.
Enjoy!!
Follow me for more chart analysis.
Patience is the key to success.
DYOR

TMHC A Steady Gainer - worth the time?Stock has been on a steady rise since oct 22. Out of the 7 earnings it only missed one.
This leads me to believe were looking at a run up before their earnings call on July 23rd ( Right before market open ) & If it falls it continuosly bounces off the 100 EMA.
It already showed it has potential to touch 60 on jun 23rd.. Retest prior to earnings?
To be continued..
