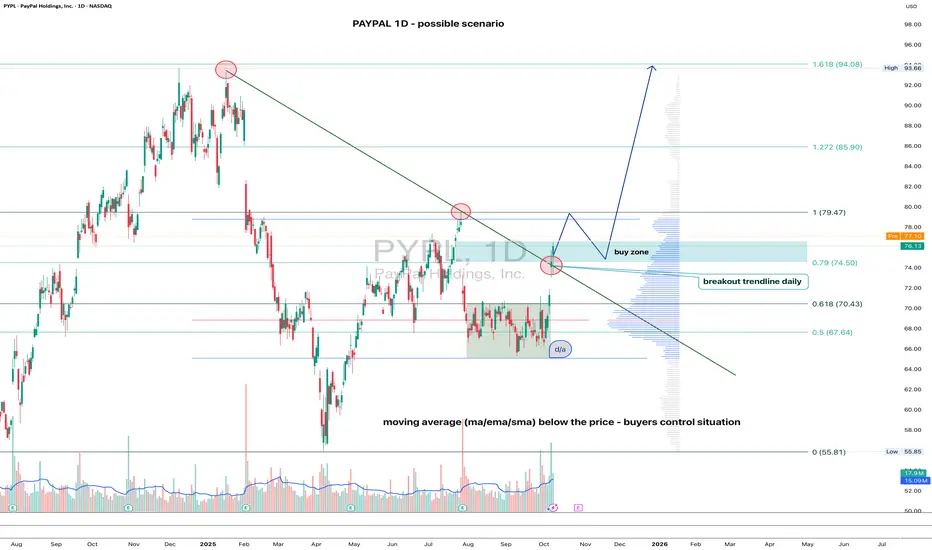
PAYPAL(PYPL) 1D - gaining traction On the daily chart, the price has confidently broken through the descending trendline — the first strong sign of a bullish shift.
All key moving averages (MA, EMA, SMA) sit below the price, showing that buyers are clearly in control.
Buy zone: 74.50.
A retest in this area (74.5–76) looks likely before another push higher.
First resistance: 79.47.
This level might trigger a short-term pullback, but a breakout above it opens the way toward targets at 85.90 and 94.00.
In short - the structure looks healthy, the breakout is done, and PayPal may be just warming up for a bigger move. Stay sharp - dips could be opportunities, not danger.
Trend Line Break
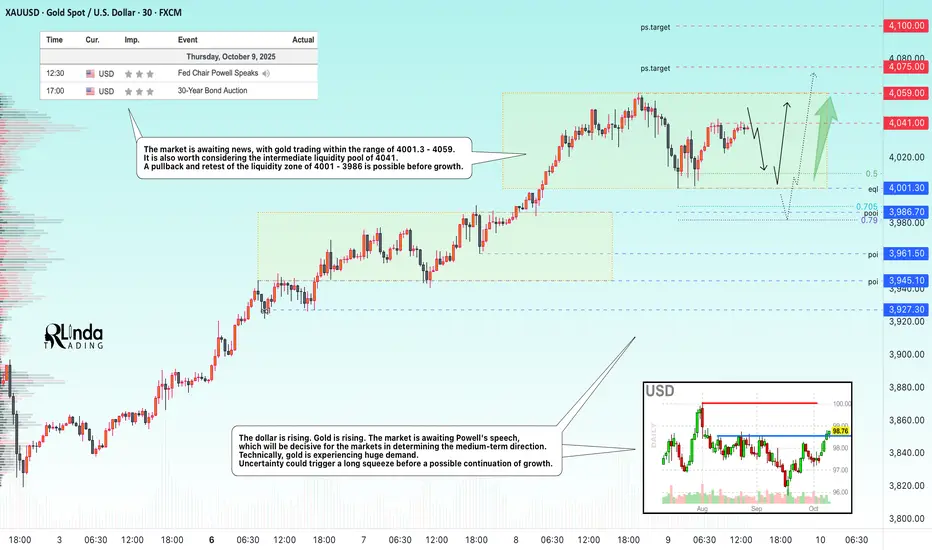
GOLD → The correction will provide a good opportunity for longFX:XAUUSD remains above the psychologically important level of $4,000, having corrected from a record high of $4,059. The market is awaiting Powell's speech, which could set the medium-term tone for the markets...
Key supporting factors: Uncertainty over the shutdown: The phased reopening plan has not yet been approved, which is keeping demand for safe-haven assets high.
Expectations of Fed easing: The probability of a rate cut in October is 100%, and in December is 80%, despite disagreements within the Fed.
As prices rise, the risks of a correction increase, especially against the backdrop of the Fed chair's speech.
Gold remains in a bullish trend. A correction to $4,000 looks like a healthy pause. Further dynamics depend on the Fed's tone and developments with the shutdown — a break below $4,000 is unlikely without new fundamental reasons.
Resistance levels: 4041, 4059, 4100
Support levels: 4001, 3986
Technically, gold has been rising without pullbacks for 35 days. The growth amounted to more than 22%. Accordingly, the market may form corrections, pullbacks, or consolidations within local timeframes. News may provoke such corrective maneuvers before the main movement. I consider the support levels of 4000 - 3986 - 3961 to be areas of interest. A retest or false breakdown could trigger a rebound and growth.
Best regards, R. Linda!
XAUUSD – MID-TERM OUTLOOK ON H1 | STAY CLOSE TO THE MAIN TREND
Hello trader 👋
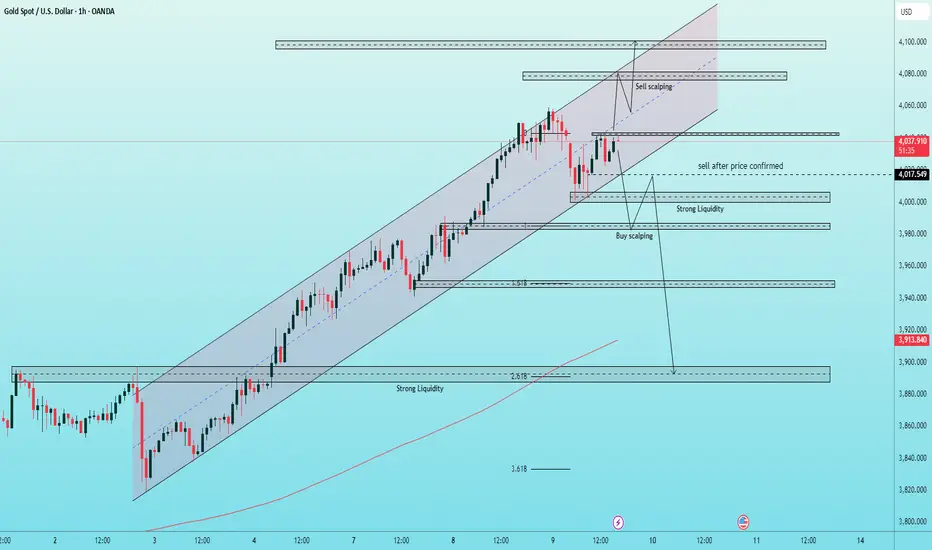
Gold prices are currently holding steady within the rising channel but are approaching a strong resistance zone around 4043 – 4005, a critical boundary to assess whether the uptrend will continue or begin to adjust.
In the current context, the market is showing signs of caution as the USD rises slightly and political - financial news in the US escalates, causing strong investor sentiment fluctuations.
🔎 Technical Analysis
On the H1 frame, prices continue to move within a clear upward channel, but the upward momentum is beginning to weaken.
Fibonacci extension and volume profile indicate a strong liquidity zone concentrated around 4005 – 3980, where buying and selling forces may appear in a tug-of-war.
Important resistance: 4078 – 4080 (Fibo 4.0 and upper edge of the rising channel)
Important support: 3985 – 3980 (liquidity zone + high volume node)
RSI is giving a slight divergence signal, warning of the possibility of a technical adjustment.
⚙️ Detailed Trading Plan
🔴 MAIN SELL:
Entry: 4078 – 4080
Stop Loss: 4085
Take Profit: 4060 → 4053 → 4025 → 4008
👉 Sell reaction at the channel peak resistance zone, coinciding with the high liquidity area.
🔴 SELL on confirmation of breaking 4005:
Entry: 4015 – 4017
Stop Loss: 4023
Take Profit: 4005 → 3988 → 3970 → 3945
👉 Breakout sell order, only activated when the candle confirms closing below 4005.
🟢 SHORT-TERM BUY:
Entry: 4056 – 4058
Stop Loss: 4050
Take Profit: 4068 → 4088 → 4095
👉 Wave surfing buy order at the support zone within the rising channel.
🟢 BUY SCALPING:
Entry: 3982 – 3985
Stop Loss: 3978
Take Profit: based on price reaction / wave confirmation
👉 Quick buy at the strong liquidity zone if a reversal signal appears.
💡 Fundamental View
Latest news: Bensont has completed the first round of interviews for the Fed Chair candidate, with questions revolving around interest rates and QE, indicating that upcoming monetary policy remains the focal point.
The DXY index has surpassed the 99 mark, up 0.16% on the day, exerting certain pressure on gold.
Market sentiment is fluctuating strongly, reflecting concerns about the direction of US monetary policy in the next quarter.
⚖️ Conclusion
Mid-term trend: Upward but weakening
At this stage, it is necessary to closely follow price action at the 4043 – 4005 boundary to determine the next direction.
Prioritize selling at resistance – buying at support, taking advantage of fluctuations within the price channel.
Maintain a flexible trading mindset, manage capital tightly when the market fluctuates due to news.
📈 Quick Summary:
Sell: 4078–4080 / 4015–4017
Buy: 4056–4058 / 3982–3985
Key zone: 4043 – 4005 (confirm new trend)
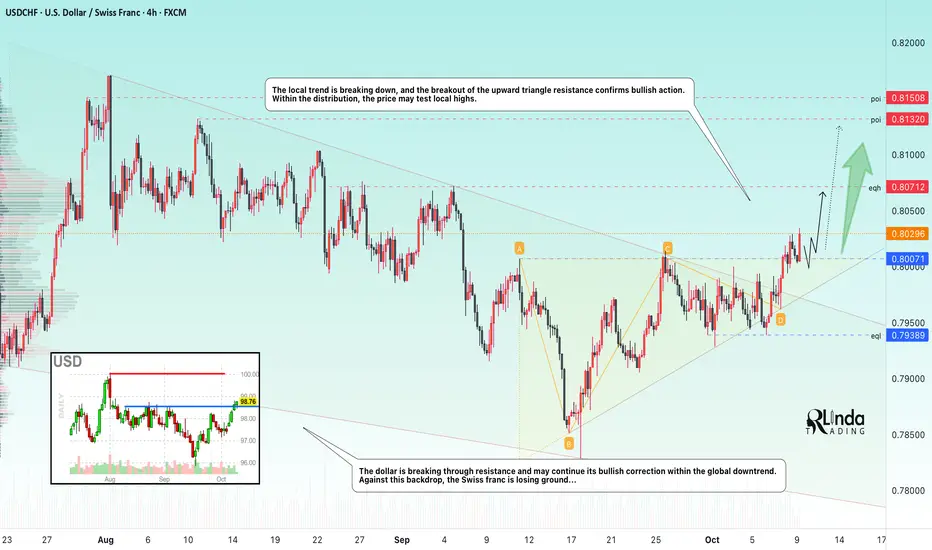
USDCHF → Change in local trend. Confirmation...FX:USDCHF confirms a change in the downtrend and is ready to move into a distribution phase amid growth in the dollar index.
The dollar is breaking through resistance and may continue its bullish correction within the global downtrend. Against this backdrop, the Swiss franc is losing ground...
The currency pair is forming a breakout of the local trend. The breakout of the resistance of the ascending triangle confirms bullish action. As part of the distribution, the price may test local highs.
Resistance levels: 0.8071, 0.8132
Support levels: 0.800
A consolidation of the price above 0.800 may form an intermediate bottom, which will provide support for the bulls before the next run.
Best regards, R. Linda!
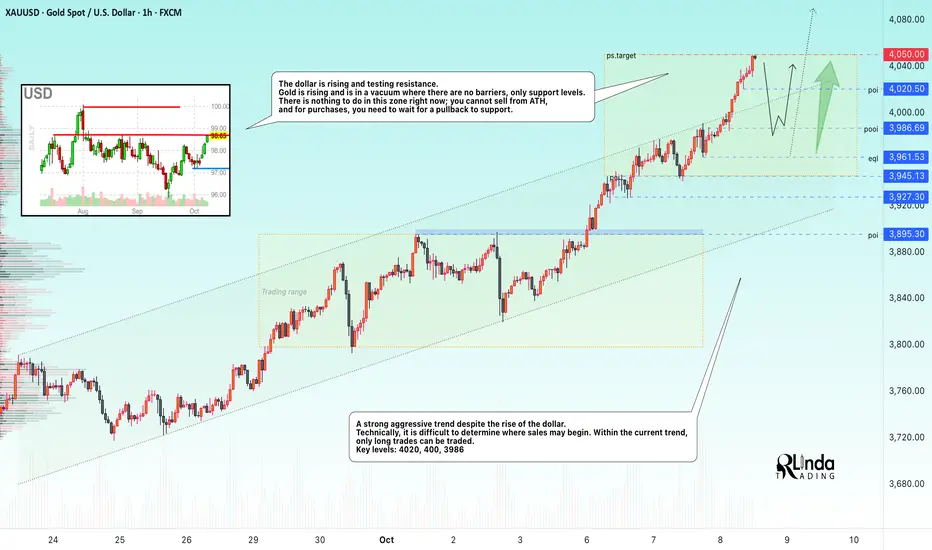
GOLD → Testing 4050 - 4100. Need a pullback to tradeFX:XAUUSD is hitting a new all-time high, testing $4,050, and looks set to reach $4,100. This record growth is linked to falling interest rates and economic risks, which are causing money to flow into hedge assets...
Key drivers: The White House may announce civil service cuts amid the shutdown, which increases uncertainty. The probability of interest rate cuts in October is 95%, supported by the delay in data publication due to the shutdown. Global central banks continue to build up reserves. However, as prices rise, so do the risks of correction. The USD is also receiving support as a safe haven, which may limit further growth in gold.
Resistance levels: 4050, 4075, 4100
Support levels: 4020, 400, 3986
Technically, we need to wait for a slowdown and correction to take a full breath before further movement. I consider the local liquidity zones of 4020 - 4000 - 3986, 3961 to be promising areas of interest. I do not rule out the possibility of sharp shocks in the market, so we need to be prepared...
Best regards, R. Linda!
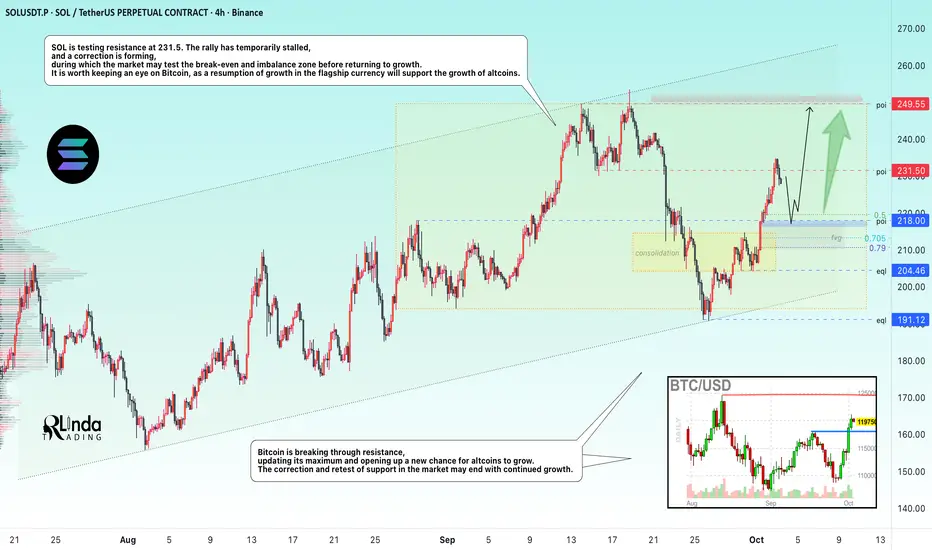
SOLANA → Retracement for consolidation before growth to 250.0BINANCE:SOLUSDT bounces off trend support, forms a reversal pattern, and enters a distribution phase, during which it updates its maximum but encounters strong resistance. What's next?
Bitcoin breaks through resistance, updating its maximum and opening up a new chance for growth for altcoins. Correction and retesting of support in the market may end with continued growth.
SOL is testing resistance at 231.5. The rally has temporarily stalled, and a correction is forming, during which the market may test the break-even and imbalance zone before returning to growth. It is worth keeping an eye on Bitcoin, as a resumption of growth by the flagship will support the growth of altcoins.
Resistance levels: 231.5, 235, 250
Support levels: 218, 205
A false breakout of 231.5 is provoking a pullback. It is necessary to monitor the further halt in price. I expect a retest of 220-218 before the price returns to growth.
Sincerely, R. Linda!
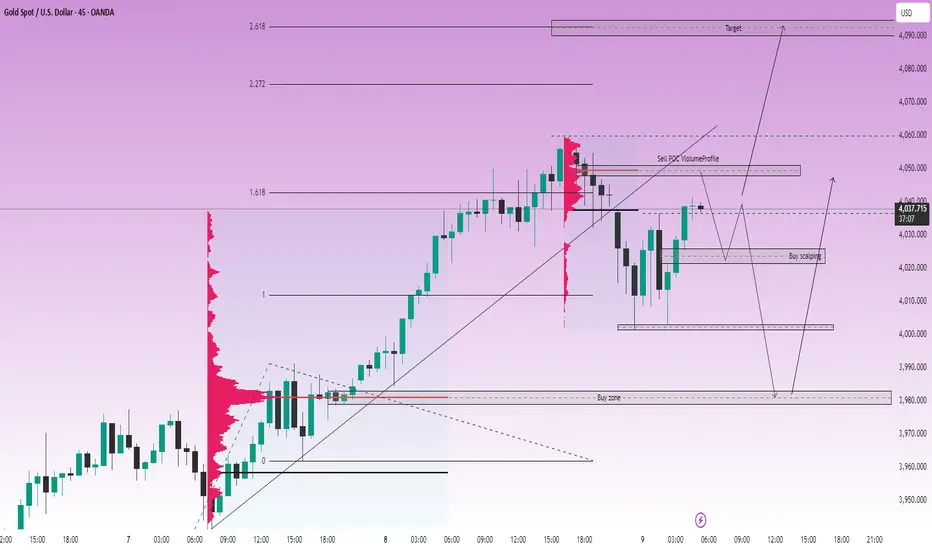
GOLD: The upward structure continues, target 4090 is approachingLiamTrading – GOLD: The upward structure continues, target 4090 is approaching
Hello everyone,
Gold and US stocks are setting new records, but don't forget — strong sell-offs often occur when everyone believes prices can only go up.
Currently, gold maintains a sustainable upward structure, with each subsequent low higher than the previous one, confirming a clear trend on the H1–H4 frames.
📊 Technical Analysis (Chart 45m – XAUUSD)
The price structure remains clearly Higher High – Higher Low, indicating that buyers still control the market.
Key liquidity zones are around:
🔹 4050–4060 (resistance – POC Volume Profile)
🔹 4020–4025 (temporary support zone – confluence Fibo 0.618)
🔹 3980 (technical bottom, strong previous liquidity zone)
The upward target according to Fibonacci Extension is currently in the 4090 zone, corresponding to the 2.618 extension level — likely to become a major profit-taking area for buyers.
🎯 Today's Trading Scenario
Short-term Sell (based on resistance reaction):
📍 4048–4050
🛑 SL: 4055
🎯 TP: 4030 – 4018 – 4005 – 3980
Buy scalping:
📍 4022–4024
🛑 SL: 4017
🎯 TP: 4030 – 4045 – 4060 – 4080
Buy swing (trend-following):
📍 3980–3982
🛑 SL: 3975
🎯 TP: 3995 – 4010 – 4025 – 4040 – 4060
🧭 Fundamental & Market Sentiment
According to the FOMC minutes from 16–17/9, most Fed officials believe that continuing to cut interest rates this year is appropriate.
This is the first time since 2020 that the Fed has officially reduced the interest rate by 0.25%, bringing the range down to 4.75% – 5.00%.
→ Cheap money + safe haven sentiment continues to be the main driver pushing gold higher.
However, with both gold and stocks reaching peaks, the risk of technical correction may occur when prices hit major liquidity zones.
📌 Conclusion
Gold is still in a stable upward trend, with a short-term target towards 4090 USD/oz.
However, watch for liquidity zones around 4050–4060 and 4000–4025 to optimize entry points, avoiding FOMO when prices are already high.
👉 I will continue to update details each trading session.
Follow me to not miss the earliest gold scenarios!
AUD/USD 4HR Trendline Breakout Long Setup. Daily Continuation.I will be entering a long trade at the close of the current daily candle on AUD/USD.
Stoploss and take profit provided. With this one management will be if the market does not trade through the target area by daily candle close on Thursday then I will close the trade manually.
Simple trading execution and plan.

US30: Consecutive breakouts signal an emerging downtrend
SPREADEX:DJI – When price rejects the high, the market begins to shift
On the 30-minute chart, price action is clearly signaling a loss of bullish momentum and a transition toward a bearish structure.
________________________________________
🧠 Price Action Analysis
1. First Failed Breakout
Price initially broke above the ascending trendline that had held since early October — but failed to hold the breakout.
➤ A classic early warning of buyer exhaustion, often seen during distribution phases.
2. Multi-Layered Resistance Zone
The 46,725 – 46,779 region has become a clustered resistance zone, rejecting price repeatedly.
➤ Multiple rejections here suggest dominant selling pressure, with strong supply overhead.
3. Second False Breakout
A more subtle second breakout attempt followed — but again, price was swiftly rejected.
➤ Consecutive failed breakouts typically indicate a lack of conviction and precede sharp reversals.
________________________________________
📉 Trend Structure Has Shifted Bearish
• Lower highs and lower lows now visible
• Price broke below the previous trendline
• Pullback attempts failed to reclaim broken support
• Market is respecting resistance instead of support
➡ These are clear signs of a short-term downtrend emerging.
________________________________________
🔻 Trading Strategy: Favoring Sell Setups in the New Bearish Context
✴️ Scenario 1: Sell at Retest of Proven Resistance Zone
• Optimal Sell Zone: 46,700 – 46,750
• This area has already triggered two failed breakouts — a third touch could be the ideal trap for late buyers
• Watch for bearish rejection candles (pin bars, bearish engulfing, etc.)
Suggested Sell Limit Order:
→ Entry: 46,730
→ Stop Loss: 46,830 (above prior swing high)
→ TP1: 46,500
→ TP2: 46,300
→ Risk-Reward: At least 1:2
_______________________________________
✴️ Scenario 2: Momentum Sell on Breakdown of Local Support
• Trigger Level: 46,580 — if price breaks below with strong momentum (long red candle, increased volume)
• Confirms trend continuation after consolidation
Suggested Sell Breakout Order:
→ Entry: 46,580
→ Stop Loss: 46,680
→ Target: 46,350 – 46,200
→ Tip: Use smaller position size if breakout appears weak to avoid getting trapped in a fakeout
________________________________________
🎯 Trade Management
• Only enter trades with clear price rejection or momentum confirmation
• Move SL to breakeven after TP1 is hit to lock in safety
• Exit the trade if price closes above 46,830 — that would invalidate the bearish thesis
________________________________________
False breakouts leave a trail — for those who know how to read it. It's not a failure. It’s the market whispering that direction has changed.
Please like and comment below to support our traders. Your reactions will motivate us to do more analysis in the future 🙏✨
Harry Andrew @ ZuperView

XAUUSD – PRICE ABOVE $4000: TRULY INSANE FOR TRADERSXAUUSD – PRICE ABOVE $4000: TRULY INSANE FOR TRADERS
Gold has officially surpassed the $4000 mark, marking one of the most robust rallies in recent history.
Let's take a look at key price zones and short-term opportunities 👇
🔻 SELL Scenario
SELL 4025–4027 → SL 4033 → TP 4015 – 4000 – 3980
SELL 4042–4044 → SL 4049 → TP 4030 – 4015 – 4000 – 3980
🟩 BUY Scenario
BUY 3993–3995 → SL 3988 → TP 4005 – 4013 – 4023 – 4040
BUY 3980–3983 → SL 3975 → TP 3998 – 4005 – 4013 – 4023 – 4040
📈 Technical Analysis
The medium-term uptrend channel continues to be maintained steadily.
Rising lows indicate that buying pressure remains very strong.
The nearest psychological resistance is around the 4043 area, coinciding with the Fibonacci extension.
The expected buying zone is at the POC Volume Profile area — a high liquidity zone, previously where many traders expected gold prices to be rejected, but now could become a strong demand area.
🧭 Macro Perspective
If the Federal Reserve (Fed) continues to cut interest rates, the market could aim for the next milestone – 5000 USD/ounce.
Although short-term fluctuations may occur (such as temporary ceasefires in the Middle East or Ukraine), the core drivers of this trend remain unchanged:
US public debt is increasing
Central banks are diversifying foreign exchange reserves
The USD is weakening
All support the medium-term uptrend of gold.
⚡️Summary
Gold remains in a solid bullish structure, even as it approaches overbought territory.
There may be strong corrections, but as long as the uptrend structure is maintained, buyers remain in control.

Trend Line Breakout 4HR. Daily Candle Continuation.Simple breakout pattern on the 4HR timeframe.
For this trade idea I will be holding till the end of new york session trading hours expecting movement to the downside.
Simple Trading Idea.
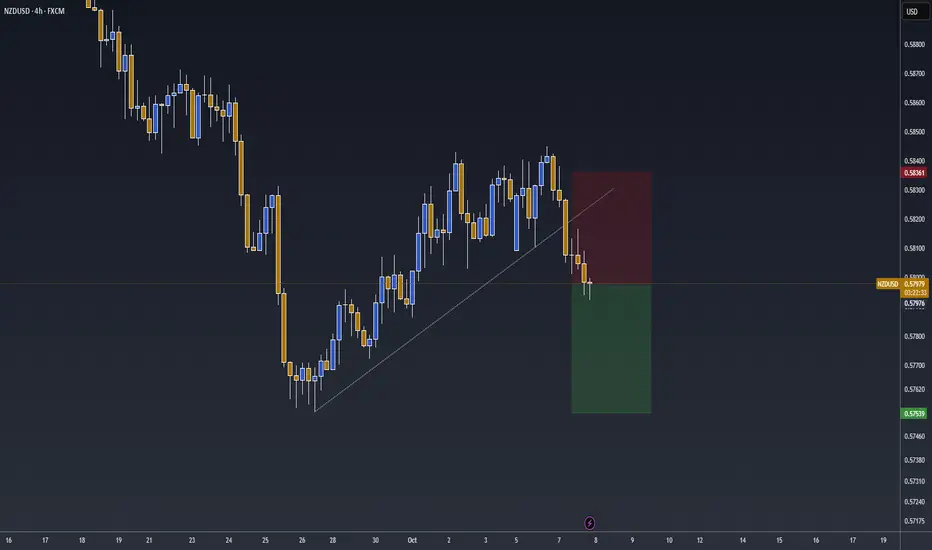
GOLD → The correction will trigger growth to $4,000.FX:XAUUSD hit a new record high of nearly $3,977 and entered a correction phase to build up potential before further growth. Despite the local strengthening of the dollar, the upward trend continues thanks to a combination of macroeconomic and geopolitical factors.
Key supporting factors: Ongoing US government shutdown: The Democrats' fifth unsuccessful attempt to resolve the issue increases uncertainty. Markets expect two interest rate cuts before the end of the year.
China has been increasing its reserves for the 11th consecutive month, and global central banks bought +15 tons in August.
No bearish triggers: Any correction is seen as a buying opportunity.
Gold maintains its upward momentum. Breaking through $4,000 seems a matter of time if current drivers remain in place. Key risks are an unexpected resolution to the shutdown or hawkish signals from the Fed.
Resistance levels: 3977, 4000
Support levels: 3945, 3927, 3920
Technically, a false breakdown of support could lead to continued growth. A retest of 3945 is possible; a weak reaction could trigger a deeper correction, for example to 3927, before further growth.
Sincerely, R. Linda!
XAUUSD – Accumulation before the next moveXAUUSD – ACCUMULATION & AWAITING NEW TREND CONFIRMATION WHEN BREAKING 3956
Hello trader 👋
Gold is oscillating in a short-term accumulation phase, following a strong surge last week. The technical structure on the H1 frame shows the price is retesting the central support area around 3956, which will determine the next direction.
In the current context, price action is mainly restrained within the rising channel, but buying momentum has slowed. The market is waiting for new trend confirmation – either breaking out to the 4000 area or correcting to lower support.
🔎 Technical Perspective
Fibonacci 0.618 – 1.618 indicates a key resistance level at the 3997–4000 area, coinciding with a strong liquidity zone.
The medium-term uptrend line remains intact, however, the RSI momentum shows slight divergence – warning of potential correction.
Key price levels to watch: 3956 – 3946 – 3927 – 3917.
⚖️ Detailed Trading Scenarios
🔴 Main SELL Scenario:
Entry: 3997 – 4000
Stop Loss: 4005
Take Profit: 3976 → 3945 → 3928 → 3910
👉 Sell at the Fibonacci extension area + psychological resistance 4000 (high liquidity zone).
🔴 SELL upon confirmation of breaking 3956:
Entry: 3959 – 3961
SL: 3965
TP: 3945 → 3928 → 3910
👉 Short-term breakout order when the price closes below 3956, confirming the intraday downtrend.
🟢 BUY when price retraces to support:
Entry: 3942 – 3944
SL: 3938
TP: 3955 → 3970 → 3990
👉 Suitable for Buy strategy along the short-term rising channel, prioritized when there is a strong candle reaction.
🟢 BUY at deep support area (POC & Trendline):
Entry: 3900 – 3898
SL: 3892
TP: 3910 → 3928 → 3940 → 3955 → 3970
💡 Macro Perspective
Many major financial institutions have raised their gold price forecast for December 2026 from $4,300 to $4,900/oz, citing that central banks in emerging markets continue to diversify foreign reserves into gold.
This reinforces the belief that the long-term uptrend remains robust.
📌 Summary:
Gold is in an accumulation phase awaiting a new direction around the 3956 area.
Tight capital management – the market may experience strong volatility with the return of political news and US data.
share your thoughts in the comments section, follow me to receive the earliest scenarios

BTCUSD: Sideways market plan🔁 Review of Yesterday’s Plan
Yesterday, we had two breakout trading plans for BITSTAMP:BTCUSD :
IRB (Inside Range Break)
Price moved exactly as projected.
Trade reached a profit of 2R – 2.5R, depending on individual target exits.
RB/ARB (Range Break / Advance Range Break)
Price reached the top boundary of the range and formed a bullish breakout candle,
but was immediately followed by a strong bearish candle pulling back into the range.
This was a clear False Breakout → No trade was taken, waiting instead for the next clear setup.
📈 Market Outlook for Today
BITSTAMP:BTCUSD has now moved back inside the larger range (125,710 – 122,383), showing that the market is currently sideways within a wide range.
The most recent candle closed below the EMA, indicating no clear signal for continuation trades yet.
🧭 Trading Plan for Today
Wait for a new compression setup to form before entering.
If price consolidates and compresses near the upper boundary of the range, prepare to Buy once confirmation appears.
If price continues to drop toward the lower boundary of the range, consider Sell setups, depending on how price reacts to support.
🎯 Summary:
BTC is currently in an accumulation (sideway) phase.
Be patient and wait for a valid breakout setup before taking action — avoid chasing the market and focus on trading only when momentum and confirmation align.
You can refer to my previous analysis here:
Please like and comment below to support our traders. Your reactions motivate us to do more analysis in the future 🙏✨
Daniel Miller @ ZuperView

XAUUSD – WEEKLY SCENARIO -ATH CONTINUES TO HOLD THE CHAIN
Hello trader 👋
Gold prices are currently moving sideways after a strong previous rally. The market is temporarily lacking momentum as the US government remains shut down, causing economic data delays – this reduces liquidity and makes many short-term traders hesitant to open new positions.
Currently, the price structure remains within an upward channel, but there are signs of accumulation and tug-of-war around key resistance – support zones. Therefore, the appropriate strategy during this period is “Buy at support zones, Sell at psychological resistance,” combined with POC (Point of Control) on the Volume Profile to identify the highest liquidity price areas.
⚙️ Technical Structure
The overall trend still leans towards bullish, however, short-term corrective waves may appear as the price approaches strong resistance zones.
Thick volume areas clearly shown on the chart are where large investors are accumulating or distributing orders.
RSI is currently in the neutral zone → no overbought signal yet, so the possibility of range-bound movement remains high.
⚖️ Detailed Trading Scenario
🔴 SELL ZONE (Strong resistance – prioritize reactionary selling)
Entry: 3,970 – 3,972
SL: 3,977
TP: 3,952 → 3,935 → 3,920 → 3,905
👉 Note: This is a psychological resistance zone – confluence between the upper edge of the price channel and the previous volume peak.
🔴 SELL SCALPING (short-term selling when support breaks)
Entry: 3,923 – 3,925 (wait for support break confirmation)
SL: 3,930
TP: 3,910 → 3,900 → 3,885 → 3,860
🟢 BUY ZONE (buy at support + POC volume profile)
Entry: 3,883 – 3,885
SL: 3,875
TP: 3,900 → 3,915 → 3,940 → 3,965 → 4,000
👉 This is a strong technical support zone, coinciding with the POC of the Volume Profile – high liquidity, high rebound potential.
💡 Insights & Notes
The upward price channel remains intact, but buying pressure is gradually weakening, making short-term corrections more likely.
Be patient and wait for direction confirmation before entering trades, avoid FOMO during sideways phases.
News is limited this week due to US political situation → market prone to tug-of-war, low volatility.
📌 Summary:
Buy at liquidity support zones (3,883–3,885).
Sell reactionary at psychological resistance zones (3,970–3,972).
Maintain a flexible mindset within the trading range, wait for clear confirmation signals to increase win rates.
Stay updated with new gold articles by following me

Alibaba Group Holding buying opportunityAlibaba is potentially in the process of making a head and shoulder patten.
Break of neckline should be with heavy volume to be successful.

BTCUSD: Monday analysis and buy plan within rangeLast week, BITSTAMP:BTCUSD had a strong bullish recovery, setting a new all-time high.
At the moment, the trading plan remains bullish (Buy bias), but risk and position sizing should be managed carefully, as the market may experience short-term corrections after such an extended rally.
🧭 BTC Trading Plan
Small Range within a Larger Range
Price is currently moving inside a smaller range within a larger range.
Wait for price to accumulate momentum and form an IRB (Inside Range Break) signal before setting up a potential Buy entry.
Upper Boundary of the Larger Range
Once price breaks the IRB and approaches the upper boundary of the major range, look for price compression near EMA.
Upon confirmation of an RB/ARB (Range Break / Advance Range Break), execute a Buy market order, aiming for a reward ratio of 2R or higher.
If the Market Deviates from Plan
Stay on the sidelines and wait for clearer signals before re-entering the market.
🎯 Summary:
BTC remains in a bullish structure, but selective entries and disciplined risk control are essential.
Wishing everyone a productive and profitable trading week ahead!
You can refer to my previous analysis here:
Please like and comment below to support our traders. Your reactions motivate us to do more analysis in the future 🙏✨
Daniel Miller @ ZuperView

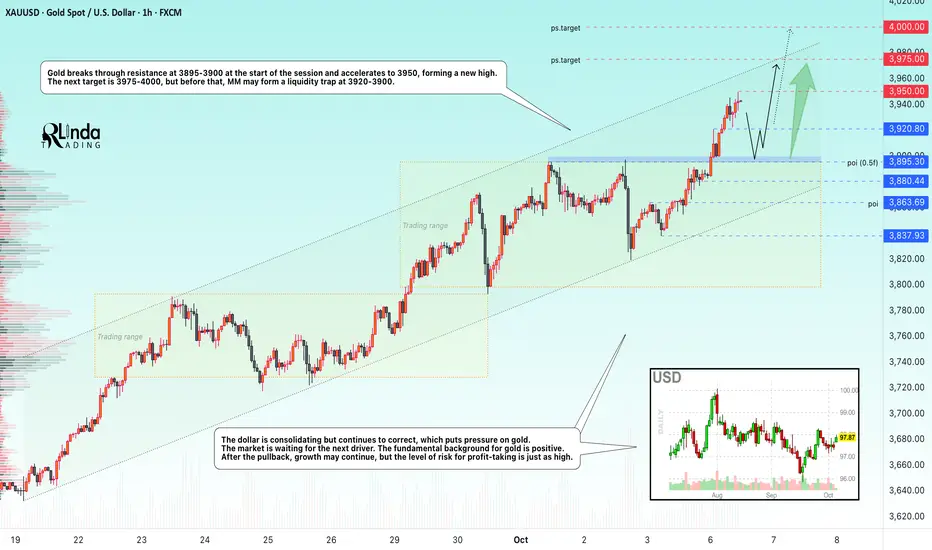
GOLD → Rally to the psychological target of $4,000FX:XAUUSD hit a new all-time high of $3,950 (+1.7% for the day at the time of writing), continuing its move toward the psychological $4,000 mark. The growth continues despite the strengthening of the dollar and the rally in the stock markets.
Key drivers: The ongoing US shutdown (now in its seventh day): The lack of progress in negotiations and the risk of mass layoffs of civil servants are increasing demand for safe havens.
The probability of a rate cut in October is 100%, and in December, 94%. Weak labor market: Trump's statements blaming Democrats for job losses are fueling pessimism.
Fundamentally, gold remains on an upward trend thanks to the perfect combination of US fiscal risks and soft monetary policy. A breakout to $4,000 seems only a matter of time if the shutdown is not resolved.
Resistance levels: 3,950, 3975, 4000
Support levels: 3920, 3900, 3880
Technically, before reaching the 4000 mark, MM may form a liquidation, especially against the backdrop of the FOMC meeting on Wednesday and the Fed on Thursday. Key areas of interest before growth: 3920 and 3900, behind these areas lies a pool of liquidity that will not prevent the accumulation of energy before the next bull run.
Sincerely, R. Linda!
USDJPY → Gap and retest of resistance on a neutral trendThe Japanese yen opens with a gap in the Asia-Pacific session and forms a distribution, within which it tests the resistance zone of 149.93 - 150.79.
The dollar is rebounding again, provoking a corresponding reaction in the markets. However, based on fundamental data, the decline may continue after the pullback.
Gap in USDJPY, distribution and entry into the resistance zone at high speed, there may not be enough potential for continued growth. There is no trend, the price is in a sideways market. A false breakout of 149.93 may trigger a correction towards the lower boundary of the gap.
Resistance levels: 149.93, 150.79
Support levels: 148.76, 148.09
If the currency pair is unable to continue growing, then a false breakout of resistance can be considered. A return of the price to the range on D1 may trigger a decline to support.
Best regards, R. Linda!

The question that came to my mind after examining this chart is:The EURCHF chart is showing a big change that will form a long-term uptrend and I think the price targets on this chart will be met!!
Good luck

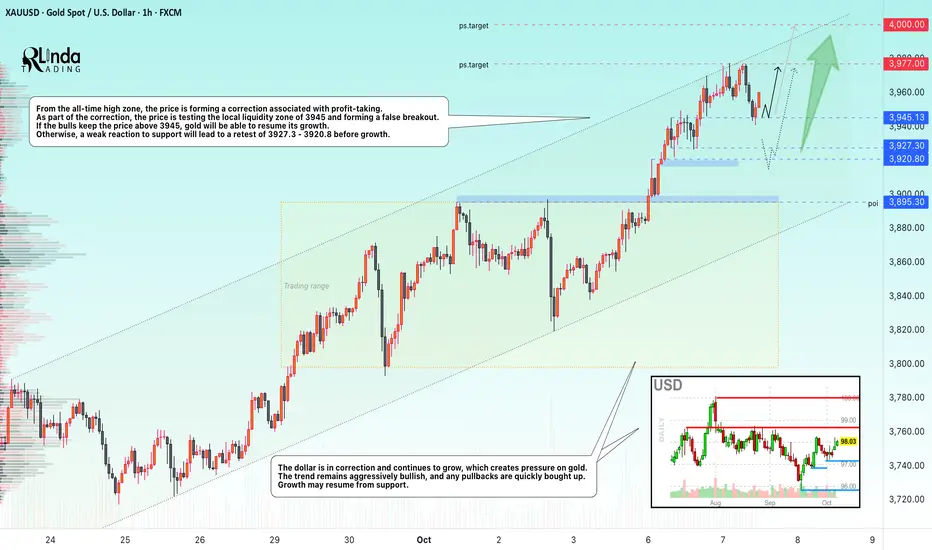
GOLD approaches the $4k mark:The upward wave hasn't stopped yetLiamTrading – GOLD approaches the $4000 mark: The upward wave hasn't stopped yet
Hello everyone,
Gold continues to maintain its impressive upward momentum as the DXY only slightly increases by 0.50% and is currently at 98.21 – a signal indicating that safe-haven flows still prioritize precious metals.
Currently, the technical structure on H1 shows gold is in a clear upward channel, with reaction zones accurately identified through Fibonacci and trendlines, aiming for the next major target of $4000/oz.
📊 Technical Analysis (H1)
Main trend: Strong increase, the Higher High – Higher Low structure remains solid
Main support zone: around 3890 – 3900, coinciding with the confluence of Fibo 1.0 + upward trendline
Psychological resistance zone: 3955 – 3999, corresponding to Fibo expansion 2.0 – 3.6
RSI is entering the 70+ zone, reflecting strong buying pressure but short-term correction signs need to be observed.
🎯 Today's Trading Scenarios
Buy scalping
📍 3909 – 3911
🛑 SL: 3904
🎯 TP: 3940 – 3955 – 3970 – 3990
Buy swing
📍 3888 – 3890
🛑 SL: 3882
🎯 TP: 3910 – 3925 – 3950 – 3975 – 3990
Sell scalping
📍 3956 – 3958
🛑 SL: 3964
🎯 TP: 3935 – 3910 – 3890
Sell swing
📍 3997 – 3999
🛑 SL: 4010
🎯 TP: 3975 – 3950 – 3925
🧭 Trend Analysis
With the current upward force and stable technical structure, the $4000 target is entirely feasible in the short term.
The preferred strategy is to BUY with the trend, waiting for pullbacks to optimize entry, avoiding FOMO at the peak.
Corrections to the support zone 3890–3900 will be a beautiful opportunity to open buy positions.
💡 I will continue to update detailed reaction zones & new plans in each session.
Follow me for the earliest updates on daily gold scenarios!

GOLD DAILY – MACRO PERSPECTIVE FOR LONG-TERM GOLD
Hello everyone 👋
Today is the weekend, let's review gold's movements to gain insights for the upcoming trading week.
The weekly candle closed at 3,886.5 – a high level that most investors did not anticipate. The nearly full bullish daily candle has strongly reinforced the main bullish trend of gold in the medium and long term.
🔎 Technical Perspective
Analyzing through Fibonacci extension, the next target for gold is at 4,000, coinciding with the 1.618 Fibo level and an important psychological resistance zone.
This is a confluence zone between technical and psychological factors, expected to have a strong reaction when the price approaches this area.
The current uptrend is almost unwavering, bolstered by macro factors – U.S. political instability is causing uncertainty for the USD.
💡 Macro Perspective
The U.S. government shutdown is indefinite, economic data is delayed, causing market confusion.
USD weakens, while gold becomes a safe haven.
This context continues to reinforce the long-term uptrend of gold, especially as investors seek value-preserving assets.
⚖️ Long-term Scenarios and Strategies
1️⃣ Long-term Buy Scenario:
Entry: 3,640 – 3,650 zone
Reason: This is a strong support area on the Volume Profile chart, where large liquidity is concentrated.
When the price returns to this area, the pressure of profit-taking and position unwinding from trapped traders will create a strong price rebound effect.
This is the most potential buying zone in the medium term.
2️⃣ Short/Medium-term Reaction Sell Scenario:
Entry: around 4,000
Reason: This is a confluence resistance zone of technical (Fibo 1.618) and psychological (round number) factors.
Prioritize short-term reactionary selling, capturing the pullback if gold hits a peak.
⚠️ Risk Management Notes
Trading on larger time frames requires capital and good management skills, as stop-loss ranges are wider compared to shorter frames.
Do not enter trades too early without confirmation signals from the price zone.
Always clearly define the time frame and profit expectations before entering a trade.
📈 Summary:
The long-term trend of gold remains bullish, with a medium-term target towards $4,000.
Buying around 3,640 is a beautiful price zone to accumulate a long-term position.
Sell reaction around 4,000 if there is a clear reversal signal.
👉 If you want to follow daily updated scenarios, follow me

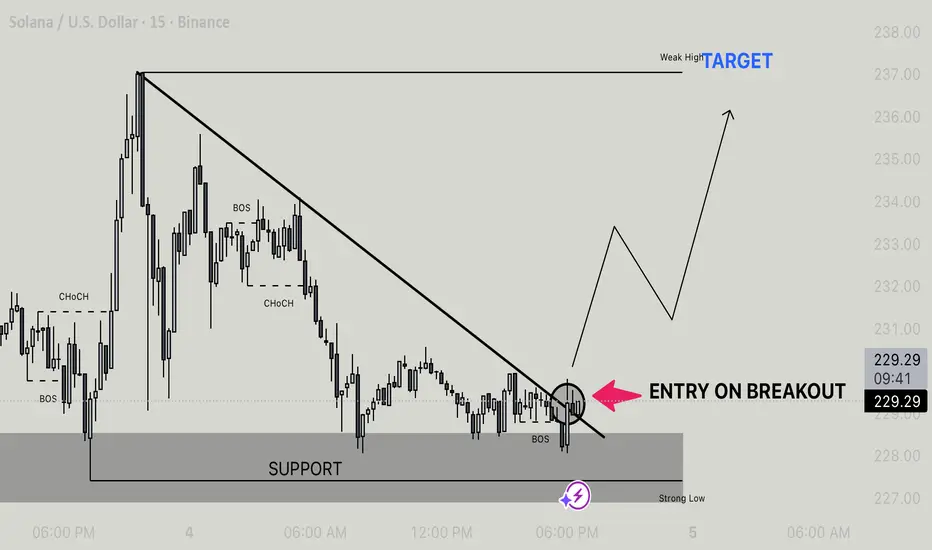
Sol/Usdt - Bullish Breakout Setup From Support Price has been consolidating around the support zone after a strong bearish move. We can observe multiple BOS (Break of Structure) and a clear descending trendline acting as resistance.
• Currently, price is testing the support zone and forming a potential trendline breakout setup.
• Entry confirmation will be on a clean breakout above the descending trendline (marked area).
• Once the breakout occurs, price is expected to retest and then push higher towards the weak high liquidity area, with the next target around 236–238.
Plan:
• Entry: On breakout + retest confirmation.
• Target: 236–238 (weak high).
• Invalidation: A strong break below the support zone would invalidate this bullish setup.