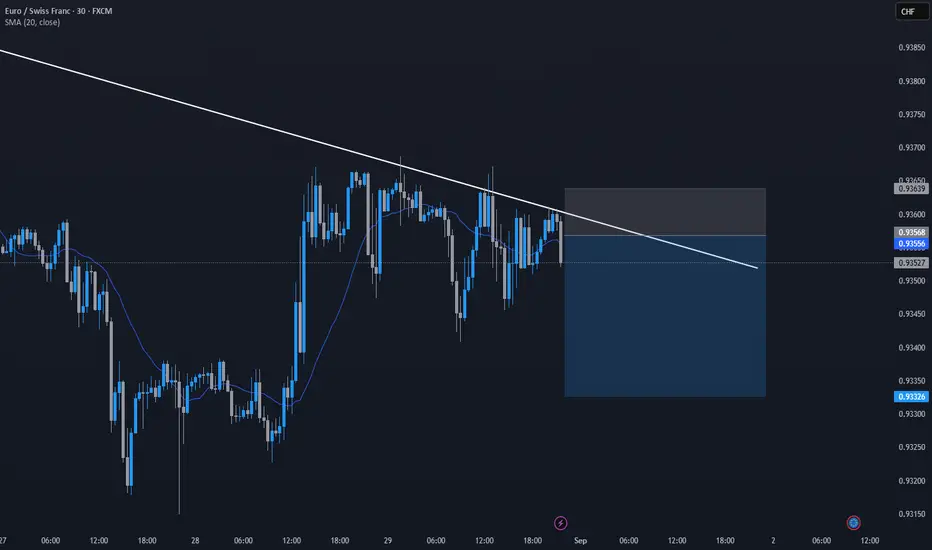
DXY: coiling between trendlines, waiting for the breakThe dollar index has been coiling since late May. Higher lows, lower highs — price is squeezing into a tight range and currently sits near the upper boundary.
Until the range breaks, there's no direction here — just a market getting ready to move.
Two imbalance zones sit below price:
— weekly 100.3–100.7 — the nearer one
— daily 99.8–100.2 — the next one down
These are the downside references if price breaks lower.
If the break comes to the upside, the first target is the 101.9 high area and t
Trendlineset
NZDCHF - Bullish - BUYCALL BULLISH INDICATIONS:
1- Market currently in consolidation phase with in a down channel
2- market has bounced back from good support level
3- if the market break the last LH / neckline, we can enter into the market with
a TP of R:R of 1:1 and the Stoploss slightly below the LL or the Support level.
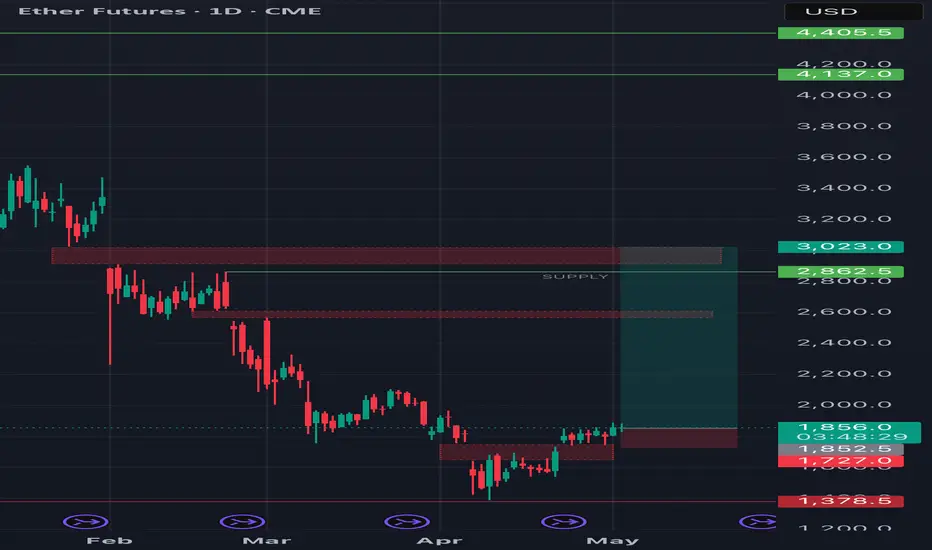
ETH/USDT - Daily Analysis Position: Long | Entry: 1850 | Target:Price has reclaimed the 1800–1850 demand zone with strength after multiple rejections, and is now aiming higher. If the breakout above 1900 sustains, momentum could drive price towards the next key supply zone around 2860–3020, with intermediate resistance near 2600.
I’m currently holding a long from 1850 with a high-leverage setup (50x), targeting 2600.
Risk is elevated due to leverage, but the structure supports bullish continuation as long as we stay above 1800.
A daily close below 1800 woul
ETH Weekly chart - do you get the pattern?Well, my friends,
This is the CRYPTOCAP:ETH with the weekly chart.
Following my other Chart using the #GANN Fan, I now drawed the triangle for you.
Like that you can see how the #ETHERUM behaves and when we will see it imo in a few months.
This is almost the beginning of the #ALTSEASON.
The #ETH still has some work to do.
We need to see a clear break of the last high at 2924$ and then based well above 3000$.
After that, we shall start attacking the 3400$ area and we will have to watch the rete
ELong
How to determine trend line in trading?Determining a trend line in trading is a fundamental skill used to identify the direction and strength of a price trend. Here's a step-by-step guide to drawing and interpreting trend lines:
1. Understand the Basics of a Trend Line
A trend line is a straight line that connects two or more price points on a chart, extending into the future to act as a line of support or resistance.
Uptrend Line: Connects higher lows in an upward trend (acts as support).
Downtrend Line: Connects lower highs in a
Further FIb levels for nifty after budgetResistance sell opportunity 1st level 23673
Resistance sell opportunity 2nd level 24025
Support Buy on dip level 23124
📢 Disclaimer:
This post is for educational purposes only. Investments in the stock market are subject to market risks. Please consult a financial advisor before making any trading decisions.
XAU-USD (Gold)The gold pair moves in a vertical upward price channel and gives respect to their upper and lower trendlines. If the market loses its momentum on the ATH level of gold then it's a chance to move down and some retracement it. There is a big zone on the ATH T.F of gold that is 2400-2430. And if the market respects that zone then we see to reject price to lower trendline at 2380.
User Using different timeframes for analysisDrawing trendlines and channels is a fundamental aspect of technical analysis when trading GBP/USD or any other financial instrument. Here's how traders can effectively draw trendlines and channels on GBP/USD charts:
**Drawing Trendlines:**
1. **Identify Trend Direction:** Before drawing trendlines, determine the direction of the trend on the GBP/USD chart. Trends can be upward (bullish), downward (bearish), or sideways (range-bound).
2. **Connect Swing Lows or Highs:** For an upward trend, d
MACY'S Weekly Technical AnalysisM weekly - No RECOMMENDATION or ADVICE Status / EDUCATIONAL only - Support, Resistance, Trend Lines, Confluence, Cluster, Modified Schiff Pitchfork, Fibonacci Extension - Hope it Helps, Good Luck
DISCLAIMER - This communication is not trading or investment advice, recommendation or solicitation to buy, sell or hold any investment product is provided for informational, educational and research purposes only. All illustrations, forecasts or hypothetical data are for illustrative purposes on
S&P 500 Daily Technical AnalysisSP 500 Daily - No RECOMMENDATION or ADVICE Status / EDUCATIONAL only - Support, Resistance, Trend Lines , Parallel Channel, Cluster, Confluence, Pitchfork, Fibonacci Extension - Hope it Helps, Good Luck
DISCLAIMER - This communication is not trading or investment advice, recommendation or solicitation to buy, sell or hold any investment product is provided for informational, educational and research purposes only. All illustrations, forecasts or hypothetical data are for illustrative purp
S&P 500 Daily Technical AnalysisES (SP 500) Daily - No RECOMMENDATION or ADVICE Status / EDUCATIONAL only - Support, Resistance, Trend Lines , Parallel Channel, Cluster, Confluence, Pitchfork, Fibonacci Retracement / Extension - Hope it Helps, Good Luck
Chart unchanged, just a refresh from July 2023, no update required.
DISCLAIMER - This communication is not trading or investment advice, recommendation or solicitation to buy, sell or hold any investment product is provided for informational, educational and research pu
Bitcoin technical analysis_2023-12-12Short position
After breaking the support formed at the price of 41360
Entry 41100
The loss limit is 42200
Risk Free 40000
The profit limit is 38800
BShort
Houston, We Have a Problem!yes, we have a problem with this trendline...
......................................................................................................................
We are not registered or licensed in any jurisdiction whatsoever to provide investing advice or anything of an advisory or consultancy nature.
and are therefore are unqualified to give investment recommendations.
Always do your own research and consult with a licensed investment professional before investing.
This communication is ne
Crowdstrike Holdings Testing Support, Whats next?Hi guys! This is a Technical Analysis on Crowdstrike Holdings (CRWD) on the 1 Week Timeframe.
Since this is a WEEKLY chart, its important to note that the current candle is not yet confirmed and closes end of trading Friday, 08/11/2023
Lets take our attention to the Orange circle highlighting current price action.
We have reached a critical SUPPORT zone.
A place where 2 SUPPORT levels converge
1. BLUE LINE - the 21 W EMA
2. BLACK SUPPORT TRENDLINE - 6 month support trend line
Currently we h
S&P 500 Daily Technical Analysis (UPDATED)ES (SP 500) Daily - No RECOMMENDATION or ADVICE Status / EDUCATIONAL only - Support, Resistance, Trend Lines , Parallel Channel, Cluster, Confluence, Pitchfork, Gap, Fibonacci Retracement / Extension - Hope it Helps, Good Luck
DISCLAIMER - This communication is not trading or investment advice, recommendation or solicitation to buy, sell or hold any investment product is provided for informational, educational and research purposes only. All illustrations, forecasts or hypothetical data
Big bitcoin resistance So ignoring everything on the chart apart from the thick green with arrows indicating support and resistance touches.
This has been a major resistance line for BTC since January 16th. High volatility whenever we break or get rejected from this line.
Anyone else been watching this one?
GBPAUD I Pull back and strong resistance aheadWelcome back! Let me know your thoughts in the comments!
** GBPAUD Analysis - Listen to video!
We recommend that you keep this pair on your watchlist and enter when the entry criteria of your strategy is met.
Please support this idea with a LIKE and COMMENT if you find it useful and Click "Follow" on our profile if you'd like these trade ideas delivered straight to your email in the future.
Thanks for your continued support!
NAVINFLUOR-WEEKLY SUPPORT-RETESTNSE:NAVINFLUOR
Stock has given breakout from 4450 level on April 1st week.
Currently stock is trying to take support on the same level.
It’s good entry with small SL, Target as per your Risk.
Please note that I’m already long in it from 4485 levels.
This is only for educational purpose, please manage your risk accordingly.
Oracle Rebound & technical analysis According to this chart we are riding the 8 and 20 day. Price bounced off of the 50 after the earnings sell off and broke out from a double bottom.
If this plays out in a perfect world this will blow past 127 from the news run up. Not to mention everything AI is running and we are currently in an AI baby bubble.
I would trade this carefully since it is making new highs and can fall from a sell off and profit taking.
Let’s see how high this goes. Congrats if you were like me and bought arou