How To Catch The Pullback - Part 1Forex ticker: OANDA:EURJPY OANDA:USDJPY OANDA:AUDJPY OANDA:CADJPY
Step 1 — Interpret MACD Colors Only (Bullish Table)
Given:
• 1H: Light Green 🟢
• 4H: Light Green 🟢
• Daily: Dark Green 🟢 + Rising Three Soldiers
From the Bullish MACD Table:
Daily
4H
1H
Interpretation
Probability
🟢 Dark Green
🟢 Light Green
🟢 Light Green
Daily regaining strength, intraday momentum accelerating
🟠 75-85%
MACD-only base probability: 75-85% (High)
Step 2 — Add Candlestick Pattern
Given Pattern:
• Daily: Rising Three Soldiers + Dark Green MACD
From Bullish Candlestick Table:
Daily - Rising Three Soldiers + Dark Green:
Three White Soldiers + 🟢 Daily + 🟢 4H + 🟢 1H → 95% base → 99% final
Since your 4H and 1H are Light Green (not full Dark Green), the probability
adjusts slightly but remains very high due to the strength of the Rising Three Soldiers pattern.
Step 3 — Combine for Final Probability
This is a very strong bullish setup:
Strengths:
• Strong MACD alignment: Daily Dark Green (maximum momentum), 4H & 1H Light Green (bullish momentum building)
• Powerful bullish pattern: Rising Three Soldiers on Daily (strongest pattern in your system)
• Good confluence across all timeframes
• All timeframes aligned bullish
Final Probability:
🔥 90-95% (Very High)
Trade Insight:
This represents a high-probability bullish continuation setup because:
• Daily shows maximum bullish momentum with the strongest pattern (Rising Three Soldiers)
• 4H and 1H confirm with bullish momentum (Light Green)
• Rising Three Soldiers indicates sustained buying pressure across multiple
sessions
• Perfect setup for continued upward movement
Action:
Excellent long entry - strong setup:
• Enter on any pullback toward Daily Rising Three Soldiers support
• Add positions on break above recent highs
• Place stops below the Daily Rising Three Soldiers pattern low
• Expect strong upward continuation
This is a high-confidence bullish trade with the strongest pattern (Rising Three Soldiers) aligned with solid momentum across all timeframes. The Daily pattern
provides exceptional bullish conviction that overrides the slightly weaker momentum on lower timeframes.
Rocket Boost this content to learn more
Warning! : Trading is risky please learn risk management and profit
taking strategies
also use a simulation trading account
before you trade with real money
Triangle
USDJPY at 155: Intervention Threats & A Possible Big DropRecently, the Bank of Japan has been dropping hints that they might be gearing up for intervention on the USDJPY because of the yen’s ongoing weakness. The 155 level keeps coming up, which has a lot of traders on alert. But here’s the thing—while intervention does happen and the BOJ has stepped in before, a lot of this type of talk is what we call jawboning. It’s basically a way to spark a little fear and trigger a market reaction without actually doing anything… yet.
From a technical standpoint though, things are genuinely interesting. USDJPY is sitting inside a descending triangle on the weekly chart, and price is currently reacting off its third consecutive lower high. So if these intervention rumors pick up steam—or if upcoming U.S. data shifts the narrative back toward potential rate cuts instead of the now-expected hold—we could see this pair open up a really clean path to the downside.
If you have any questions, comments, or just want to share you ideas, please do so below.
Akil
NZDUSD Trend Continuation Setup - Targets RevealedHey traders, Akil Stokes here — in today’s video, we’re diving deep into a trading opportunity that we first called out almost a month ago!
In this video I'll show you how I use structure analysis and a combination of Fibonacci retracements, extensions, and equal measured moves (AB=CD Patterns) to pinpoint high-probability zones — turning a 200-pip area into a precise trading target.
👉 Please leave any questions or comments below & I wish you the best in your trading week ahead.
Akil
GBPCAD breakout or rejection? All eyes on 1.8850!GBPCAD is testing a major technical zone as macro and price catalysts align. Here's what traders need to know:
Catalysts & Macro Drivers
GBP : Supported by USD weakness (US shutdown, weak data), sticky UK inflation, and Bank of England caution. November’s UK budget looms as a key event.
CAD : Under pressure from falling oil prices (oversupply/weak demand) and a dovish Bank of Canada. Further rate cuts are possible, especially if oil stays low.
Technical Outlook
Weekly chart : Strong impulsive rally past 61.8% Fibonacci (1.8310), with 1.9490 (78.6% Fib) as the next longer-term upside target.
4h chart : Ascending triangle with resistance at 1.8850. Breakout/close above 1.8850 confirms bullish momentum, with targets at 1.90 and then 1.93–1.95.
RSI : Long-term RSI above 60 signals strength, but divergence is a risk factor. Watch for RSI reset or failure at highs.
Trading Scenarios
Bullish : Hold above 1.8850 for 3 sessions +, look for upside extension to 1.90/1.93/1.95.
Bearish : Failure to break 1.8850 or drop below 1.8600 could trigger reversal to 1.84/1.81 support.
Levels to Watch
Key resistance: 1.8850, 1.9000, 1.9340, 1.9490
Key support: 1.8600, 1.8400, 1.8310
This content is not directed to residents of the EU or UK. Any opinions, news, research, analyses, prices or other information contained on this website is provided as general market commentary and does not constitute investment advice. ThinkMarkets will not accept liability for any loss or damage including, without limitation, to any loss of profit which may arise directly or indirectly from use of or reliance on such information.
Follow-Up on EURNZD Breakout TradeIn our last video, we looked at a consolidation pattern forming on EURNZD and discussed the potential for a breakout. Well, that breakout has now happened — price has pushed above the sideways channel/high-and-tight flag, and we’re currently seeing a pullback into a zone that provides a solid bullish entry reason.
If you’d like to see the full breakdown, including our projected targets for this move, make sure to check out the original video I posted this weekend (linked below).
Please leave any questions or comments below.
Akil
Gold long: Completion of Cycle degree Wave 4Hello, in this video, I go through Gold Elliott Wave structure on a cycle level (again) before zooming in on the latest 5-waves structure that is Cycle level wave 4. I talk about using existing broken trendlines and how that allows me to determine the strength of a move when there are false breakouts, whether to the upside or the downside.
Lastly, I discuss on how to trade this on the short-term using lower timeframe and price action. Most importantly, where to set the stop and the rationale for it.
Good luck!
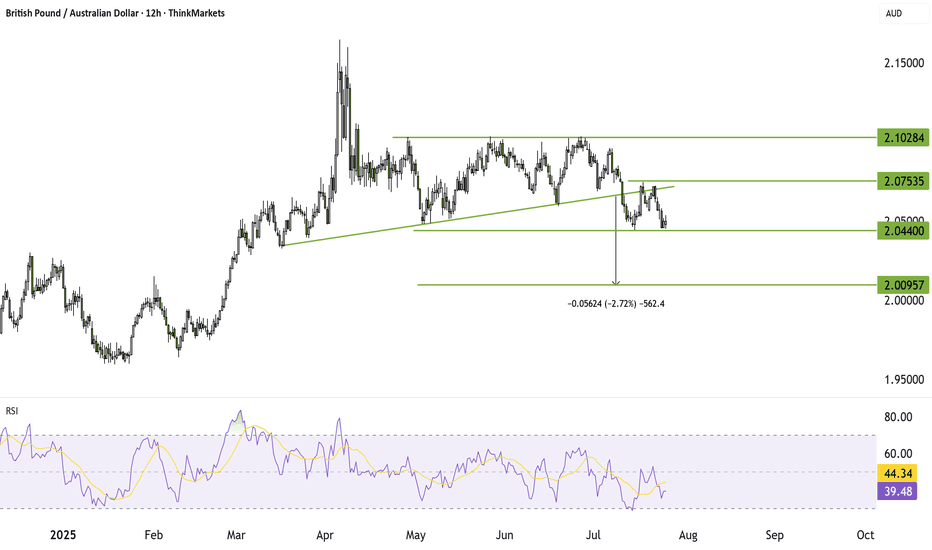
GBPAUD breakdown targets 2.00GBPAUD broke below key triangle support, confirming a bearish pattern with a target near 2.00. A failed retest strengthens the case for further downside. Bounces toward 2.06 may face selling pressure. Reward-to-risk remains attractive around 2.55x.
This content is not directed to residents of the EU or UK. Any opinions, news, research, analyses, prices or other information contained on this website is provided as general market commentary and does not constitute investment advice. ThinkMarkets will not accept liability for any loss or damage including, without limitation, to any loss of profit which may arise directly or indirectly from use of or reliance on such information.
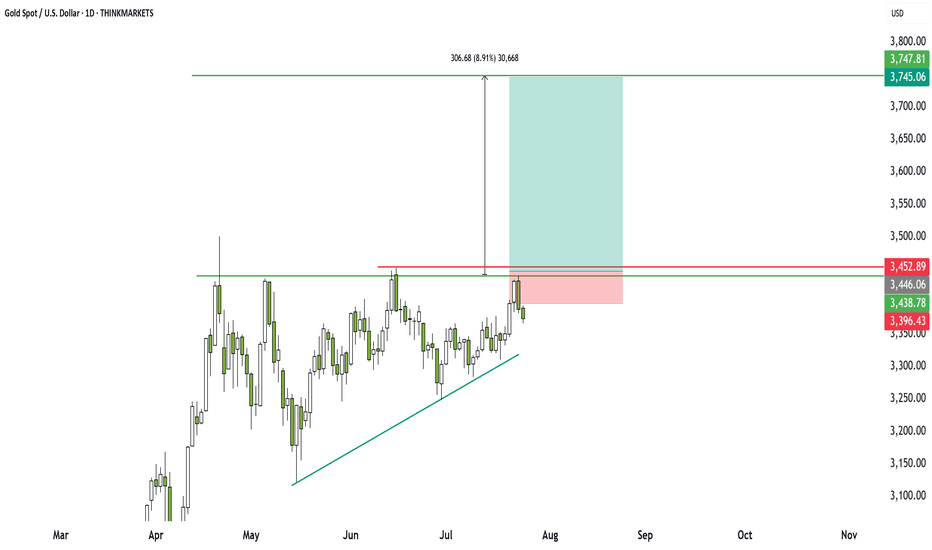
Gold: ascending triangle sets up big opportunityGold has traded sideways for 93 days, but breakout traders should take note. A clear ascending triangle is forming, offering a high reward-to-risk setup. I walk through the key levels, breakout zone, and why this could lead to a 6x return. Bulls may be frustrated, but momentum is building. Are you ready?
This content is not directed to residents of the EU or UK. Any opinions, news, research, analyses, prices or other information contained on this website is provided as general market commentary and does not constitute investment advice. ThinkMarkets will not accept liability for any loss or damage including, without limitation, to any loss of profit which may arise directly or indirectly from use of or reliance on such information.
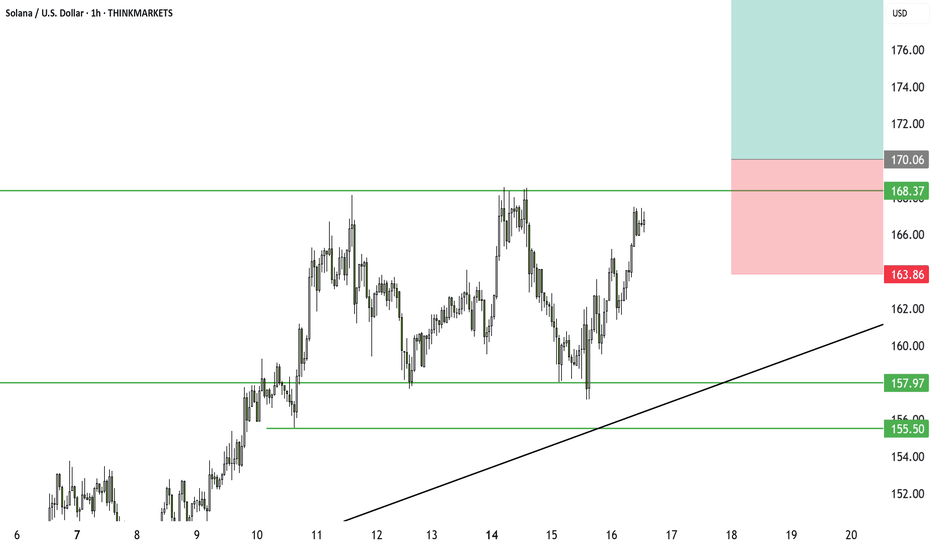
Solana breakout setup: why I am watching this level closelySolana is forming a clear ascending triangle. We already saw one breakout earlier, followed by a few hard retests. Now price has stalled. This might frustrate some, but I see opportunity. A clean break could deliver 14% upside. I also discuss Bitcoin, false moves, and why time stops matter in this environment. Watch closely.
Silver set to break Higher? chart patterns suggest big moveSilver has been stuck in a sideways range for nearly a month, but a breakout may be near. A large ascending triangle hints at a possible move toward 41.37. Depending on how the market reacts, traders could aim for short-term targets with a 2.75 to 5.87 reward ratio or ride it longer for a potential 9.54. Classic markets are messy, so timing matters. Here's how I’d trade it and where I'd place stops. Let me know what you think in the comments.
Gold setup: ascending triangle and Trump’s debt bombGold just formed an ascending triangle, and a breakout could send it $300 higher. In this video, we analyse the new pattern, the key breakout level, and why Trump’s new tax bill and Powell’s potential replacement could spark a major move. Will fundamentals match the technicals? Watch to find out.
Bitcoin setup: bearish for now but watch Trump’s crypto deadlineBitcoin is sliding, and the technicals point lower with clear RSI divergence and a possible descending triangle. But this could all change fast. Trump’s crypto working group is set to propose major changes by 23 July. If the news points to deregulation or a return of ICOs, Bitcoin could explode higher. In this video, we break down the chart, the risks, and the potential trigger that could flip sentiment overnight.
This content is not directed to residents of the EU or UK. Any opinions, news, research, analyses, prices or other information contained on this website is provided as general market commentary and does not constitute investment advice. ThinkMarkets will not accept liability for any loss or damage including, without limitation, to any loss of profit which may arise directly or indirectly from use of or reliance on such information.
Brent crude: why I'm not trading oil right nowBrent crude surged earlier this month on war headlines, and our trade setups nailed the moves. But right now, the market offers no edge. Volatility is fading and price is stuck in a large triangle. Unless you have geopolitical insight, there's no clear reason to trade. In this video, I explain why I'm staying out and what I’ll look for next.
This content is not directed to residents of the EU or UK. Any opinions, news, research, analyses, prices or other information contained on this website is provided as general market commentary and does not constitute investment advice. ThinkMarkets will not accept liability for any loss or damage including, without limitation, to any loss of profit which may arise directly or indirectly from use of or reliance on such information.
BTC levels to watch for a breakoutMarkets are quiet, and Bitcoin is coiling. A potential breakout looms as we await the President’s Working Group crypto update by July 23. Will positive news trigger a rally to $121,000? Watch for key levels and triangle patterns.
This content is not directed to residents of the EU or UK. Any opinions, news, research, analyses, prices or other information contained on this website is provided as general market commentary and does not constitute investment advice. ThinkMarkets will not accept liability for any loss or damage including, without limitation, to any loss of profit which may arise directly or indirectly from use of or reliance on such information.
Solana bag holders could soon be under pressureSOL prices are getting squeezed, and the price appears stuck in a descending triangle pattern, with a 20% downside potential if key levels break. Weighing on prices are the US economic slowdown and the Israel-Iran war. On the flip side, we may soon hear from the US government, with the President’s Working Group on Crypto expected to release their report before 22 July.
What’s your take on SOL? Will bullish or bearish forces prevail?
This content is not directed to residents of the EU or UK. Any opinions, news, research, analyses, prices or other information contained on this website is provided as general market commentary and does not constitute investment advice. ThinkMarkets will not accept liability for any loss or damage including, without limitation, to any loss of profit which may arise directly or indirectly from use of or reliance on such information.
GBPJPY breakout confirmed: what comes next?GBPJPY just triggered an ascending triangle pattern with a 450-pip upside. We dive into the pattern, key levels to watch, and how to manage risk with a 4.8 risk-reward setup. Will it retest before heading higher? Let us know your view in the comments.
This content is not directed to residents of the EU or UK. Any opinions, news, research, analyses, prices or other information contained on this website is provided as general market commentary and does not constitute investment advice. ThinkMarkets will not accept liability for any loss or damage including, without limitation, to any loss of profit which may arise directly or indirectly from use of or reliance on such information.
Gold prices look set to reach a fresh ATHGold prices are up on Israel's attack on Iran, as traders and investors buy to hedge against inflation and the higher geopolitical war. Watch the video to learn what levels traders are watching.
This content is not directed to residents of the EU or UK. Any opinions, news, research, analyses, prices or other information contained on this website is provided as general market commentary and does not constitute investment advice. ThinkMarkets will not accept liability for any loss or damage including, without limitation, to any loss of profit which may arise directly or indirectly from use of or reliance on such information.
GBPUSD looks ready for its next up-legGBPUSD broke above key levels, triggering a double top pattern with targets near 1.4778. In this video, we discuss risk-reward adjustments, why reducing your stop makes sense, and how to deal with sideways markets and small triangle setups. Learn why taking smaller profits can sometimes lead to better long-term results. Leave your thoughts in the comments.
This content is not directed to residents of the EU or UK. Any opinions, news, research, analyses, prices or other information contained on this website is provided as general market commentary and does not constitute investment advice. ThinkMarkets will not accept liability for any loss or damage including, without limitation, to any loss of profit which may arise directly or indirectly from use of or reliance on such information.
Natural gas poised for breakoutNatural gas prices are compressing inside a small ascending triangle, but this is only part of a larger pattern pointing to even greater upside. This video explains why natural gas could be the market to watch in the coming weeks.
This content is not directed to residents of the EU or UK. Any opinions, news, research, analyses, prices or other information contained on this website is provided as general market commentary and does not constitute investment advice. ThinkMarkets will not accept liability for any loss or damage including, without limitation, to any loss of profit which may arise directly or indirectly from use of or reliance on such information.
GBPJPY eyes breakout with 450 pip potentialGBPJPY is testing key resistance at 196.43 in an ascending triangle. A breakout could trigger a 450+ pip move. EURJPY and Dow Jones show similar setups, adding confluence.
This content is not directed to residents of the EU or UK. Any opinions, news, research, analyses, prices or other information contained on this website is provided as general market commentary and does not constitute investment advice. ThinkMarkets will not accept liability for any loss or damage including, without limitation, to any loss of profit which may arise directly or indirectly from use of or reliance on such information.


