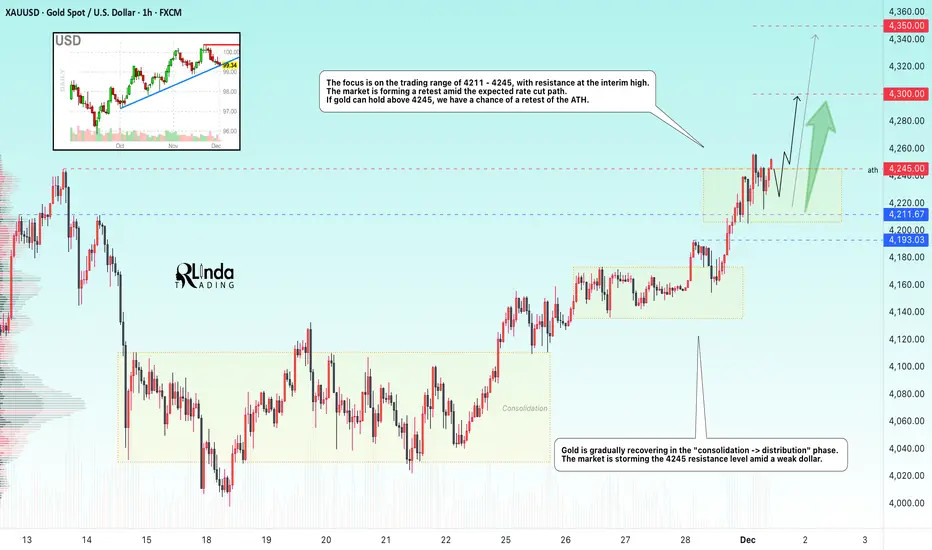
GOLD → The bullish trend continues. Retest of 4250FX:XAUUSD is trading at six-week highs near $4,250, supported by a weaker dollar and expectations of a Fed rate cut. The market is storming key resistance...
The probability of a December rate cut is 87%. The dollar is posting its worst week in four months after failing to consolidate above 100.0. A break in local trend support could trigger a decline in the index, which would support gold.
Today's focus is on the ISM Manufacturing PMI (forecast: 48.6). Weakness in the data could increase pressure on the dollar and support gold.
Gold maintains its upward trend, supported by loose monetary policy. Key data this week could boost momentum ahead of the Fed meeting.
Resistance levels: 4245, 4300
Support levels: 4211, 4193
A retest of 4245 could end with a pullback within the current consolidation at 4211 - 4245. Two scenarios: If the bulls hold the price above 4245, a rally to 4300 is expected. Otherwise, the market could retest 4215 - 4211 with the aim of a long squeeze before rallying. The trend is bullish, and the fundamental background is relatively positive.
Sincerely, R. Linda!
Triangle
GBPUSD → Attempt to change the trendFX:GBPUSD is attempting a trend reversal. The likelihood of an interest rate cut is quite high, which could support the pound's rise.
The dollar is attacking the uptrend support level, failing to consolidate above 100.0. Ahead of the interest rate meeting, another rate cut could weaken the dollar, which in turn would support the pound sterling.
The currency pair is breaking downtrend resistance, and bulls are attempting to hold the price above 1.3191. A prolonged squeeze could shift the imbalance toward buyers, which in turn could trigger a rally.
Support levels: 1.3191, 1.3124
Resistance levels: 1.337, 1.353
The price has entered the trading range of 1.3191 - 1.3370. Consolidation is forming above key support, but the market may test this area of interest before continuing its rise at the European session's opening. A false breakdown and price holding above 1.3191 could support further growth.
Best regards, R. Linda!

SOLANA → Countertrend correction. Bear market BINANCE:SOLUSDT.P is forming a correction after retesting the intermediate bottom of 120.0. Ahead lies a fairly strong and important zone of interest, to which the market may react...
The market structure is bearish. After updating the low within the bearish trend, a countertrend correction to the liquidity zone is forming. A retest of resistance at 143-145 may end in a false breakout and a fall.
Bitcoin is also stagnating. There is no strong support from the fundamental side, and the market is also far from technical support. There is still potential for a fall...
Resistance levels: 143.35, 145.67, 150.8
Support levels: 133.12, 128.3
The coin is within the trading range of 120.0 - 144.0. Accordingly, after a retest of support, a retest of resistance is forming, but pressure on the market is being exerted by a weak fundamental background and a downward trend. A false breakout of this zone of interest could trigger a sell-off...
Best regards, R. Linda!

BITCOIN → Retest of the 94,000 zone of interest...BINANCE:BTCUSDT.P is rebounding from its interim low of 80,000. However, it is still too early to talk about a bull market, as a countertrend correction is forming under the current circumstances.
Globally, Bitcoin is in a downtrend, with the zone of interest for a countertrend correction being 94,000-95,000. The market structure is bearish, and a retest of the break-even zone could trigger a downward movement within the trend.
After a strong liquidation to 80K, the market is forming a pullback, which is a basic phenomenon. There is no confirmation of a trend reversal yet, and the fundamental background is neutral, without clear support. Various analytical services suggest that the market is in a cleansing phase and has so far only liquidated short-term traders, reaching a cumulative average break-even price. A classic pullback. Technically, the zone of interest or magnet for the medium-term market is 75K (on the daily timeframe).
Resistance levels: 93,000, 94,000, 97,300
Support levels: 89,000, 86,000
In the current situation: a bearish trend, weak purchasing power, and a weak fundamental background, I consider a pullback to be the primary reaction to the 93-94K zone. However, the market is not constant, and if support appears (news or other drivers) and Bitcoin manages to stay above 95K, then growth can be expected.
Sincerely, R. Linda!

USDCAD - A Somewhat Confusing Homerun Trading SetupsTop Trading Idea of the Week #2 is on USDCAD, and it’s a two-part bullish opportunity. It begins with a potential bullish Gartley pattern currently setting up—already a strong technical signal. But what makes this idea particularly compelling is the broader market context. On the higher timeframe, USDCAD has been stuck in a massive consolidation since 2015, and while it isn’t technically forming an ascending triangle, the path of least resistance still appears to be to the upside.
Because of that, this may be a rare chance to aim for extended—or “home run”—targets. However, whenever I look to stretch targets, I always want to be aligned with the fundamentals as well. So in the video, we’ll walk through both the technical setup and the additional fundamental research required to build a confident, well-rounded bullish thesis.
If you have an fundamental insights that you'd like to share I'd love to hear about it below. And as always please leave any questions, comments or ideas there as well.
Akil

XAUUSD: Channel Push Points to $4,220 as Next TargetHello everyone, here is my breakdown of the current Gold setup.
Market Analysis
Gold remains in a broader bullish structure, but the recent price action is developing inside a well-defined ascending channel, where price is currently moving from the lower boundary toward the upper one. After a sharp correction, XAUUSD found strong support at the $4,040 level, which aligns with the bottom of the channel and produced a fake breakout, signaling lack of bearish continuation.
Currently, price has started a new upward swing, respecting both the channel structure and the mid-line trend dynamics. However, despite the recovery, XAUUSD is still trading below the major $4,220 resistance, which previously acted as a strong reaction zone and remains the key obstacle for buyers.
My Scenario & Strategy
My scenario is bullish, as long as price stays above the support zone around $4,040 and maintains structure inside the ascending channel. I expect Gold to continue climbing toward the $4,220 resistance, where the upper channel boundary also converges, forming a strong confluence area.
Therefore, a clean breakout above $4,220 would open the way for higher targets and continuation of the broader trend. However, if price reaches this zone and shows strong rejection or weakness, we may see a pullback into the channel — but the bullish structure remains intact as long as the lower boundary holds. For now, the market supports a long bias, with the key objective being a retest of the $4,220 resistance zone, which is the next major level buyers are aiming for.
That's the setup I'm tracking. Thank you for your attention, and always manage your risk.

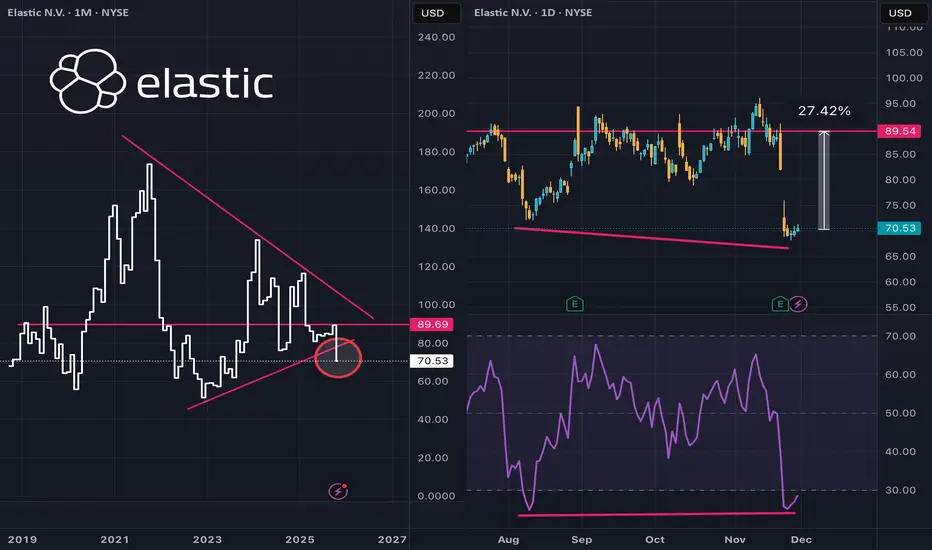
$ESTC creeping towards buy territoryEven after a couple earnings beats in a row NYSE:ESTC has slipped below the bottom edge of a large symmetrical triangle.
Drilling into a daily chart and squinting a bit, there's a mild bullish momentum divergence. Hard to say if the bottom is in just yet, but it does look like one to put on the watch list.
When NYSE:ESTC swings into an uptrend, which could be just months away, the upside potential could be substantial.
Silver Wave Analysis – 28 November 2025
- Silver broke key resistance level 54.00
- Likely to rise to resistance level 58.00
Silver recently broke the resistance zone between the key resistance level 54.00 (which stopped the previous sharp impulse wave (5) in October) and the resistance trendline of the ascending triangle from October.
The breakout of this resistance zone accelerated the active intermediate impulse wave (3).
Given the clear daily uptrend, Silver can be expected to rise to the next resistance level 58.00, target price for the completion of the active impulse wave (3).

BTC : Short Trade setup from Ascending ChannelBitcoin is trading inside an ascending channel and has just tapped into a supply zone, making this a clean scenario for a short‑term counter‑trend short back toward prior support. The idea is to fade the move inside the supply, then ride price down to the support level where buyers previously stepped in.
Price has been respecting an ascending channel. Current location is at the upper band plus an overlapping supply zone, which often acts as a magnet for profit‑taking and short entries.
After a strong impulsive leg up, price is overextended into supply on the 15m chart, with RSI elevated and showing potential for momentum fade rather than fresh trend acceleration.
Take Profit:
TP1: Mid‑channel near 90,000–90,200 to secure partial profits.
TP2: Support zone around 89,200–89,300, where the last strong breakout originated.
Stop Loss: Conservative: Just above the supply zone and recent high, around 92,300–92,500.

Gold Buyers Regain Momentum — Aiming for 4,240 RetestHello traders! Let’s break down the current XAUUSD structure. Gold is trading within a broad ascending structure after forming a strong local bottom around the Support Line, where buyers entered the market and started to push the price higher. This upward movement follows a long corrective phase, during which the price respected the diagonal Support Line multiple times — confirming the presence of a stable bullish trend. Earlier, XAUUSD broke out of the Buyer Zone (4,110–4,120), retested it, and successfully held above it. This zone now acts as a key demand area and the primary level where buyers continue defending the trend. A previous bearish attempt failed here, forming a fake breakout and leading to a new bullish impulse. The price is now approaching the descending Resistance Line, which has repeatedly pushed gold lower during the recent correction. A clean breakout above this trendline may open the way for the price to move toward the major Resistance Level at 4,240.00, which also aligns with the first take-profit area (TP1). This Resistance Level has acted as a strong reaction zone multiple times, causing sharp pullbacks and marking the boundaries of the Seller Zone. Buyers will likely face significant opposition here once again. If gold respects the Buyer Zone and maintains trading above 4,110, the bullish scenario remains intact, and the price may push toward TP1 → 4,240. A confirmed breakout above this level would signal continuation toward higher targets within the broader bullish structure. However, if XAUUSD fails to hold the Buyer Zone and breaks below 4,110, the bullish outlook becomes invalid. In this case, the price may revisit the lower trendline or enter a deeper correction toward previous support areas. For now, the structure remains moderately bullish, with buyers dominating as long as the price stays above demand and respects the ascending Support Line. Please share this idea with your friends and click "Boost" 🚀

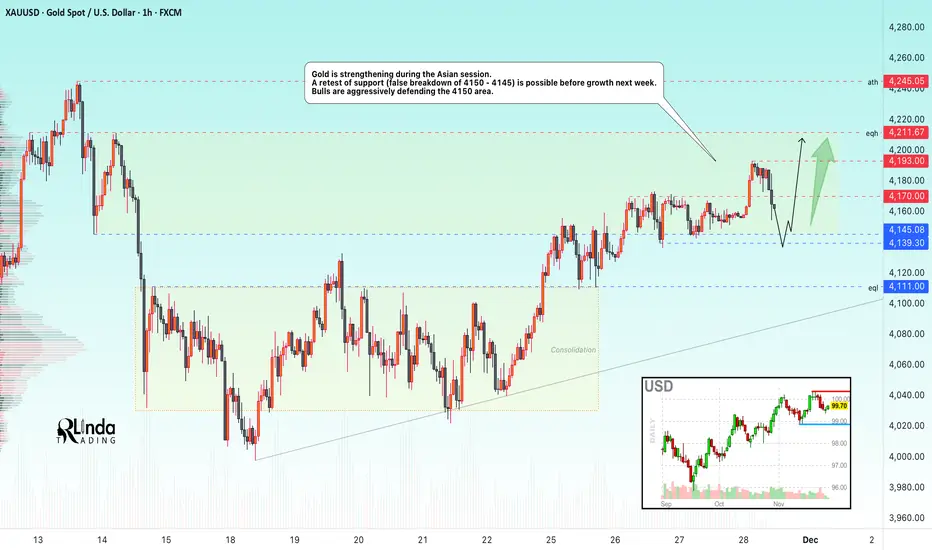
GOLD → Consolidation above 4150 amid a bullish market FX:XAUUSD breaks through 4170 and renews its high to 4193 during the Asian trading session. But further on, the market may consolidate before a possible continuation of growth...
The probability of a Fed rate cut in December remains at 82%. Geopolitical risks (Russia-Ukraine) continue to support demand for safe-haven assets. Weekly growth continues, but consolidation above $4170-4190 is required for the movement to continue.
However, low liquidity is expected on Thursday/Friday due to the holidays in the US. There may not be any strong movement, but volatility could be high during the European/American session...
Focus on the current trading range of 4150-4193...
Resistance levels: 4170, 4193, 4211
Support levels: 4150, 4145, 4139
The market is bullish both globally and locally. Accordingly, within the current trading range, gold may form a long squeeze relative to support and the liquidity zone at 4150. If the fundamental background does not change over the weekend, growth may continue next week...
Best regards, R. Linda!
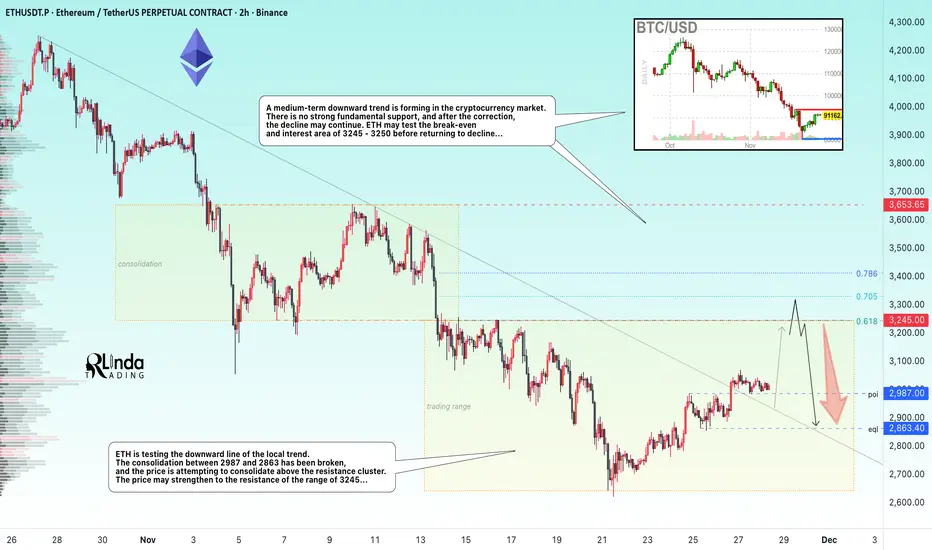
ETHEREUM → Countertrend correction. The hunt for liquidity BINANCE:ETHUSDT is testing the downward trend line and attempting to break through the resistance conglomerate. Overall, against the backdrop of low liquidity, the market has the opportunity to test 3245...
Against the backdrop of low liquidity and without the presence of the American side in trading, ETH is testing the downward line of the local trend. A medium-term downtrend is forming in the cryptocurrency market. There is no strong fundamental support, and after the correction, the decline may continue. Any attempts at growth at this point can be seen as an opportunity to sell profitably...
A breakout is forming and an attempt is being made to keep the price in the long zone. If the bulls keep the price above 2897 after retesting support, the price is likely to strengthen to the resistance range of 3245... However, a false breakout (liquidity capture) of key resistance may remind the market of the relevance of the downward trend...
Resistance levels: 3000, 3245
Support levels: 2987, 2863
I expect two movements. If the price stays above 2987 (after retesting), then Ethereum will be able to retest the resistance of the range. A false breakout of the resistance range could trigger a price decline within the global downtrend that has been developing for 3 months...
Best regards, R. Linda!
GOLD → Consolidation above the support level of the new rangeFX:XAUUSD is consolidating above 4150 but within the distribution phase after breaking through consolidation. The upward price movement is supported by the weakening of the dollar...
The metal remains on track for a fourth month of growth thanks to expectations of further Fed rate cuts and geopolitical tensions.
Despite strong US data, markets are still pricing in a 76-85% probability of a rate cut in December. The dollar is weakening, although yields are rising slightly.
Against the backdrop of the holiday week in the US, volatility may decrease and gold may consolidate. Talks about a possible peace between Russia and Ukraine could reduce demand for safe-haven assets, but the overall backdrop remains favorable for XAU/USD growth.
Resistance levels: 4170, 4211
Support levels: 4146, 4139
Gold is consolidating above the key support zone of 4140-4146. A long squeeze could trigger a shift in market imbalance in favor of buyers. If the bulls keep the price above 4150, this could trigger further growth, a breakout of 4170, and a retest of 4211.
Best regards, R. Linda!

EURUSD → Formation of an intermediate bottom...FX:EURUSD is forming a consolidation, which hints at a halt in the downward correction. The market is waiting for news that could trigger strong movements...
The dollar is pausing and moving into consolidation. If the index enters a correction phase, the euro will go up. A breakout of 1.155 could confirm a change in the local trend and trigger a rally.
The price is trading within a downward price channel; locally, the market is not ready to update the low and is consolidating above 1.150 and 0.7f. Accordingly, the focus is on the current consolidation: 1.150 - 1.155
Resistance levels: 1.155, 1.1606
Support levels: 1.1524, 1.1502, 1.1473
The price is currently consolidating, which means that the market is preparing for possible movements. A breakout of one or another boundary could trigger a rally. A breakout of resistance will confirm a change in the local trend. However, a breakout of support could trigger a continued decline to 1.1473.
Best regards, R. Linda!

AUDUSD Short Pure technical observation 📉
Continuation of the bear trend on 4h?
Will AUDUSD continue ranging on Daily timeframe, or will it breakout of this triangle into a downtrend? Let's see 👀

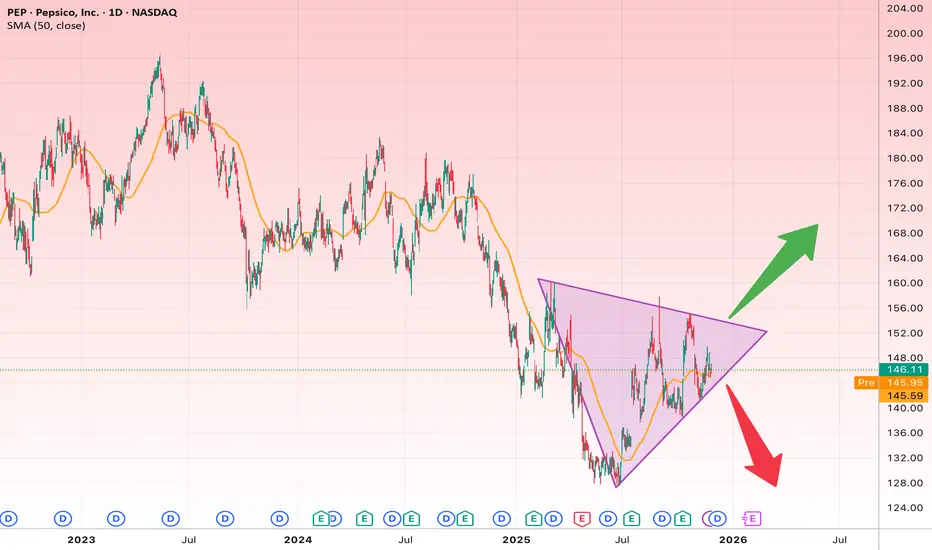
PEP Is Coiling for a Big Move: Breakout or Breakdown?The PEP daily chart is forming a symmetrical triangle, a classic consolidation pattern that often leads to a strong breakout. Price has been bouncing between the upper and lower trendlines and is now positioned around the middle of the structure.
Bullish Scenario
If the price breaks above the upper trendline around $150–$152, a bullish continuation is likely.
Bullish Targets:
• Target 1: $160
• Target 2: $168
• Target 3: Up to $175 if momentum is strong
Bearish Scenario
Breaking below the lower triangle boundary (~$142) could trigger a deeper decline.
Bearish Targets:
• Target 1: $136
• Target 2: $130
Stop Loss
• For long positions: Below $142
• For short positions: Above $152
XAUUSD: Buyers Aiming for a Rebound Toward $4,170 ResistanceHello everyone, here is my breakdown of the current Gold setup.
Market Analysis
XAUUSD continues to trade within a corrective structure, forming a broad Triangle Pattern defined by the Triangle Resistance Line above and the Triangle Support Line below. After a strong impulsive rally earlier, gold entered a prolonged consolidation phase, highlighted by a clear Range Zone where price repeatedly tested both the upper and lower boundaries without establishing a directional breakout. Several Breakouts occurred during this period, but each bullish attempt failed to secure continuation, leading to pullbacks that kept the market inside the broader consolidation. This showed clear indecision and a balanced battle between buyers and sellers.
Currently, gold retested the Support Zone around $4,040–$4,060, which coincides with the Triangle Support Line. A fake breakdown occurred below this level, but the market quickly bounced back, confirming strong demand and rejecting the bearish attempt. This rebound signals that buyers are actively defending the structure. Price is now stabilizing above support and showing early signs of bullish pressure. If buyers maintain control, the next logical target becomes the major Resistance Level at $4,170, which has acted as a key cap on previous bullish attempts. As long as XAUUSD stays above the Support Zone and trades within the rising trendline structure, the overall market bias remains moderately bullish.
Scenario & Strategy
I expect gold to gradually move upward from the current support area and retest the $4,170 Resistance Level. Minor corrections may occur along the way, but as long as price holds above $4,040, the bullish scenario remains valid. A clean breakout above $4,170 could trigger a stronger bullish continuation toward the next supply zone.
However, a breakdown below the Support Zone and Triangle Support Line would invalidate the bullish scenario and open the way for deeper correction. For now, buying the dips remains the more favorable approach as long as gold respects demand and stays within the triangle structure.
That's the setup I'm tracking. Thank you for your attention, and always manage your risk.

GOLD → Distribution phase. Focus on 4150...FX:XAUUSD is trading at a one-and-a-half-week high, supported by a weaker dollar and growing expectations of Fed policy easing. More news ahead...
US PPI inflation showed signs of slowing (2.7% y/y). Retail sales and consumer confidence were weaker than expected. The probability of a Fed rate cut in December rose to 85%. Fed members (Williams, Waller, Miran) supported the possibility of easing
However, progress in Russia-Ukraine negotiations is limiting growth
Today, attention is focused on data on jobless claims and durable goods orders
The combination of soft monetary policy, geopolitical risks, and structural demand from the Central Bank creates a favorable backdrop.
Resistance levels: 4156, 4211
Support levels: 4146, 4111
Gold continues to recover after breaking out of consolidation and holding above 4110. Focus on the next trading range (consolidation) of 4156 - 4111. If the bulls keep the price above 4146 - 4156, the next target could be 4211 - 4245.
Best regards, R. Linda!

GOLD → Psychological level retest before growth FX:XAUUSD breaks through consolidation resistance and renews its high to 4155. As part of a minor correction, a retest of 4100 may form and a battle for key support...
The probability of a Fed rate cut in December has risen to 81%. Fed members (Williams, Waller, Daly) supported the possibility of easing this year.
Progress in negotiations between the West and Ukraine with Russia reduces demand for defensive assets.
Gold remains sensitive to inflation and retail sales data. Strong figures could adjust rate expectations and limit growth, while weak data would support the bulls.
Technically, a retest of the 4110-4100 zone is forming. If the bulls hold their ground above this level, a new trading range of 4100-4150 could form.
Resistance levels: 4155, 4211
Support levels: 4111, 4100
The importance of the 4100 zone is that it is an area of imbalance and breakeven, a consolidation boundary, as well as a psychological level. Accordingly, the reaction to this area should be aggressive. If the reaction is weak, the price may be dragged below 4100. Otherwise, I expect consolidation above 4111 and further growth to 4155 (possibly to 4200).
Best regards, R. Linda!

BNBUSDT → The hunt for liquidity before the decline BINANCE:BNBUSDT.P breaks through the 880 support level as part of a global downtrend and updates its low to 790. Fundamentally and technically, the situation is weak...
Bitcoin and the cryptocurrency market as a whole are in a global downtrend. Within the trend, countertrend corrections are forming as a “hunt for liquidity” before the decline continues...
After updating its low to 790.9, BNB is forming a pullback, the target of which may be the resistance area of 879-888, which acts as a break-even zone (area of interest for MM). A false breakout could trigger a decline of 1/2, 2/3 of the current range.
Resistance levels: 879-880, 940
Support levels: 837, 814, 790
A retest of resistance and a lack of bullish potential could trigger a false breakout. Consolidation and a close below 879 could lead to another phase of selling and a correction to 837-814.
Best regards, R. Linda!

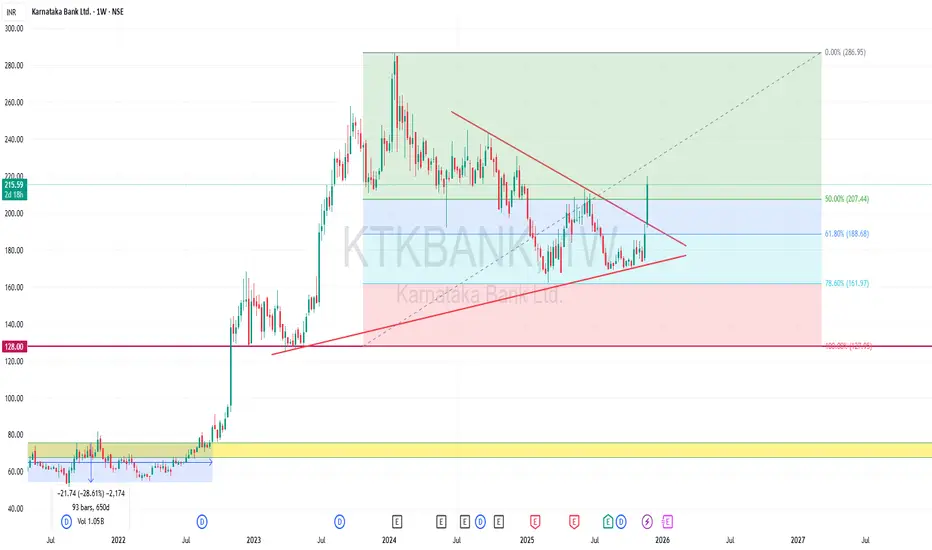
Triangle Breakout in KTKBANKThe potential breakout of the triangle pattern. The breakout candle is more bullish and revealing us the strong bullish moment in the future. I'm Expecting at least the price to reach 280 to 300 Levels.
Can crypto catch the rate cut bid?Recently I noticed a falling wedge on an equal-weight crypto basket which can be bullish. However prices resolved sharply lower!
This week is seeing an aggressive increase in Dec Fed rate cut expectations, evidenced by
Bond yields TVC:TNX -- lower
US Dollar fx basket TVC:DXY -- lower
Small cap stocks AMEX:IWM -- higher
The moves haven't all happened in tandem; it looks like bonds were first to price in the rate cut bet. In recent sessions we're starting to see a follow through in Dollar and small cap stock pricing.
Nothing says a rate cut is imminent, but if the market is pricing for that across asset classes, does that make a stronger case for a small ascending triangle in an equal-weight crypto basket?

A down triangle is forming, tipical consolidation.A down triangle is forming, typical consolidation style, wait for it to break.