AUDUSD: Bearish Move From Resistance Confirmed?! 🇦🇺🇺🇸
There is a high chance that AUDUSD will retrace
from the underlined blue resistance.
As a confirmation, I spotted a descending triangle pattern
on an hourly time frame.
I expect a bearish move to 0.6488 level.
❤️Please, support my work with like, thank you!❤️
I am part of Trade Nation's Influencer program and receive a monthly fee for using their TradingView charts in my analysis.
Triangle

DASH/USDT , 1W ( Ready for 85% Up Move ) Dash is moving inside wedge or ascending channel pattern , when it is at support and forming the pattern at support after breaking out the pattern it is giving very good move like previous and now we can expect 80% move .
and at the same time Bitcoin dominance is decreasing and altcoins dominance is started increasing , so look on all the altcoins
and follow proper risk management , it has very good chances to move UP side but first we have to protect the down side , where risk management comes into game .

AIMTRON | Buy above 745 | SL below 670 | Targets 965, 1275Disclaimer:
This is not financial advice. Please do your own research or consult with a financial advisor before making any investment decisions. Investments in stocks can be risky and may result in loss of capital.

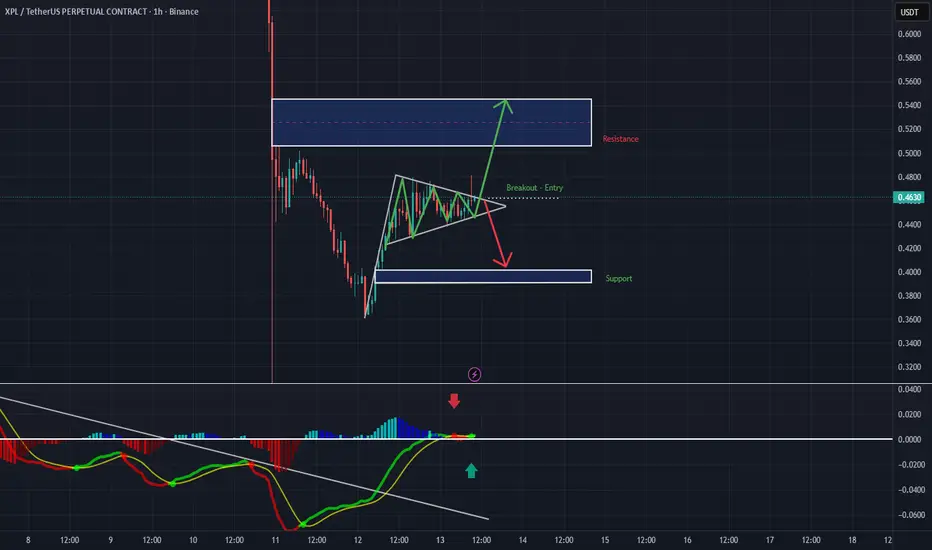
$XPL | 1H ChartPrice is consolidating in a symmetrical triangle after a strong drop volatility is loading.
Currently sitting at the breakout zone.
A decisive move is coming soon 👀
✅ Bullish scenario: Break and close above → target resistance zone $0.50+
❌ Bearish scenario: Rejection → revisit support near $0.40
Momentum indicator showing early signs of a potential reversal.
Let’s see which side wins the breakout ⚔️
#XPL #Crypto #TradingView #PriceAction #Breakout
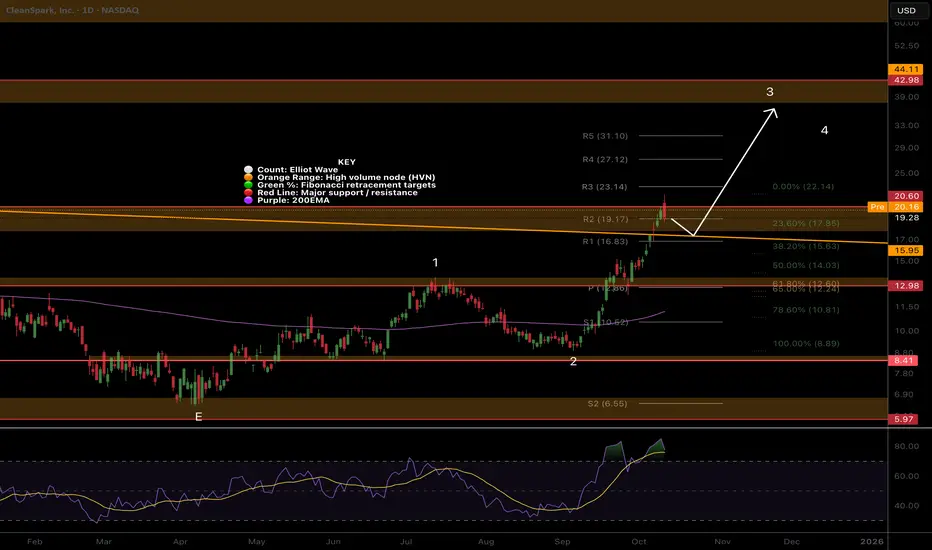
CLSK Rejected at thr major resistance, higher to go CLSK hit our first take profit target at the major resistance High Volume Node but has broken out of the macro triangle structure hinting at a big move still to come! Nothing concerning for me yet happening.
Wave 3 is underway to a minimum target of the $40 High Volume Node
RSI is overbought but no divergence and this can persist up here for months.
Safe trading
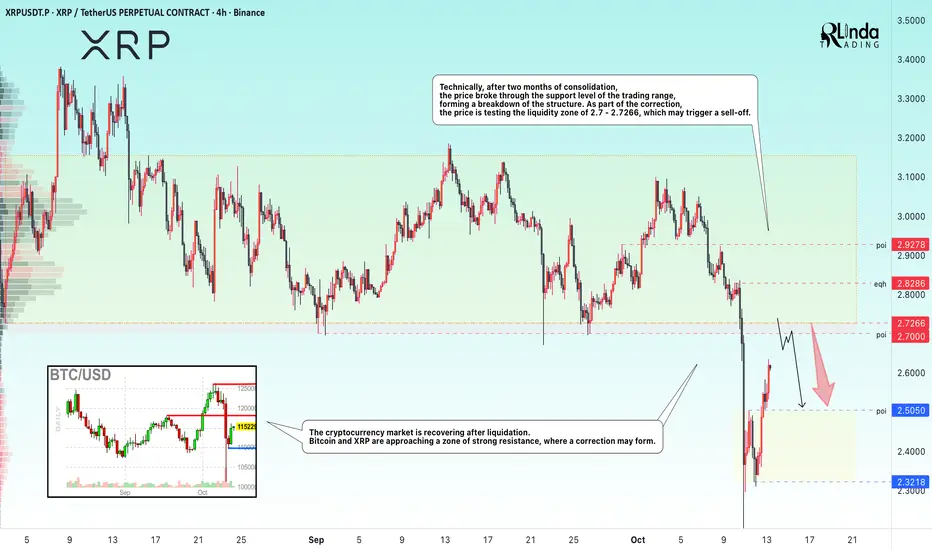
XRPUSDT → Resistance at 2,700 could trigger a correction BINANCE:XRPUSDT is forming a correction after a strong sell-off. It is not yet worth hoping for strong growth without pullbacks, as there is a strong resistance zone ahead.
The cryptocurrency market is recovering after liquidation. Bitcoin and XRP are approaching a strong resistance zone, where a correction may form.
Technically, after two months of consolidation, the price broke through the support of the trading range, forming a breakdown of the structure. As part of the correction, the price is testing the liquidity zone of 2.7 - 2.7266, which may trigger a sell-off.
Resistance levels: 2.7 - 2.7266, 2.8286
Support levels: 2.505
A sharp rise and the lack of technical potential to break through the resistance level of 2.70 may trigger a false breakout and a correction to the support level of 2.5050.
Best regards, R. Linda!
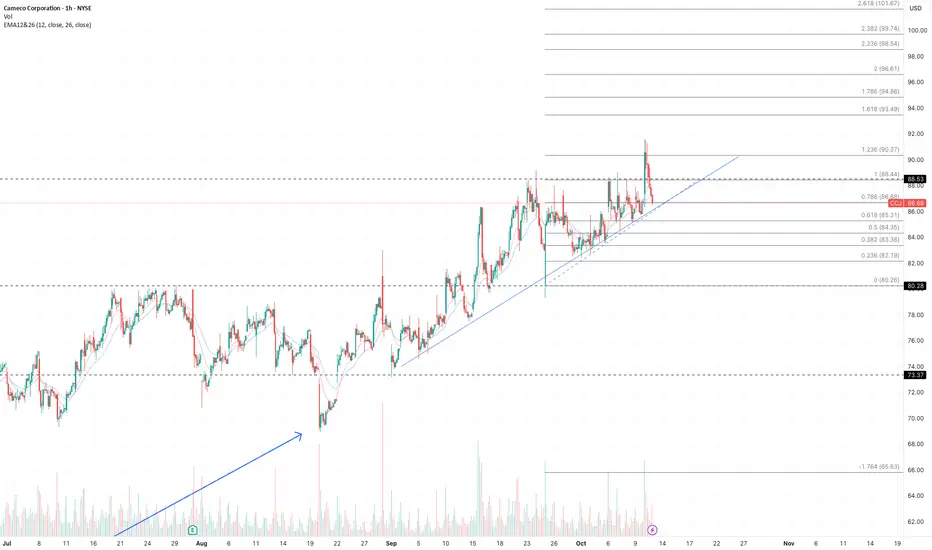
$CCJ Ascending Triangle BreakoutTested above the resistance but failed on the daily. Wait for $88.53 and see what happens.
EP: Strong volume above $88.53
SL: $86.60
TP: $93.49
TP2: $96.61
TP3: 101.67
MP Ascending Triangle BreakoutClose don the daily above the $77.26 resistance zone. An impulse up and then a retrace back to $77.26 as a new support, we should go to $90.

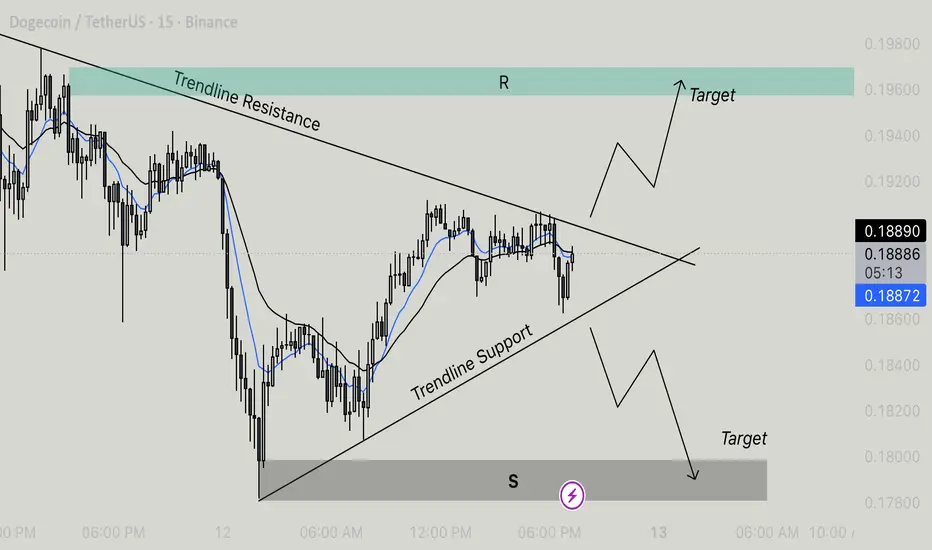
Doge Getting Ready For A Big MoveThe chart shows Dogecoin currently consolidating within a symmetrical triangle pattern — characterized by converging trendlines of resistance and support. This pattern typically signals an impending breakout, but the direction (upward or downward) depends on which boundary the price breaches first.
⸻
Key Levels
• Resistance Zone (R): Around 0.19600, marked by the upper trendline.
• Support Zone (S): Around 0.17800, marked by the lower trendline.
• Current Price: Approximately 0.1888 USDT.
⸻
Technical Outlook
• Trendline Resistance: Price has tested the upper boundary multiple times but has yet to break above it. A successful breakout above this line could trigger bullish momentum toward the 0.19600 target area.
• Trendline Support: The lower boundary is holding as dynamic support. A breakdown below this level would indicate bearish continuation, with a potential move toward the 0.17800 target zone.
• Moving Averages: The blue (short-term) moving average is closely tracking the black (medium-term) average, showing consolidation and indecision in the market. A crossover above or below could confirm breakout direction.
⸻
Scenarios
• Bullish Scenario:
If DOGE breaks above the resistance trendline, expect upside continuation toward 0.195–0.196 USDT. This would confirm a bullish breakout from the symmetrical triangle pattern.
• Bearish Scenario:
A decisive close below the trendline support could signal downward momentum, with a target near 0.178 USDT.
⸻
Summary
Dogecoin is at a critical decision point within a symmetrical triangle. Traders should watch for a confirmed breakout above resistance or breakdown below support for potential trade entries. Volume confirmation will strengthen the reliability of either breakout direction.
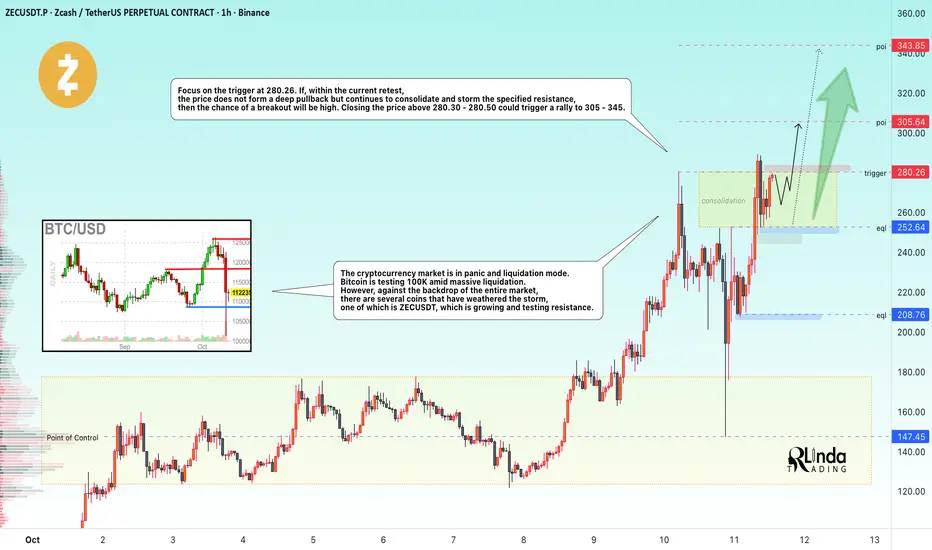
ZECUSD → The altcoin exception that is growingBINANCE:ZECUSDT withstood the blow of the global decline that affected the entire cryptocurrency market, liquidating long positions worth $10 billion. But even in such a situation, there can be exceptions ;)
The cryptocurrency market is in panic and liquidation. Bitcoin is testing 100K amid massive liquidation. However, against the backdrop of the entire market, there are several coins that have withstood the blow, one of which is ZECUSDT, which is growing and testing resistance
ZEC was also hit by the decline, but after testing the control point in the area of maximum volume density 145-155, the market aggressively and quickly bought up the altcoin, indicating bullish strength at the moment.
Resistance levels: 280.30, 305.65
Support levels: 242.64, 208.76
Focus on the trigger at 280.26. If, during the current retest, the price does not form a deep pullback but continues to consolidate and storm the specified resistance, then the chance of a breakout will be high. A closing price above 280.30 - 280.50 could trigger a rally to 305 - 345.
Best regards, R. Linda!
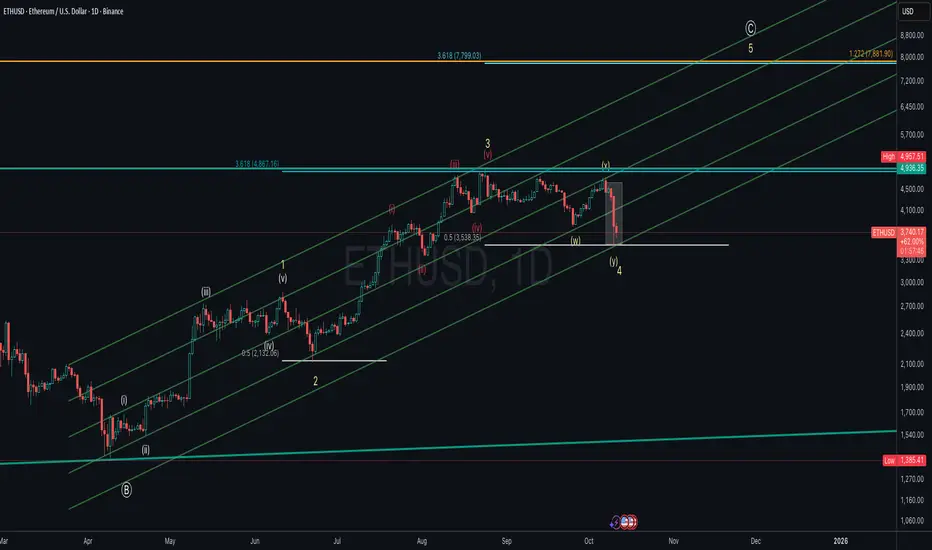
ETHUSD – Wave 4 Correction Near Completion? Preparing for the FiEthereum (ETHUSD, Log Mode) appears to be completing a Wave 4 corrective structure (W–X–Y) within the broader impulsive cycle from the March lows.
Wave 4 found strong support near the 0.5 retracement level around $3,500, aligning with the lower parallel channel of the wave 3 advance.
A potential Wave 5 rally could begin once confirmation of reversal is seen, with upside targets projected at:
$4,867 (3.618 extension of Wave 1)
$7,800–$7,900 (1.272 extension of the macro structure)
If ETH breaks below $3,500, it could invalidate this immediate bullish count and suggest a deeper correction.
Key Levels:
Support: $3,530 / $3,350
Resistance: $4,867 / $7,800
Invalidation: Below $3,500
Watching for signs of a Wave 4 bottom to confirm the start of Wave 5, potentially leading Ethereum into new all-time-high territory in the coming months.
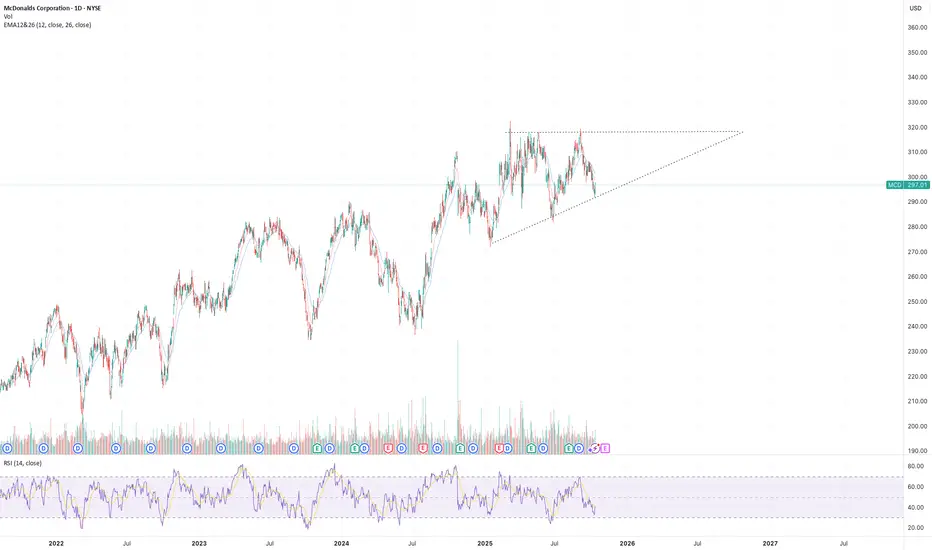
MCD Daily Chart 10/11/25MCD looks to be at the bottom end of an ascending triangle pattern. If it can hold it should run to retest ATHs
Silver Bullet/Rocket Schedule. 11/Oct/25XAGUSD rocket launching might failed again on 3rd attempt at 56 +/- latitude on early 2026..before successfully shooting to outer space

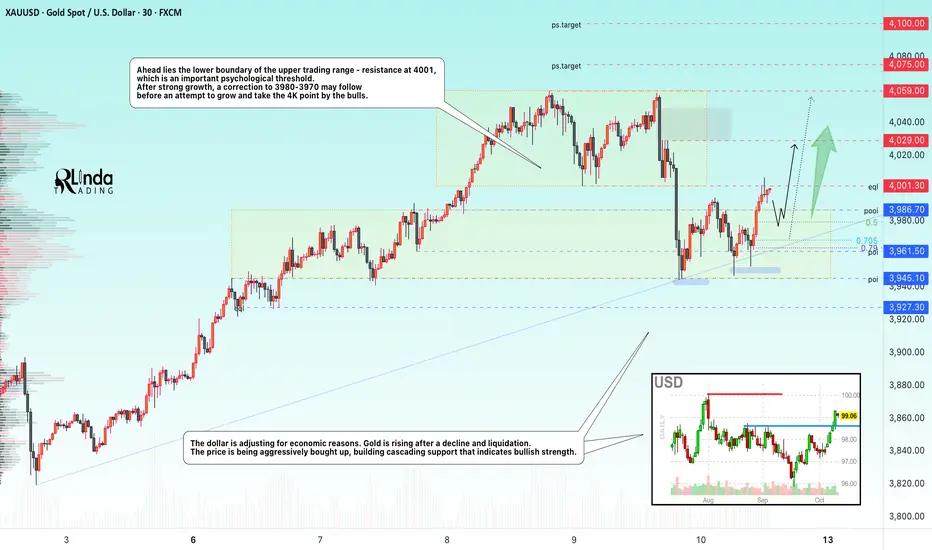
GOLD → Retest 4000. Pullback before a breakout and rise to 4100?FX:XAUUSD , after a sharp sell-off and testing of the 3950 support zone, is aiming to return to the $4000 level on Friday, preparing for its eighth consecutive week in positive territory.
The Senate adjourned for the weekend until Tuesday, postponing a decision on the shutdown. John Williams supported further rate cuts, Mary Daly confirmed her readiness for cuts, despite the fact that Powell did not say anything particularly interesting about policy on Thursday.
The upward trend in gold remains unchanged. The potential for growth to new highs remains, provided the shutdown continues and the Fed maintains its soft policy. The $4000 level remains a key psychological support.
Resistance levels: 4000, 4059, 4075
Support levels: 3986, 3980, 3968
The 4000 zone may prove to be strong resistance, so expect a battle (consolidation or trading range in this zone), during which the price may form a pullback to 3980-3970 before returning to 4K for a breakout attempt.
Best regards, R. Linda!
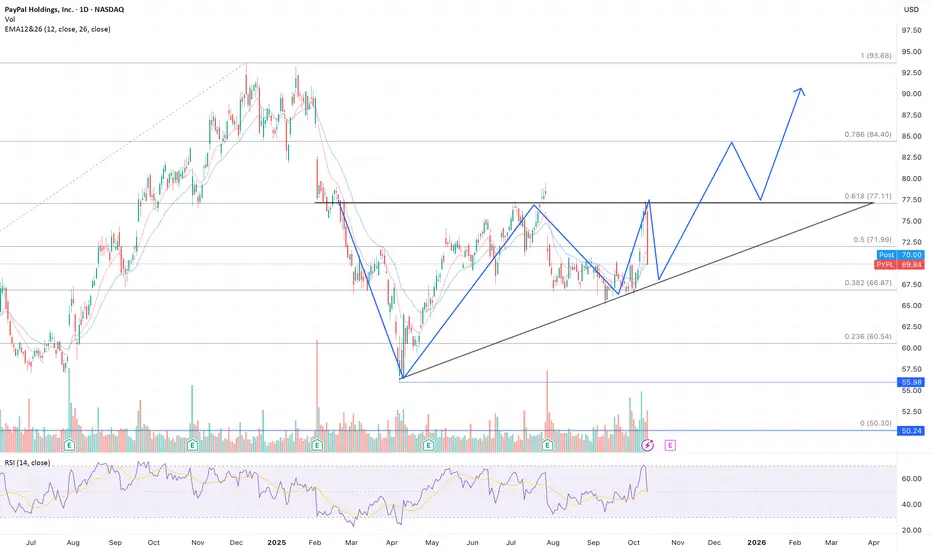
PYPL Ascending Triangle FormingBreakout above 77 it can go above 80 easy. It's consolidating after a long drop the last few years. Still great fundamentals.
Oil Crash | $33Price action making another leg down after retesting the breakout ~($68) from the descending triangle
Would like to see a move to $56 then another retest towards the breakout before any major selling.
Overall target for long term swing $33.

Euro may Break the 1.1550 Support LevelHello traders, I want share with you my opinion about Euro. The dominant market pressure for the Euro has been bearish since the price failed to sustain its rally to the 1.1920 high. This reversal initiated a significant downward trend for EURUSD, characterised by the breakdown of several key market structures, including the prior upward channel and the major 1.1740 resistance level. Currently, this bearish impulse has brought the price down to the major horizontal support level at 1.1550, an area which also coincides with a historical buyer zone. The price is now in a consolidation phase, attempting a minor corrective bounce from this support. In my mind, this bounce appears weak and lacks the momentum to signal a true reversal. I expect that this small upward movement will fail to attract significant buying interest and will soon be overcome by the prevailing selling pressure. I think a failure of this bounce will lead to a decisive breakdown below the 1.1550 support level. Therefore, I have placed my TP at 1.1510, targeting a new structural low in what I believe is a continuation of the primary downward trend. Please share this idea with your friends and click Boost 🚀
Disclaimer: As part of ThinkMarkets’ Influencer Program, I am sponsored to share and publish their charts in my analysis.

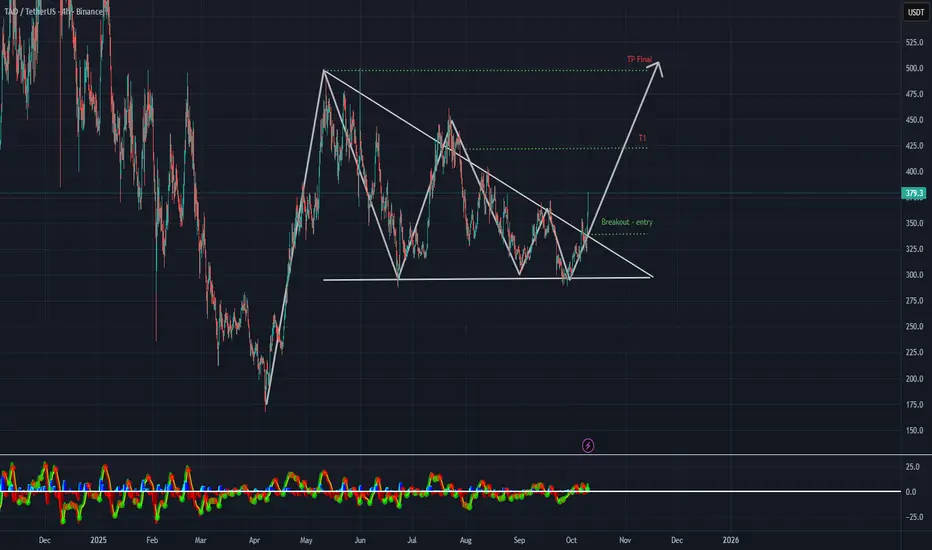
TAO | 4H ChartGETTEX:TAO | 4H Chart
Textbook Falling Wedge breakout with strong momentum.
Structure has been building for months — bulls finally taking control.
✅ Breakout confirmed above resistance
✅ Retest holding clean
✅ Volume picking up
Targets:
• T1 → $405
• Final TP → $500
If momentum sustains, this could mark the start of a major trend reversal.
#Bittensor #TAO #Crypto #Altcoins #TradingView #Breakout
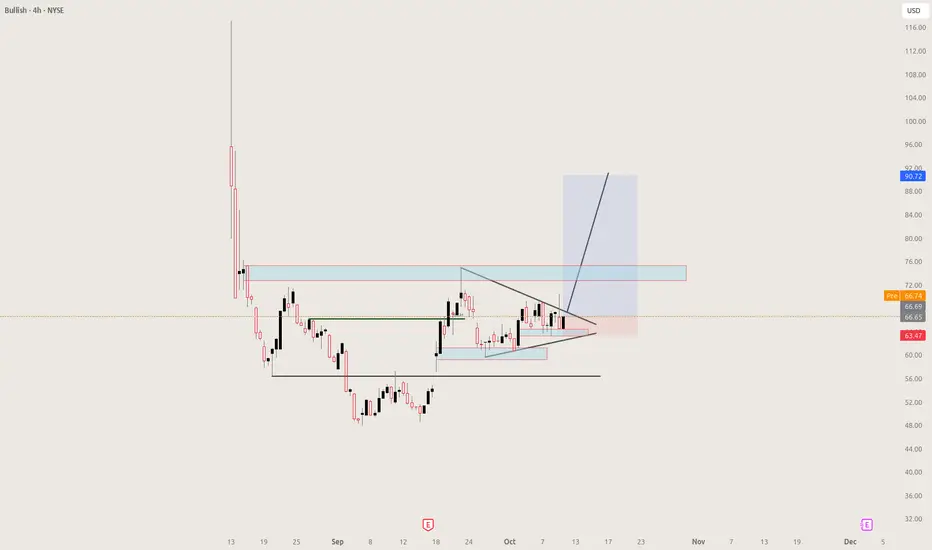
Bullish Triangle BLSH Exchange🎯 Technical Setup:
2+ month post-IPO descending triangle at APEX
Strong $60.00-62.00 support tested multiple times
Volume drying up = coiling for EXPLOSIVE breakout
Target: $92.00-100.00+ (50-70% gain minimum)
🚀 Fundamental GOLDMINE:
Regulatory Powerhouse: Fresh NYSE listing with BitLicense unlocking U.S. spot trading in 20 states
Trump Catalyst: Stablecoin law signed July 2025 supercharged crypto legitimacy, boosting regulated players 30%+
Global Expansion: MiCA license in Germany passports services across EU for institutional floodgates
Proven Volume: $1.5T+ cumulative trading since 2021, top-10 BTC/ETH exchange
💰 The Arbitrage Opportunity:
Currently valued like volatile crypto startup (8-10x EV/EBITDA)
Should be valued like compliant fintech leader (18-22x EV/EBITDA)
Potential revaluation: 150-250%!
🎪 Why This Could Be HUGE:
Industry Trend: 40% of crypto exchanges pivoting to full regulation by 2027
Institutional Wave: BlackRock & ARK poured $200M+ at IPO—more TradFi inflows imminent
First-Mover: Bullish among pioneers with tier-1 licenses in U.S., HK, Germany, Gibraltar
Backed by Legends: Peter Thiel's Founders Fund & Block.one treasury fuel aggressive growth
My Targets:
Phase 1: $80.00 (technical measured move)
Phase 2: $92-100 (regulatory revaluation begins)
Phase 3: $120+ (full institutional adoption recognized)
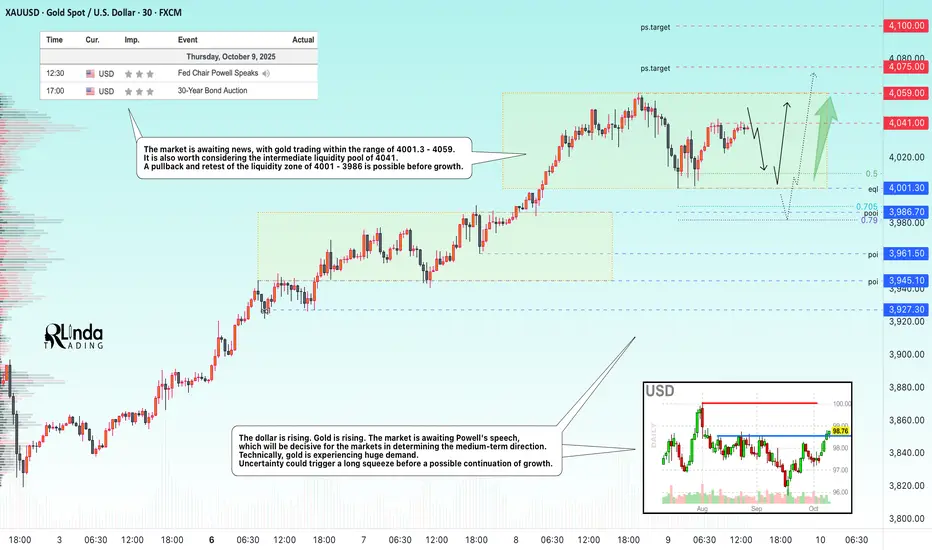
GOLD → The correction will provide a good opportunity for longFX:XAUUSD remains above the psychologically important level of $4,000, having corrected from a record high of $4,059. The market is awaiting Powell's speech, which could set the medium-term tone for the markets...
Key supporting factors: Uncertainty over the shutdown: The phased reopening plan has not yet been approved, which is keeping demand for safe-haven assets high.
Expectations of Fed easing: The probability of a rate cut in October is 100%, and in December is 80%, despite disagreements within the Fed.
As prices rise, the risks of a correction increase, especially against the backdrop of the Fed chair's speech.
Gold remains in a bullish trend. A correction to $4,000 looks like a healthy pause. Further dynamics depend on the Fed's tone and developments with the shutdown — a break below $4,000 is unlikely without new fundamental reasons.
Resistance levels: 4041, 4059, 4100
Support levels: 4001, 3986
Technically, gold has been rising without pullbacks for 35 days. The growth amounted to more than 22%. Accordingly, the market may form corrections, pullbacks, or consolidations within local timeframes. News may provoke such corrective maneuvers before the main movement. I consider the support levels of 4000 - 3986 - 3961 to be areas of interest. A retest or false breakdown could trigger a rebound and growth.
Best regards, R. Linda!
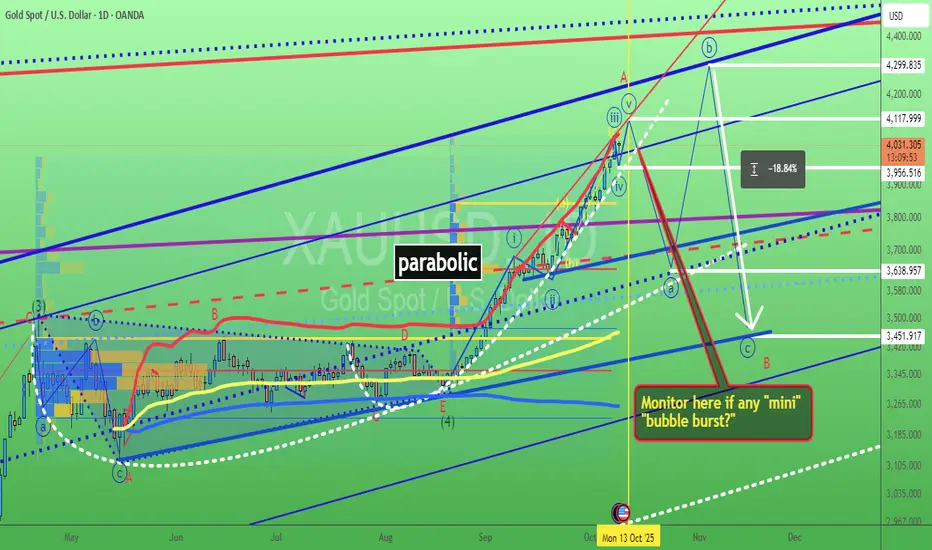
Gold waiting for its "mini" bubble burst? 9/Oct/25XAUUSD is forming another parabolic moves = the basic sign of bubble after triangle breakout. It has surged nonstop with many "mini bubble" inside big bubble So Watchout sudden small bubble burst first before surging for bigger bubble.
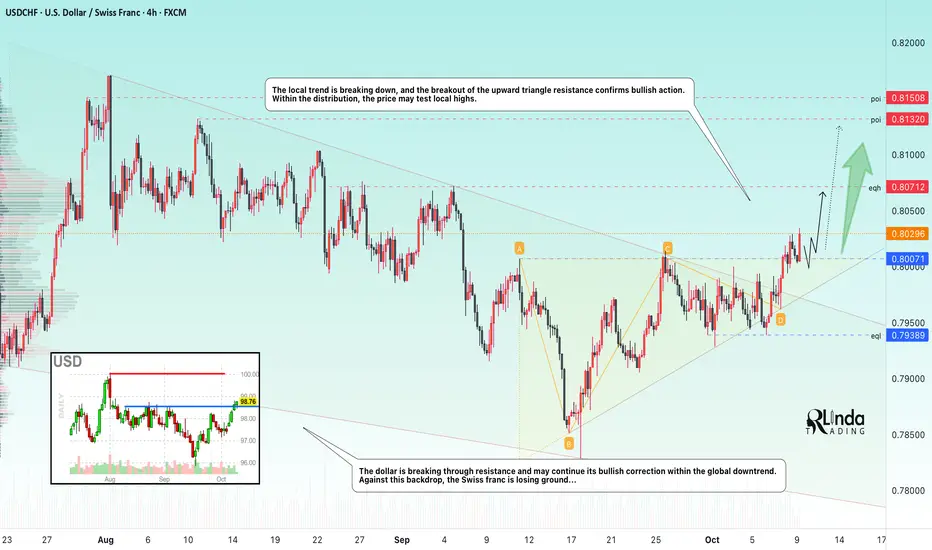
USDCHF → Change in local trend. Confirmation...FX:USDCHF confirms a change in the downtrend and is ready to move into a distribution phase amid growth in the dollar index.
The dollar is breaking through resistance and may continue its bullish correction within the global downtrend. Against this backdrop, the Swiss franc is losing ground...
The currency pair is forming a breakout of the local trend. The breakout of the resistance of the ascending triangle confirms bullish action. As part of the distribution, the price may test local highs.
Resistance levels: 0.8071, 0.8132
Support levels: 0.800
A consolidation of the price above 0.800 may form an intermediate bottom, which will provide support for the bulls before the next run.
Best regards, R. Linda!
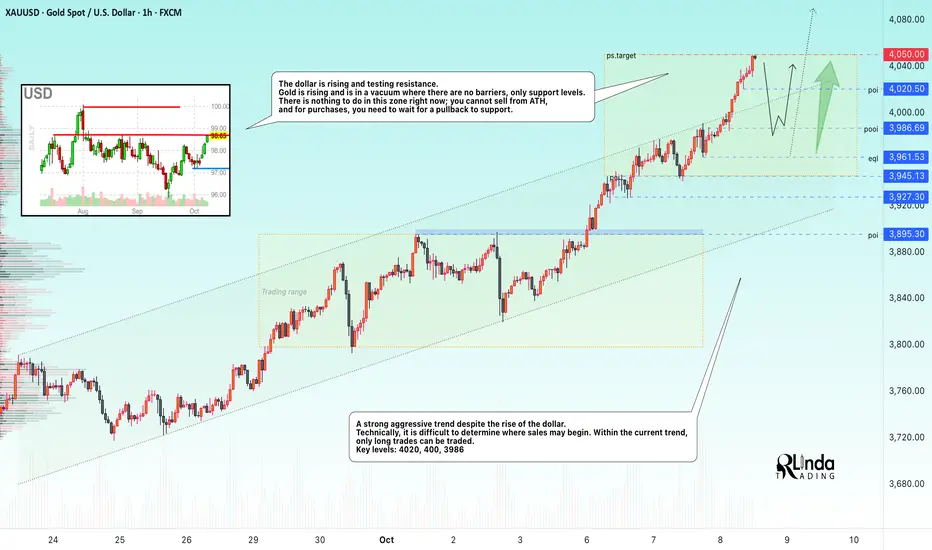
GOLD → Testing 4050 - 4100. Need a pullback to tradeFX:XAUUSD is hitting a new all-time high, testing $4,050, and looks set to reach $4,100. This record growth is linked to falling interest rates and economic risks, which are causing money to flow into hedge assets...
Key drivers: The White House may announce civil service cuts amid the shutdown, which increases uncertainty. The probability of interest rate cuts in October is 95%, supported by the delay in data publication due to the shutdown. Global central banks continue to build up reserves. However, as prices rise, so do the risks of correction. The USD is also receiving support as a safe haven, which may limit further growth in gold.
Resistance levels: 4050, 4075, 4100
Support levels: 4020, 400, 3986
Technically, we need to wait for a slowdown and correction to take a full breath before further movement. I consider the local liquidity zones of 4020 - 4000 - 3986, 3961 to be promising areas of interest. I do not rule out the possibility of sharp shocks in the market, so we need to be prepared...
Best regards, R. Linda!