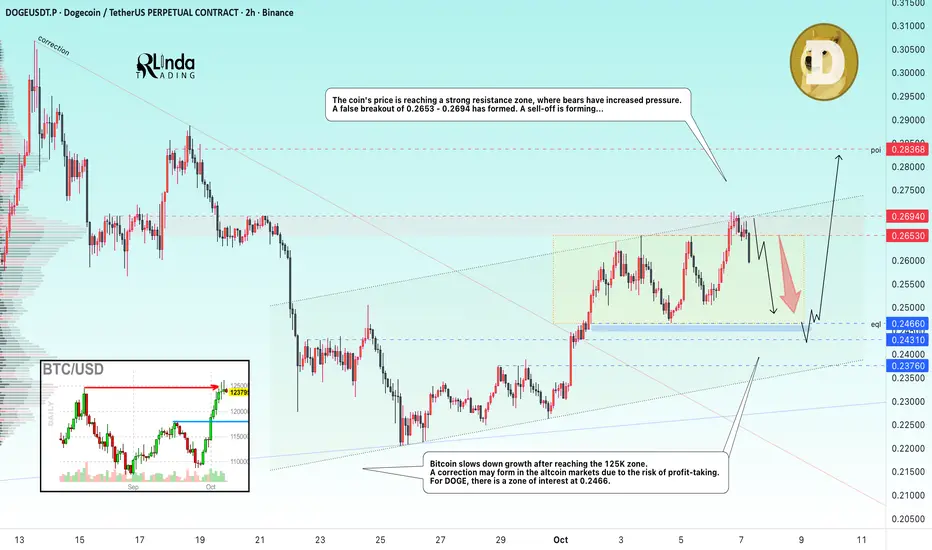
DOGEUSDT → Correction to 0.246. The hunt for liquidity BINANCE:DOGEUSDT.P attempted to realize its potential after breaking out of the downward resistance. After updating the local maximum to 0.27, the price entered a phase of correction and consolidation...
Bitcoin slows down its growth after reaching the 125K zone. A correction may form in the altcoin markets due to the risk of profit-taking. For DOGE, there is a zone of interest at 0.2466
The price of DOGE has reached a strong resistance zone, where bears have increased pressure. A false breakout of 0.2653 - 0.2694 has formed. A sell-off is forming...
Resistance levels: 0.2653, 0.2694
Support levels: 0.2466, 0.2431, 0.2376
Against the backdrop of market correction, a downward rally associated with panic selling is forming. The support zone that is of interest to the market is 0.2466, and this zone is quite capable of stopping the decline. A false breakdown and holding the price above 0.246 - 0.243 may renew interest in growth.
Best regards, R. Linda!
Triangle
Bearish Setup Builds in GBP/AUDSitting in a descending triangle pattern, a downside break of 2.0300 in GBP/AUD may elicit further selling, putting lower levels in play.
Should we see a decisive break of 2.0300, shorts could be established with a tight stop above for protection, targeting 2.0065, which the price tagged on multiple occasions earlier this year before staging a decisive break higher.
While bearish momentum is not strengthening, signals from RSI (14) and MACD both favour playing the pair from the short side, sitting below 50 and 0, respectively.
Good luck!
DS

CAKE – Triangle Pattern Forming: Breakout Incoming?Hey traders! 👋
#CAKE is currently consolidating within a symmetrical triangle – a classic setup that often precedes a big move! The price action is tightening, and momentum is building. 📈
🔍 What We're Watching:
Pattern: Symmetrical Triangle
Bias: Bullish, with potential for upside breakout
Key Resistance: 2.65
Entry Plan:
We'll wait for a confirmed breakout above resistance, followed by a clean retest of the broken structure. If the retest holds, that’s our cue to go long!
✅ Risk Management: Stop-loss just below the retest zone. Target based on measured move of the triangle.
🧠 Why This Setup Matters:
Triangle breakouts often lead to strong continuation moves, especially in trending markets. If CRYPTOCAP:BTC and the broader altcoin market remain bullish, #CAKE could cook up a nice rally!
💬 Let me know your thoughts! Are you bullish on #CAKE too?
💡 Drop your targets in the comments!
📈 Like & follow for more chart setups and trade ideas.
#CAKEUSDT #CryptoTrading #TriangleBreakout #Altcoins #TradingView #PriceAction #TechnicalAnalysis #BullishBreakout #CryptoSetup #TradersJournal

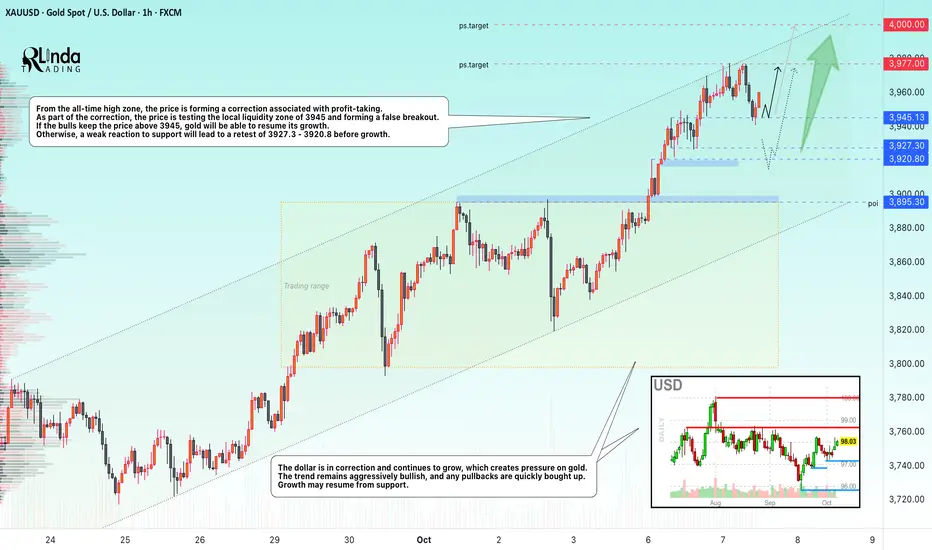
GOLD → The correction will trigger growth to $4,000.FX:XAUUSD hit a new record high of nearly $3,977 and entered a correction phase to build up potential before further growth. Despite the local strengthening of the dollar, the upward trend continues thanks to a combination of macroeconomic and geopolitical factors.
Key supporting factors: Ongoing US government shutdown: The Democrats' fifth unsuccessful attempt to resolve the issue increases uncertainty. Markets expect two interest rate cuts before the end of the year.
China has been increasing its reserves for the 11th consecutive month, and global central banks bought +15 tons in August.
No bearish triggers: Any correction is seen as a buying opportunity.
Gold maintains its upward momentum. Breaking through $4,000 seems a matter of time if current drivers remain in place. Key risks are an unexpected resolution to the shutdown or hawkish signals from the Fed.
Resistance levels: 3977, 4000
Support levels: 3945, 3927, 3920
Technically, a false breakdown of support could lead to continued growth. A retest of 3945 is possible; a weak reaction could trigger a deeper correction, for example to 3927, before further growth.
Sincerely, R. Linda!
The #1 Stock Buying Secret:Buying Undervalued Stocks A long time ago their was this
Young girl that I pursued.
She said no to my proposal.
She even told me,
"Lubosi I can't be your girlfriend,
My boyfriend works for the mines,
He won't be happy"
This happen during our date when I took her for ice cream.
I felt stupid and like an amateur.
When you enter the Ascending Triangle
+ The Long lower shadow candlestick patterns
You will find this stock.
What I love about this idea
Is the fact that it's following
The 3 month moving average + it's undervalued.
You can see the reversal by using
👉The Stochastic indicator.👈
It's in a oversold channel.
Buying undervalued stocks
Is the Hallmark of trading.
Remember don't use margin.
You want to taste your
Strategies for about 1 year
On a simulation trading account before you use real money.
Rocket Boost This Content To Learn More.
Disclaimer ⚠️ Trading is risky please learn about risk management and profit taking strategies. Also feel free to use a simulation trading account before you use real money.

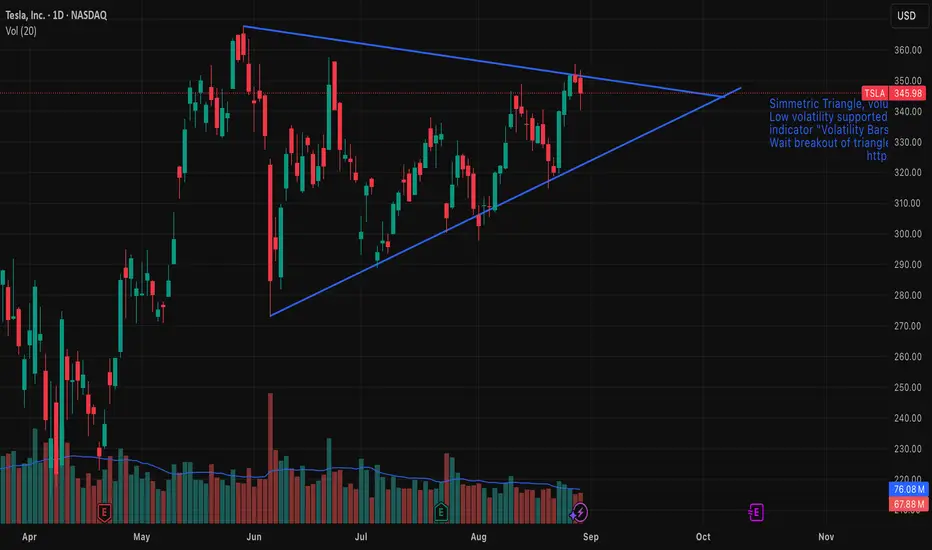
Tesla (TSLA) — Symmetrical Triangle Breakout IdeaSummary
Pattern: Symmetrical triangle on daily chart.
Expected timeframe for breakout: Within 1–2 weeks.
Targets: $367 on an upside breakout; $273 on a downside breakout.
Risk management: Use a stop-loss just outside the triangle after breakout confirmation; position size per your risk rules.
Setup & Rationale
A well-defined symmetrical triangle has formed on TSLA’s price action, characterized by converging trendlines connecting lower highs and higher lows. Volume has contracted inside the pattern, consistent with consolidation. Symmetrical triangles are neutral continuation/reversal patterns; the breakout direction provides the trading signal.
Key technical points:
Price is approaching the apex, increasing the likelihood of a decisive breakout in the next 1–2 weeks.
Volume decline during the consolidation and a volume spike on breakout would confirm conviction.
The breakout should be taken after a daily close beyond the upper or lower trendline (or after a retest), not merely intraday probes.
Entry Criteria
Upside trade: Enter long on a daily close above the upper trendline (or on a confirmed retest).
Downside trade: Enter short on a daily close below the lower trendline (or on a confirmed retest).
Targets & Measurement
Measure the pattern height (vertical distance between the initial high and low of the triangle) and project it from the breakout point.
Upside target (projected): $367.
Downside target (projected): $273.
Adjust targets proportionally if you use a measured move from the actual breakout point rather than the pattern’s maximum height.
Stops & Risk Management
Place stop-loss slightly outside the opposite trendline or beyond a recent swing point to avoid false breakouts.
Preferred approach: fixed-risk percent per trade (e.g., 1–2% of portfolio) and scale position size accordingly.
Consider tightening stops to breakeven after price clears ~50% of the distance to the target.
Confirmation: daily close beyond trendline plus above-average volume (up or down depending on direction).
Symmetrical triangles are neutral; false breakouts occur. Wait for confirmation.
News, earnings, or market-wide events can invalidate technical setups quickly—monitor catalysts.
Adjust targets/stops if volatility expands or if the breakout lacks volume confirmation.
NASDAQ Future long: after resitance broken, new support formed Current Analysis: Nasdaq futures are currently facing a critical support at 22100
I see the chance of a Bullish rebound:
Support Strength: This support was a resistance in past weeks, then it was broken on Feb 14th and act as support in last 3 days.
Additionally, from Dec. 17th to February 12th, price formed a triangle that was broken up on Feb.13th.
Expected Movement: If the price successfully breaks above 22100, I expect it to rally towards the $22400 area.
Action Plan:
Entry Point: entered long with limit order at 22100
Target: Set a target in the $22425 (high of December 17th)
Stop Loss: Place a stop loss at 21937.75, below minimum of Feb.20th and with Risk/Reward Ratio of 2.

symetrical triangle breakoutwe have a high volume symmetrical triangle breakout with a triangle price target at $134
next resistance levels: $70 , $93/$100 and then the target $134.
as the triangle breaks out and ethereum makes no signs of reversal, no divergences. only strong bullish momentum ethereum is set to break its all time high and make a possible rally to $7500.
this would make the symmetrical triangle price target even more possible.
if you are not in yet the symmetrical triangle breakout was your buy signal.

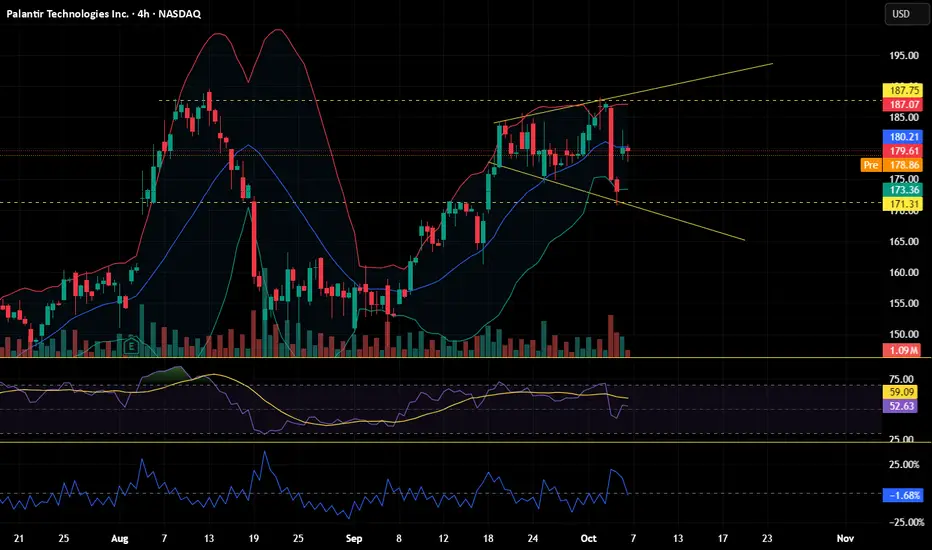
expanding triangleas you see on the chart palantir is ranging in a expanding triangle pattern wich is not bearish or bullish.
but an expanding triangle stands for uncertainty in the markets, wich mostly turns bearish.
for palantir now its a bad time to step in, it would be to much of a gamble.
waiting for a breakout above to go long or a breakout down to go short would be the smartest move to make here
54% Spot Profit ARUSDT / Arweave coinEntry Point : 5.248
Partial-exit : 5.884
Take Profit: 6.65
Stop-Loss : 4.89
A partial exit in the range of 30% to 50% is under consideration and make it free.

$MRVL pullback below $75 sets up new long to $100+MRVL is consolidating in an expanding triangle (bullish) chart formation however price action looks a bit extended here.
I think it's likely that we pullback from here into one of the support levels below, and then that will setup a fresh long up to the upper resistance levels on the chart.
Let's see how the idea plays out over the coming weeks.

#ZECUSDT - Another leg up is aheadWe all saw a massive bullish in zec in previous days out of 260% instant bullish... and now it's in consolidation
it shows a symmetrical triangle pattern in hourly chart with 2 attempts of breakout ... third one must be work
the next station at ( 250 - 280$)
best Regards:
Ceciliones🎯

USDCAD | Yield Gap Supports Wave (y) Push to 1.40
The U.S.–Canada yield spread has widened back toward 1.0%, reflecting hawkish Fed–dovish BoC divergence. This has underpinned broad USD strength and weighed on the CAD.
Technical Lens:
USDCAD has progressed into wave (y) of the corrective structure, breaking through interim resistance and testing the upper channel toward the 1.40 region. The structure remains constructive as long as the channel holds, with the Elliott count framing 1.40 as a key inflection point.
Scenarios:
If the yield gap continues to widen and the channel holds → potential extension to 1.40.
If spreads narrow and price rejects 1.40 → pullback toward mid-channel support near 1.37–1.38.
Catalysts:
U.S. economic data & Fed communication.
Canadian growth signals and BoC policy stance.
Oil price stability (limited CAD support so far).
Takeaway:
The 1.40 zone is the decision point where macro divergence and technical structure converge.

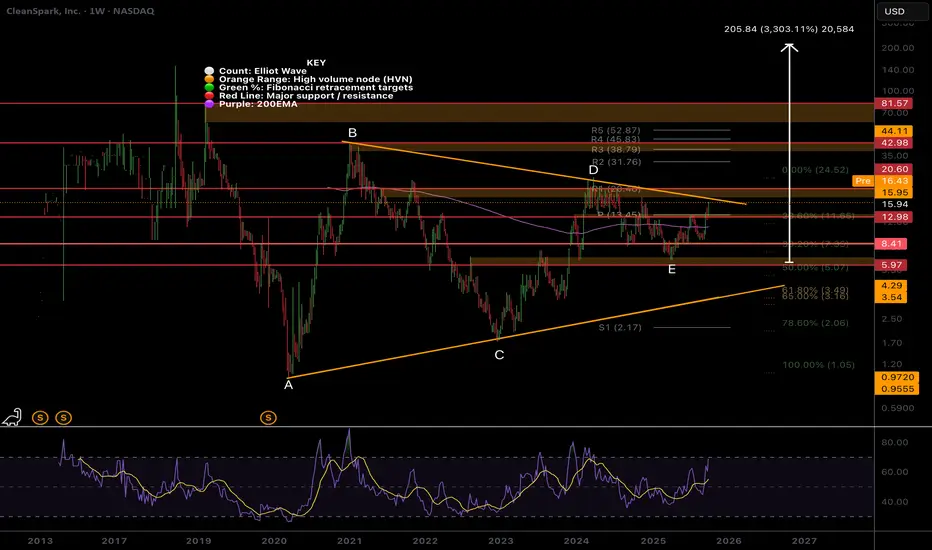
CLSK Testing Macro Triangle Upper Boundary!NASDAQ:CLSK Macro analysis shows a multi-year triangle has completed at the mid EQ, where price has the highest probability of completing wave E. CRYPTOCAP:XRP Did a x10 after this breakout and I am expecting similar move with CLSK.
Price should consolidate for a while in $16-$20 range as it works through wave D and trend-line resistance. Downside target is the weekly pivot at $13.45 which could offer a great buy!
All time high sits at $80, triangle pattern target is extremely high at $200 (triangle height measured from wave E bottom) but take this with a pinch of salt and keep your profit taking realistic! Crazier price moves have happened!
Weekly RSI is not yet oversold and price often gathers months of strong momentum when RSI gets to these levels reinforcing the analysis.
Safe trading
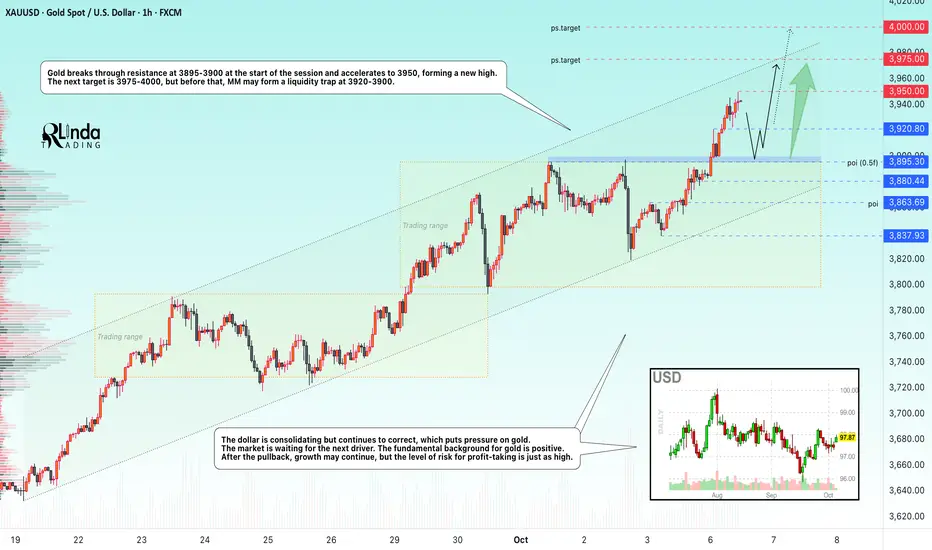
GOLD → Rally to the psychological target of $4,000FX:XAUUSD hit a new all-time high of $3,950 (+1.7% for the day at the time of writing), continuing its move toward the psychological $4,000 mark. The growth continues despite the strengthening of the dollar and the rally in the stock markets.
Key drivers: The ongoing US shutdown (now in its seventh day): The lack of progress in negotiations and the risk of mass layoffs of civil servants are increasing demand for safe havens.
The probability of a rate cut in October is 100%, and in December, 94%. Weak labor market: Trump's statements blaming Democrats for job losses are fueling pessimism.
Fundamentally, gold remains on an upward trend thanks to the perfect combination of US fiscal risks and soft monetary policy. A breakout to $4,000 seems only a matter of time if the shutdown is not resolved.
Resistance levels: 3,950, 3975, 4000
Support levels: 3920, 3900, 3880
Technically, before reaching the 4000 mark, MM may form a liquidation, especially against the backdrop of the FOMC meeting on Wednesday and the Fed on Thursday. Key areas of interest before growth: 3920 and 3900, behind these areas lies a pool of liquidity that will not prevent the accumulation of energy before the next bull run.
Sincerely, R. Linda!
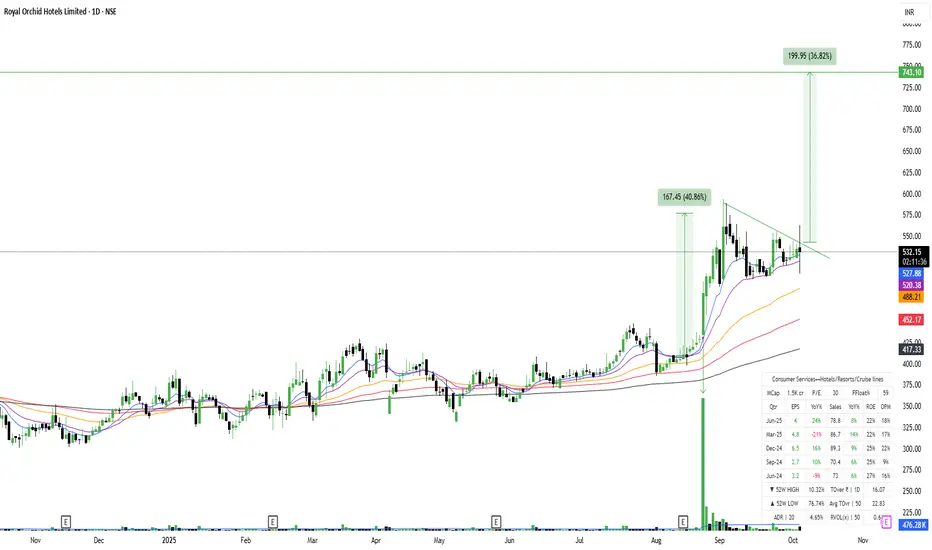
ROHLTD = Descending Triangle Breakout + Volume SurgBreakout from Descending Triangle with Volume Surge in Royal Orchid Hotels
NSE:ROHLTD
📈Pattern & Setup:
Royal Orchid Hotels has given a breakout from a descending triangle pattern on the daily chart. The price successfully closed above the downtrend line, supported by a visible surge in trading volume.
The setup indicates a shift in momentum from sideways to bullish, with strong support from the moving averages (20EMA, 50EMA, and 100EMA) all trending upward. The stock has been consolidating between 480–550 for weeks, and now this breakout confirms renewed buying interest.
📝 Trade Plan:
Entry: Current levels 528–532 look good for a fresh entry.
🚩Stop-Loss: 495 (below recent swing support).
🎯Targets:
Target 1 → 620 (previous swing high).
Target 2 → 743 (measured breakout target with nearly 37% upside).
💡Pyramiding Strategy:
1. Enter first lot near 530–535.
2. Add above 565 after volume confirmation, trail SL to 515.
3. Add final lot above 620, trail SL to 560.
Hold positions for a medium-term swing till 740 zone as long as the price sustains above 500.
🧠Logic Behind Selecting this Trade:
The stock displays a textbook breakout from a descending triangle after weeks of tight range movement — a sign of absorption and strength. The presence of rising EMAs beneath price further strengthens the bullish outlook.
The hospitality sector has shown strong tailwinds lately, and Royal Orchid’s structure aligns perfectly with the sectoral momentum.
Keep Learning. Keep Earning.
Let's grow together 📚🎯
🔴Disclaimer:
This is not an investment advice. Always do your own due diligence before making any trading or investment decision.
Bremworth Limited NZXBremworth breaking out of large triangle (3mo chart)
This is not the ideal entry for me as I don't like to chase
Triangles are rarely reversals, but it is a sort of basing pattern
Fundamentally it has a 3.4x P/E which is low... healthy current ratio of 4x and low debt to equity, 42% insider ownership so it all looks promising....
Short to medium term this could get to $1.60, so roughly 90%... probably do that relatively quickly,
Longer term I think this could get to $4.80 which would be a 6x bagger
Thought it would be interesting to someone...

Gold Ascending Channel | Channel UpThe recent US government shutdown has provided an upside opportunity for the yellow metal, as the shutdown has left investors with uncertainty.
As a result of that we can see opportunities presented and aligning with the chart patterns price has been following.
Friday closed with an ascending triangle on the smaller timeframes, up to M15, which is clearly yet to break out.
However, it MAY be possible to see a low momentum breakout or no breakout and or a reversal to sweep the Sell-Side liquidity left on Thursday, where buyers should step in for continuation at the H1 Demand.
Ensure to manage your risk and protect your psychology and capital.
Have a profitable week!

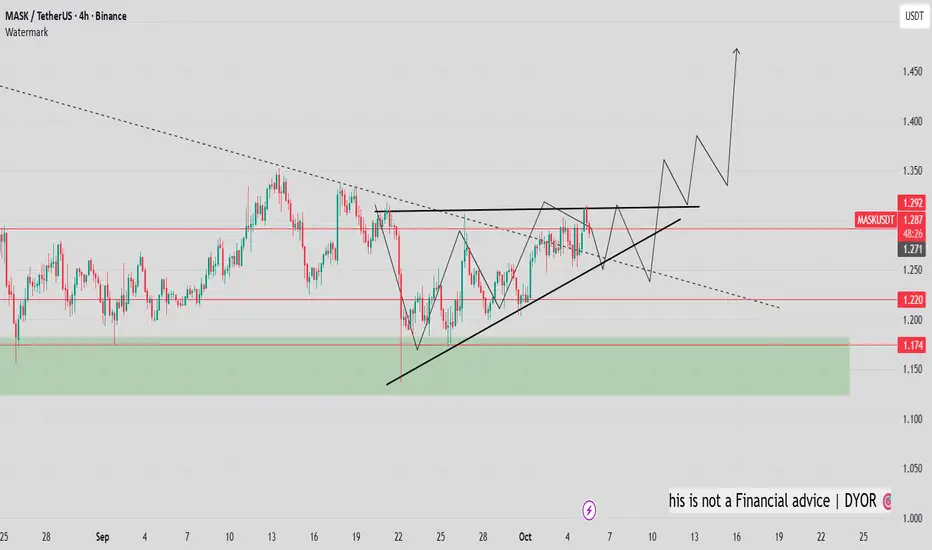
$MASK - bullish breakout awaited! NASDAQ:MASK - bullish setup - long term accumulation 📈
Prices looks set to fly. Matters of days 🚀, or weeks?
110 days accumulation above green zone.
I see a nice ascending channel above the uptrend.
Shakout and bearll trap possible if we grab liquidities around 1.250 - 1.240$ demand zone.
1.400$ + next🎯
1.510 🎯
1.600$ 🎯
Altseason? Not yet 🔎 Ex-Top10 dominance = market share of everything outside the top 10 coins.
Since early-2022, it’s been sliding in a descending triangle (lower highs, flat support) — no strength yet.
✅ Trigger I need: a weekly close above the triangle, ideally > 9.5–10%, with follow-through. That would signal rotation into mid/small-cap alts.
⏳ Until then: bias = BTC/mega-caps. Alts only tactical near 7.2% / 6.6% with tight risk.

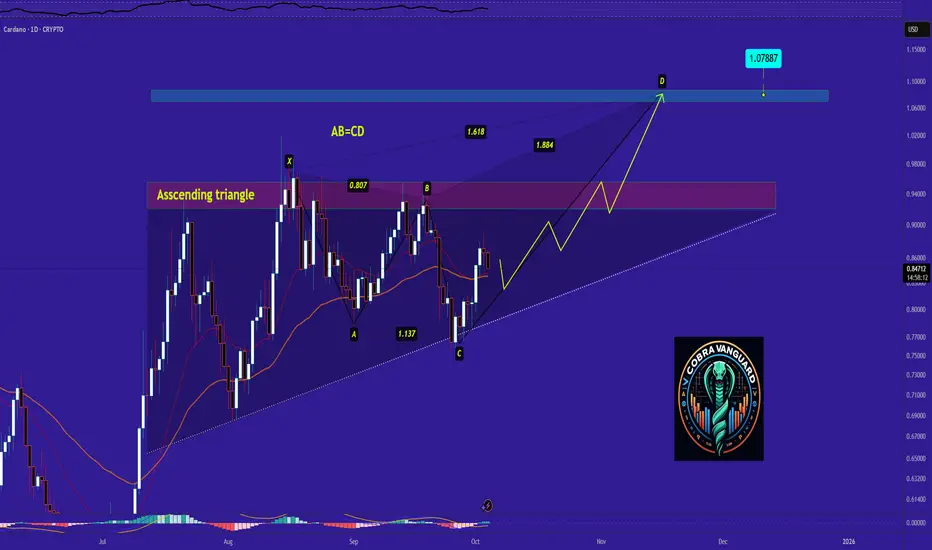
Cardano's situation+ Target PredictionCurrently, ADA is forming an ascending triangle, indicating a potential price increase. It is anticipated that the price could rise, aligning with the projected price movement (AB=CD).
However, it is crucial to wait for the triangle to break before taking any action.
Best regards CobraVanguard.💚
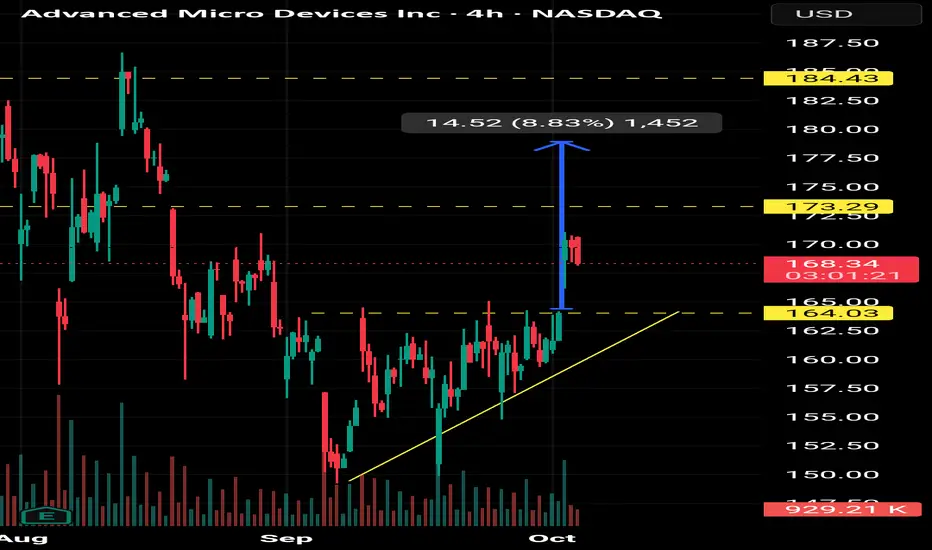
Ascending triangle breakout.Amd has bottomed at 150 and started trading in a ascending triangle with a 164 resistance.
Amd has broke the ascending triangle resistance and has now run to 171.
A retest of the ascending triangle breakout is possible. So dont worry if it drops back to 164. Its a buy signal if it does.
The ascending triangle pattern target is 180. But could probally run to 183-185 resistance.
#GOLD, Focus on the retest supportHello trades
I focus on the consolidation rang of 3863.8-3838
Resistance levels: 3863.8-3900
Support levels:3855-3838-3824
Thank you
