Technical Analysis - KAMINO/USDT (1H)
The asset is in a consolidation zone between the highlighted support and resistance levels, with the price reacting close to $0.115 after a fall.
If it breaks $0.1232, it can seek $0.127 as the next target.
If it loses $0.1131, the price can fall to $0.108, key support.
⚠️ It is recommended to observe the behavior of the RSI and MACD to confirm the trend before new entries. 🚀
Support: $0.1131 / $0.108
Resistance: $0.1232 / $0.127
RSI: Indicates selling momentum, suggesting weakness in the short term.
MACD: Indicates buying momentum, pointing to a possible reversal or continuation of the rise. Kamino is a DeFi protocol that automates liquidity provisioning strategies on decentralized exchanges (DEXs), optimizing returns for users. It offers solutions such as:
Concentrated Liquidity Automation: Automatically adjusts liquidity positions to maximize returns.
Rewards Reinvestment: Generated rewards are automatically reinvested, increasing total returns.
Ease of Use: Allows users to provide liquidity without the need for constant monitoring.
Kamino's focus is to simplify the process of generating passive income in DeFi, making it accessible to all levels of investors. 🚀
Ulianov

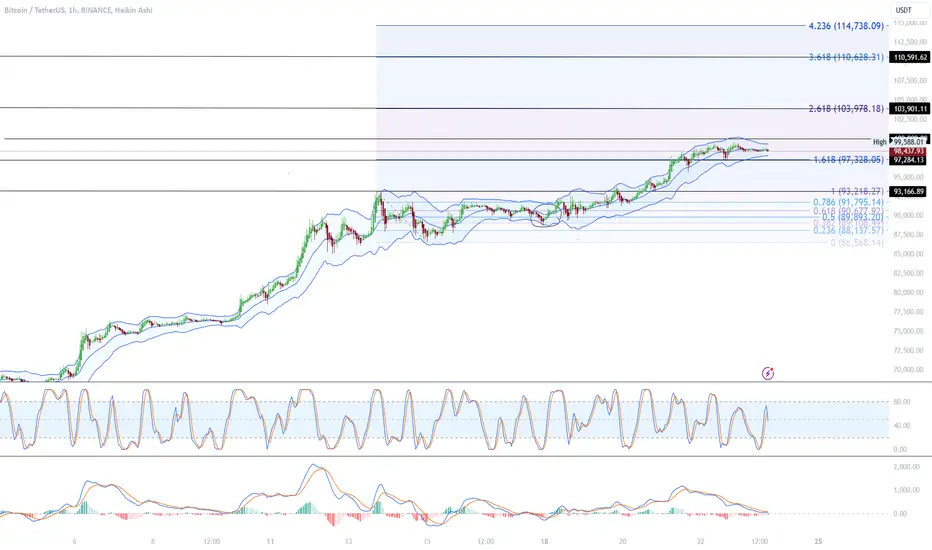
BTCUSDT - Altseason Gains Momentum as Dominance Drops!Bitcoin is facing significant psychological resistance in the $100,000 area, with the chart showing signs of consolidation just below this mark, indicating that the market is waiting for a catalyst to break out or pull back.
BTC dominance, which recently fell from 58%, reflects a possible rotation of capital into altcoins, suggesting the beginning of an altseason. During such periods, altcoins tend to see significant gains against BTC, especially if Bitcoin continues to range below resistance.
In the short term, Fibonacci points to levels like $97,000 and $93,000 acting as support, while a break above $100,000 could pave the way for targets like $103,000 and $110,000. The Stochastic RSI is hovering near the overbought region, indicating a possible correction before a new high.
"ORAI/USDT: Spike Phenomenon"The "spiking" on the chart is usually caused by a burst of volume, usually due to the market having few active sellers, large purchases that can quickly drive the price higher, or traders taking advantage of the volatility to take quick profits.
This movement is usually followed by corrections or consolidations. If the support at $9,650 holds, ORAI could attempt a new high. However, it is important to monitor volumes and news to identify whether the movement was purely speculative or fundamentally driven.
Resistance:
$11,829
$13,846
Support:
$9,650
$8,778

"SUI : Strategic Supports and Resistances on the radarIn the short term, the token could face resistance near $3.69, with significant support at $3.41. If the overall market shows strength, there is potential to test $3.85. The RSI appears to be close to the upper bound, suggesting a potential reversal in the short term.
Support:
$3.4160: A relevant level where the price has previously tested and found support.
$3.1060: Stronger support in case of a sharper decline.
Resistance:
$3.6921: A level close to local resistance, which the price has tested several times without breaking through.
$3.8519: Higher resistance, which could be challenged in case of increased buying strength.
SUI is the native token of the Sui blockchain, which is a layer-1 platform focused on scalability and performance. Developed by Mysten Labs, it uses a parallel execution model, making it efficient for decentralized applications (dApps) and NFTs.
Token Functions:
Transaction Fees: Used to pay fees on the network.
Staking: Participation in network validations.
Governance: Holders can participate in network decisions

"ETH/USDT 1H: Sideways with an Eye on the 200 Moving Average"ETH is now in a consolidation phase, sideways movements. The 200 MM is just above it, ETHUSDT often gravitates towards the 200 MM, so there is a possible upward movement in search of the 200 MM, the MACD intensifies the probability of an increase since it shows a bullish crossover, on the other hand the RSI is in an overbought condition, signaling a possible exhaustion of buying forces.
Let's see how everything will unfold!
If ETH breaks the resistance of $2436, it will go in search of the 200 MM at $2475. Now if it goes in a bearish direction and breaks $2387, then it only stops at 2352.
Bigger movements are expected at the opening of NASDAQ futures at the end of the day!

FLOKI/USDT bearish trend consolidatedFLOKI/USDT entered a bearish trend after peaking at 0.0001747 USDT. Since then, the price has started a corrective movement, breaking below the exponential moving averages (EMAs) and entering a descending channel.
Although the indicators are showing weakness in the selling pressure, there are no clear signs of a reversal yet.
To initiate a bearish trend reversal, the price would need to break the dynamic resistance of the descending trendline and sustain above the EMA Ribbon. A break above 0.00014884 USDT would be an important signal that buying pressure is returning to the market.
In addition, the MACD would need to cross upwards and the Stochastic RSI would need to enter the overbought zone to confirm a trend change.
Let's wait for the next few hours.
Supports: 0.0001253 / 0.0001174
Resistances: 0.0001398 / 0.0001448

SUI/USDT UptrendSUI/USDT is currently in an uptrend, supported by the ascending trendline and EMAs.
SUI is currently in a consolidation phase above the EMAs (Exponential Moving Averages), which have been acting as strong support. The MACD is showing signs of consolidation. The MACD lines are getting closer, suggesting a possible bullish crossover. The histogram, with bars close to zero, reinforces that the market is in a moment of indecision. It is important to wait for a clear MACD crossover to confirm a new direction.
Support: 1.8125 / 1.7204
Resistance: 1.9341 / 2.0125

ZRO breaks the descending channel?ZRO/USDT is currently in a downtrend, consolidated by the presence of the descending channel. The Stochastic RSI suggests a possible short-term correction, but caution is needed as the MACD still shows selling pressure.
For a reversal, it is important to break the resistance at 4,354 USDT. In the meantime, we should keep an eye on the support levels at 4,004 USDT and 4,108 USDT for potential entry or profit-taking opportunities.
Support: 4,348 / 3,788
Resistance: 4,354 / 4,506

VETUSDT : VeChain Breaks Out of Descending Trendline
VeChain is currently at a critical point, showing signs of potential upward movement and a strong support base. The chart indicates a recent upward trend following a prolonged decline.
Resistances and Support:
Resistance I: Around $0.02850, where the price might face difficulties breaking through.
Resistance II: Near $0.03355.
Support: Located at $0.02037, an important level that could hold the price in case of a decline.
The Stochastic RSI shows that VET is currently in an overbought zone, which could indicate a possible short-term correction.
Fibonacci levels suggest potential areas of support and resistance. The 0.618 level at $0.04772 is particularly important for the continuation of the upward trend.
VeChain has stood out with strategic partnerships including companies like BMW, Walmart China, and major telecommunications operators such as AT&T, T-Mobile, and Verizon. These partnerships are focused on areas such as supply chain tracking, food safety, and preparation for 5G networks (Crypto News Flash).
Recently, analysts predicted significant upside potential for VET, with estimates that the price could reach $1.80 by October 2024, based on detailed Fibonacci analysis and other technical indicators. VeChain has also launched important technological products such as the VeWorld Mobile wallet and the VORJ digital asset platform, promoting the adoption of Web3 technology

OTHERS.D - "V" recoveryAt this moment the "V" recovery suggests a strong buying impulse, but it is necessary to monitor resistance levels to confirm whether this recovery can be sustained, it should exceed 10.34%. Overcoming will we start the expected altseason??
The OTHERS.D chart represents the market dominance of altcoins, which are all cryptocurrencies excluding the top ten by market capitalization.
This chart shows the percentage of the total market cap of altcoins in relation to the total value of all cryptocurrencies, indicating the relative strength of altcoins in the crypto market.
The chart shows a descending trendline (marked in orange), indicating a series of lower highs. This line acts as a dynamic resistance.
The "V" recovery is visible on the chart, where the price falls sharply (forming the first leg of the "V") and then rises equally quickly (forming the second leg of the "V"). This is a reversal pattern characterized by a quick and strong recovery after a sharp decline.
The rapid drop indicates a massive sell-off, followed by a quick recovery, which suggests a sudden return of buyer interest.

Kaspa - daily chartKaspa - daily chart: The ascending triangle is getting clearer.
The chart suggests a bullish structure with the formation of an ascending triangle. At the bottom of the chart it shows a stochastic oscillator that is currently at low levels (circled in orange), suggesting that the asset may be oversold and reinforcing the upward movement. If the price manages to break the resistance at 0.198027 USDT, it is We are likely to see a continuation of the uptrend.
On the other hand, the loss of the ascending trendline could signal a possible reversal.
NextSupports: 0.1486 / 0.1351
Next Resistances: 0.1767 / 0.1934

ZIL/USDT 1H 1HZIL/USDT 1H
If the price holds above the 0.01764 support level and breaks the 0.01823 and 0.01835 resistance, we could see a continuation of the uptrend. However, if the price falls below support, especially 0.01725, we could be looking at a deeper correction, as on the one hand, the RSI suggests that the market may be overbought, which could indicate a correction soon. On the other hand, the MACD shows a buying momentum, suggesting that the uptrend may continue.
Without a doubt, Zilliqa's main innovation is Sharding. By using sharding, Zilliqa divides its network into several smaller parts, called shards, that process transactions and smart contracts in parallel. This allows the blockchain to achieve a high number of transactions per second (TPS) as the network grows, a crucial aspect for scalability.
Good end of the week
🔸Main support levels: 0.01764/ 0.01725
🔸Main Resistance Levels: 0.01823 / 0.01835
➡️RSI: Exhaustion of forces BUYERS
➡️MACD: Buyer
Symbol: ZIL
Maximum supply: 21,000,000,000 ZIL
Consensus: Proof of Work
Released in: 2018
Official website: www.zilliqa.com

BANUSWBNB 1HWe are currently observing an accumulative triangle formation in the BANUS/WBNB pair. The BANUS coin currently sits on the bottom edge of this triangle. This formation often suggests that investors are waiting for some market trigger or direction before deciding on the next trend.
With an RSI set at 3.7, we notice an exhaustion of selling forces. This could signal a potential trend reversal or at least a respite in selling pressure.
BANUS has a marked deflationary characteristic. With 50% of the fees generated on DEX BANUS being allocated to buyback and subsequent burning of the coin, there is a systematic decrease in the total supply. This mechanism can, over time, exert positive pressure on the price as supply decreases and, presumably, demand remains stable or increases.
The news of BANUS' imminent listing on a Dubai exchange is promising. This can significantly increase your visibility and attractiveness to new investors, especially those in the Middle East looking to diversify their crypto portfolios.

DOTUSDT 1HDOT/USDT
Watching these levels can be useful to identify potential entry points: it is currently showing supports at 5,162 and 5,119. This indicates that these are the price levels at which buying pressure has historically entered and reversed a downward trend.
Considered short-term targets or points to consider taking profits:
On the resistance side, we see hurdles at 5,238 and 5,258.
The MACD , a trend-following indicator that shows momentum, is pointing down. This can indicate a downtrend or a loss of momentum in the uptrend.
The RSI , an indicator of momentum, shows exhaustion of selling forces. This could suggest that price action may start to reverse into an uptrend if there are no more bears to push the price lower.
The Chop indicator is at 43.17 which is below 50 which is generally considered a trending market. So, although there is some degree of consolidation, the price is still moving significantly.
Given the "needle" move (a quick downward price move followed by an equally quick rebound) it is possible that price action is bouncing back, these moves are quite common on Sundays in the cryptocurrency market.

MATICBTC 1DSupports for MATIC/BTC are at 0.00002231 and 0.00001913. These are the levels at which there has been a significant amount of buying in the past, providing a kind of "safety net" for the price.
Resistances are situated at 0.00002867 and 0.00003003. These are the levels at which sellers have historically entered the market and prevented price appreciation.
An important additional observation is the breakout of the bearish channel. This is often seen as a bullish signal, indicating that the downtrend may be over and a new uptrend may be starting.
Fundamental Analysis of the MATIC/BTC pair:
Polygon (MATIC) is a Layer 2 solution for Ethereum that aims to improve its scalability and speed. It has seen rapid growth and adoption because of Ethereum's gas fee and transaction speed issues.
MATIC offers a solution to these problems and has a growing list of projects choosing to build on it, which adds to its strong foundation. However, its valuation against Bitcoin will depend on the market's perception of its technological progress and the general demand for scalability solutions.
In conclusion, technical analysis suggests bullish potential due to the breakout of the bearish channel, although the RSI suggests that the market may be overbought. MATIC's fundamentals are solid, with many projects choosing to build on top of Polygon, indicating that it could be a good option for long-term holding. However, it is important to conduct your own research and consult a financial professional before making any investment decisions.

RUNEBTC 1HThe given bearers for the RUNE/BTC pair are 0.0000281 and 0.0000252. These are the levels where prices have had a hard time falling in the past. This means that these levels can be considered 'floors' or 'barriers', where the fall in price can slow down or be stopped.
The resistances are at 0.0000359 and 0.0000437. These are levels that prices have struggled to break through in the past. Thus, these can be seen as 'ceilings' or 'barriers' where price rises can slow down or be stopped.
Considering the RSI (Relative Strength Index), there is an exhaustion of purchasing forces. This is usually a sign that the market may be overbought and that a correction or even a trend reversal may be in the offing. The combination of these technical factors could indicate a downward movement in the pair in the short term.
Thorchain (RUNE) is a cross-chain solution that allows the exchange of cryptocurrency assets on different blockchains. Additionally, Thorchain allows users to earn interest on their cryptocurrency assets by providing liquidity, which adds an additional incentive for holding RUNE.

EGLDBNB 1DEGLDBNB left its accumulative zone and is now above the Ichimoku level, which gives it a lot of lightness to reach its target. The only resistance is the median of the Keltner channel at 0.1930. and on the other hand its support is at 0.1710. Good prognosis for EGLDBNB.

LDOISDT 1D/15MLdo test support once again. we await the upward break, since the ATH, on May 9, 2022, has already corrected 62.16% to date.
Technical factors such as the RSI point up, which reinforces the ascendancy on the daily.
At 15M your immediate support is $1,480 and your resistances are $1,509 and $1,523. Pay attention to the proximity of cloud cloudiness, which can also be a resistance to the asset.
Lido DAO is one of the most popular platforms for staking ETH as the ease of not needing 32 ETH to staking makes it very popular. and LDO is Lido DAO's governance token that facilitates the staking platform's goal of building a staking service.
