The Strategic Rise of the RenminbiAgainst a backdrop of economic headwinds, the Chinese renminbi is defying market logic. We analyze the geopolitical, strategic, and industrial drivers powering the currency’s 2025 ascent.
A Currency Defying Headwinds
In 2025, the **USD/CNY** exchange rate has shifted significantly, with the renminbi posting a nearly 3% annual gain against the dollar. This performance stands in stark contrast to the 5% depreciation seen during the 2018 trade tensions. What makes this valuation remarkable is the severe disconnect from traditional macroeconomic fundamentals. China currently faces weak domestic consumption, record-low interest rates, and a massive $281 billion capital account deficit.
Typically, such indicators would trigger a sell-off. Yet, the currency has appreciated. This divergence points to a singular, powerful causal force: tight, strategic state management by the People’s Bank of China (PBoC). Beijing is prioritizing stability over market freedom to project economic resilience.
Geostrategy: The 15th Five-Year Plan
The controlled rise of the renminbi is not accidental; it is a calculated geostrategic move. The **15th Five-Year Plan**, released in October 2025, signals a major pivot in Beijing's approach to global finance. The document omits previous cautious language like "prudently promote," replacing it with assertive directives for currency internationalization.
Market analysts interpret this as a clear signal: currency strength is now a central policy goal. By engineering a stable rise, China aims to mirror its strategy during the 1998 Asian Financial Crisis. The goal is to establish the renminbi as a regional anchor and a reliable store of value, countering the dominance of the US dollar.
Management & Leadership: The PBoC’s Aggressive Defense
Central bank leadership has deployed a sophisticated "reference rate strategy" to guide the market. Since November 2024, the PBoC has consistently set the daily midpoint rate significantly higher than market forecasts. The average spread between the PBoC’s fix and market expectations has reached 327 basis points—an historically high gap.
This is a masterclass in market signaling. By aggressively managing expectations, leadership creates a one-sided bet that deters speculative short-selling. This proactive management forces market participants to align with state objectives rather than economic fundamentals.
Business Models: State Banks as Market Makers
China’s unique financial business model allows for direct intervention through state-owned banks. These institutions have acted as proxies for the central bank, executing discreet USD sales and CNY purchases to cap volatility. This "engineered calm" has reduced the three-month volatility of the pair to near decade-lows.
The stability has altered corporate behavior. Exporters, previously hoarding dollars, are now unwinding holdings of over $1 trillion stored in domestic banks. This creates a self-reinforcing loop: state intervention stabilizes the price, and corporate flows then validate that price, generating real demand for the renminbi.
Innovation & Industry Trends: The High-Tech Backstop
While financial engineering plays a role, the renminbi’s strength is also underpinned by China’s evolving industrial base. The decline in low-margin manufacturing is being offset by a surge in high-tech exports. Trade competitiveness remains robust despite currency appreciation.
This resilience is rooted in the country's pivot to high-value sectors like electric vehicles, green energy, and advanced machinery. Patent analysis of Chinese firms reveals a massive accumulation of IP in these domains. This technological leverage allows Chinese exporters to absorb exchange rate costs better than their low-tech predecessors, sustaining the trade surplus.
Cyber Finance & Global Adoption
The strategy is yielding tangible results in global markets. Daily trading volume in the CNY–USD pair has surged 60% to $781 billion. The renminbi now accounts for over 8% of global FX turnover.
This growth is driven by institutional investors and central banks diversifying their reserves. China is leveraging this trend by integrating the renminbi into cross-border digital payment systems. This "Cyber Finance" approach bypasses traditional SWIFT rails, further insulating the currency from geopolitical sanctions and US dollar liquidity crunches.
Conclusion: A Political Asset
The 2025 rise of the renminbi is a political project as much as an economic one. It challenges the standard "Impossible Trinity" of economics by maintaining a stable exchange rate and independent monetary policy through strict capital controls. For global investors, the message is clear: the PBoC will prioritize currency strength as a tool of soft power, regardless of domestic economic pain.
Uschina

Soybeans Surge on Thin Ice: Lessons from 2019Soybean prices have surged nearly 8% in two weeks, driven by renewed US-China trade tensions. While this looks like a familiar, event-driven rally, the fundamentals tell a different story.
Conflicting Weak Fundamentals
China has not purchased any US soybeans for the 2025/26 marketing year. In 2024/25, Chinese buying stalled after May. That’s unusual given that the prior year saw over 500,000 tons of late-season sales. The slowdown dropped China’s share of total US soybean commitments to 45% from 55%, the lowest since 2018.
Source – Reuters
That matters because 2018 marked the last time soybeans became a trade weapon. Back then, US soybean exports fell 18% from 2017/18 to 2018/19 despite record production. Exports recovered briefly in 2020-21 but have since declined again. If history rhymes, the 2025 conflict could have longer-term consequences for US producers and exporters.
The puzzle is that prices have climbed despite worsening fundamentals. Futures rose after the latest escalation, hinting that traders may be pricing in an eventual resolution. If tensions ease before the seasonal export peak over the next two months, demand could lift prices further. If not, the current rally may prove unsustainable. The key uncertainty lies in timing - whether a diplomatic thaw comes soon enough to coincide with US export strength.
Source – Kansas City Fed
Performance and Parallels with 2019
The structure of this year’s rally mirrors the 2019 pattern. Then, too, optimism around US-China negotiations drove soybean futures higher. On 13 December 2019, as the Phase-One trade deal was announced, CBOT soybean futures rallied about 9.8% for the month. That uptrend persisted until the onset of COVID-19, which derailed demand and disrupted logistics, preventing the expected rebound in US exports.
The technical setup also echoes that period. In both 2019 and 2025, the Relative Strength Index (RSI) crossed into overbought territory above 70-a rare signal under normal conditions. Between 2020 and 2022, RSI readings were inflated by one-off global shocks. In contrast, the 2019 and 2025 spikes both stem from optimism around de-escalation, underscoring how trade détente tends to trigger strong momentum buying.
Today, market sentiment again hinges on reports that China may resume US soybean purchases. Investors are reacting to statements and commentary including remarks from industry figures suggesting Beijing could pivot back toward US supply as signs that tariffs or import restrictions may soften. If these expectations materialize, the rally could extend into early 2026, though the fundamental picture remains weak.
Historical Trade Example
To illustrate how optimism-driven price spikes have historically translated into trade outcomes, consider the 2019 example.
A trader buying one CBOT soybean futures contract (5,000 bushels) at $8.70 per bushel in early December and exiting at $9.50 in early January would have captured a 9% gain.
Entry: 870 cents/bushel
Exit: 950 cents/bushel
Profit/Loss: 80 cents/bushel = USD 0.8/bushel
Each contract of Soybean futures provides exposure to 5000 bushels:
Profit/Loss per Contract = 0.8 x 5000 = USD 4,000
Traders can express the same view using CME Micro Soybean Futures, which provide exposure to one-tenth of the standard contract’s notional value and require lower margin.
The 2025 setup resembles that pattern. If de-escalation signs strengthen into year-end, a similar short-term momentum trade could play out. However, if diplomatic talks stall or China delays purchases, prices could quickly retrace.
The recent rally has also occurred on low trading volume, with limited activity during the upward move and higher volume concentrated near resistance levels. Additionally, the price action around these resistance levels shows long wicks, suggesting a failed breakout and indicating weak momentum.
In essence, this rally is speculative optimism priced into a weak fundamental base. For traders, it is a short-duration opportunity with defined risk: the thesis hinges on improved trade headlines within the next two months. For producers and longer-term investors, the focus should remain on export commitments and Chinese buying patterns rather than short-lived technical surges.
History suggests that while geopolitical relief rallies can deliver sharp gains, they often fade once the narrative loses momentum. The 2025 soybean rally may yet prove another example of that cycle - strong on hope, but fragile on fundamentals.
This content is sponsored.
MARKET DATA
CME Real-time Market Data helps identify trading set-ups and express market views better. If you have futures in your trading portfolio, you can check out on CME Group data plans available that suit your trading needs tradingview.com/cme .
DISCLAIMER
This case study is for educational purposes only and does not constitute investment recommendations or advice. Nor are they used to promote any specific products, or services.
Trading or investment ideas cited here are for illustration only, as an integral part of a case study to demonstrate the fundamental concepts in risk management or trading under the market scenarios being discussed. Please read the FULL DISCLAIMER the link to which is provided in our profile description.

GBPJPY Eyes 203.000 as Risk-On Mood Weakens YenHey Traders,
In tomorrow’s trading session, we’re monitoring GBPJPY for a buying opportunity around the 203.000 zone. The pair remains in a broader uptrend and is currently in a correction phase, approaching the 203.000 support and resistance area, which aligns with the prevailing trend structure.
On the fundamental side, easing tensions between the US and China are fueling a risk-on environment, typically leading to weaker demand for safe-haven assets like the JPY. This sentiment shift could support further upside in GBPJPY if buyers step in at this level.
Trade safe,
Joe

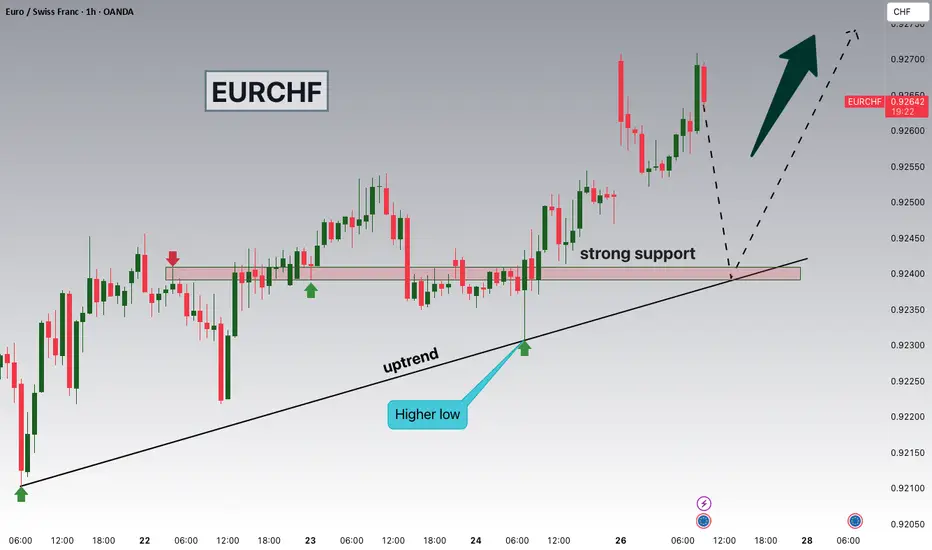
EURCHF Watching 0.92400 as Risk-On Mood Pressures Safe HavensHey Traders, in today’s trading session we’re monitoring EURCHF for a potential buying opportunity around the 0.92400 zone.
The pair remains in an overall uptrend, and price is now in a correction phase, approaching the trendline confluence and key support area near 0.92400.
Structure: EURCHF continues to form higher lows within the broader bullish channel. A successful hold above 0.92400 could signal continuation toward previous highs.
Fundamentals: The recent US–China de-escalation has improved global risk sentiment, leading markets into a risk-on mode. As investors rotate out of safe-haven assets like CHF and JPY, the Euro could gain further ground.
Next move: Watching how price behaves around 0.92400 for potential bullish continuation signals.
💬 What’s your take on the CHF weakness amid improving risk appetite? Share your thoughts below!
Is Geopolitical Re-Alignment the New AUD Catalyst?The Australian Dollar's (AUD) sharp surge against the US Dollar (USD) is driven by a powerful synergy of geopolitical de-escalation and structural economic realignment. Near-term momentum stems from optimism surrounding an imminent US-China trade deal. As a primary commodity exporter and a financial 'China proxy', Australia's currency benefits directly from reduced Sino-American trade tensions, prompting a global "risk-on" rally that lifted commodity prices and commodity-linked currencies. Simultaneously, softer-than-expected US inflation data has amplified expectations for a Federal Reserve rate cut in December, weakening the USD by narrowing the interest rate differential in favor of the Aussie.
Structurally, the AUD gains foundational strength from a landmark $8.5 billion US-Australia Critical Minerals Agreement. This strategic pact, targeting vital rare-earth elements, aims to secure a Western supply chain for high-tech and defense industries, directly countering China's resource dominance. The joint commitment of over $1 billion in near-term investment into Australian mining and processing facilities introduces significant foreign capital and long-term economic diversification. This geostrategic pivot transforms Australia into a key node in the non-Chinese supply of materials essential for the global clean energy transition and advanced cyber systems, moving the AUD beyond purely cyclical commodity flows.
In essence, the $AUD/USD rally is a dual narrative: a cyclical uplift from cooling trade wars and a structural upgrade from a new science and technology alliance with the US. While markets await specific details from the upcoming high-level trade talks and the Federal Reserve's next move, this combination of favorable macroeconomic divergence and a foundational critical minerals investment provides a robust, multi-domain argument for sustained Australian Dollar strength.
US vs China: should we be worried?Another ''Buy the rumor''? What EVERY trader should have in mind amid US-China Trade talks:
1. Beijing balks at enforcement or verification terms
China could reject U.S.‑demanded mechanisms for monitoring compliance, such as agricultural purchase tracking or fentanyl control checkpoints.
Past talks collapsed over the same issue, the U.S. insisting on verification, China citing sovereignty .
If Beijing signals “framework only, no enforcement,” Washington may treat it as stalling and re‑activate the 155 % tariff threat for Nov 1 .
2. Rare‑earth or tech export retaliation
China still holds leverage through critical‑mineral exports. If it re‑tightens rare‑earth or semiconductor‑material shipments, Washington could impose new export controls on Chinese tech, reigniting escalation.
That “supply‑chain weaponization” was what caused the early‑October market sell‑off and would likely repeat—hurting metals, EV, and chip stocks first.
3. Unexpected Trump pivot under political pressure
Analysts warn that Trump tends to shift abruptly when domestic optics change.
A new social‑media statement accusing Beijing of backsliding could nullify the deal narrative overnight .
Morgan Stanley’s Mike Wilson noted that any such reversal could trigger a 10–15 % equity correction due to “positioning unwind and tariff risk repricing” .
4. National‑security or Taiwan language slips
The framework explicitly avoids defense issues, but if Trump or Xi reference Taiwan or South China Sea policy during press remarks, it could politicize the summit and freeze trade clauses .
5. Market complacency and over‑positioning
Even with a signed “mini‑deal,” markets may have already priced it in.
JPMorgan research warns that a “buy‑the‑rumor, sell‑the‑news” reaction is likely if investors had pre‑emptively rotated into cyclicals .
Thin liquidity plus leveraged optimism could amplify any disappointment.
Bottom line:
Unless both leaders explicitly confirm a tariff suspension and avoid new geopolitical flashpoints, markets remain only one headline away from reversal. The biggest red flags to watch this week are (1) a stalled verification clause, (2) talk of renewed tech or rare‑earth restrictions, or (3) Trump implying that tariffs will still “go forward pending review.” Any of these could instantly shift sentiment from optimism to a fresh wave of selling.
#trade #correction #economy #finance #us #china #tariff #bitcoin #crypto #stocks #equities #trading

Gold Testing 4,210 Support as Bulls Eye Another Leg HigherHey Traders, in today’s session we’re keeping a close watch on XAUUSD for a potential buying opportunity around the 4,210 zone. Gold continues to trade within a broader uptrend, and the current pullback appears to be a healthy correction toward a key support and resistance confluence at 4,210.
Market structure:
Momentum remains bullish, with price forming higher highs and higher lows. The ongoing correction could provide a trend-continuation entry if buyers step in near support.
Key level:
4,210 — a decisive zone where previous reactions have sparked renewed buying interest.
Outlook:
A sustained bid from this area could pave the way for another push toward 4,300 and beyond, keeping Gold aligned with its dominant bullish trajectory.
Trade safe,
Joe.

USDJPY Rally Faces Pressure Near 151.250 on Safe-Haven FlowsHey Traders, in the coming week we’re monitoring USDJPY for a selling opportunity around the 151.250 zone.
The pair remains in a broader downtrend, currently in a corrective phase as it approaches this key resistance level.
Meanwhile, DXY is also correcting within its own downtrend, approaching resistance near 98.600, which reinforces the bearish bias on USD pairs.
With US–China tensions escalating, we’re seeing renewed safe-haven demand for JPY, potentially setting the stage for another leg lower in USDJPY.
Trade safe,
Joe

US30 Eyes 46,600 Resistance as Correction Extends Within TrendHey Traders, in tomorrow’s trading session we are monitoring US30 for a potential selling opportunity around the 46,600 zone. The Dow Jones remains in a broader downtrend and is currently in a corrective phase, approaching a key resistance level aligned with the descending trendline.
Structure:
Price continues to form lower highs and lower lows, indicating persistent bearish momentum. The ongoing pullback toward 46,600 could offer a potential continuation setup in line with the prevailing downtrend.
Key level in focus:
46,600 — a significant resistance zone and trendline confluence area where sellers have previously regained control.
Fundamentals:
Market sentiment remains fragile as uncertainty over US fiscal policy and geopolitical risks weigh on risk assets, supporting potential downside pressure on the Dow.
Next move:
Watching for bearish confirmation signals near 46,600 — a rejection from this zone could open the door for a continuation toward recent lows.
Trade safe,
Joe.

Gold Near 4,280 as US–China Tensions Fuel Flight to Safety!Hey Traders,
In today’s session, we’re monitoring XAUUSD for a buying opportunity around the 4,280 zone. Gold remains in a strong uptrend, with price currently correcting toward a key structural support area where buyers may look to re-enter.
From a fundamental standpoint, rising US–China geopolitical tensions have pushed investors toward safe-haven assets. Market sentiment is tilting defensive, and Gold — already hovering near all-time highs — continues to reflect that global risk aversion.
A sustained bid above 4,280 could reinforce bullish momentum and potentially open the path toward new highs if uncertainty persists.
Key level: 4,280 (support / trend confluence)
Bias: Bullish while above this level
Trade safe,
Joe.

US–China Tensions Put Pressure on AUDJPY Near 98.600!!Hey Traders,
In today’s session, we’re closely watching AUDJPY as price approaches the 98.600 zone, aligning with a key resistance level within the broader downtrend. After a short-term corrective move higher, the pair now faces an area that has historically acted as a turning point for sellers.
From a fundamental perspective, global sentiment appears to be tilting toward risk aversion once again.
Ongoing US–China tensions have reignited geopolitical uncertainty, with markets increasingly pricing in the possibility of further escalation. In such an environment, high-beta currencies like the AUD tend to underperform, while safe-haven flows favor the JPY.
If risk sentiment deteriorates further, AUDJPY could see renewed downside momentum from this resistance region.
Key zone: 98.600 — confluence of structure resistance and trend alignment.
Bias: Bearish while below this level.
Trade safe,
Joe.

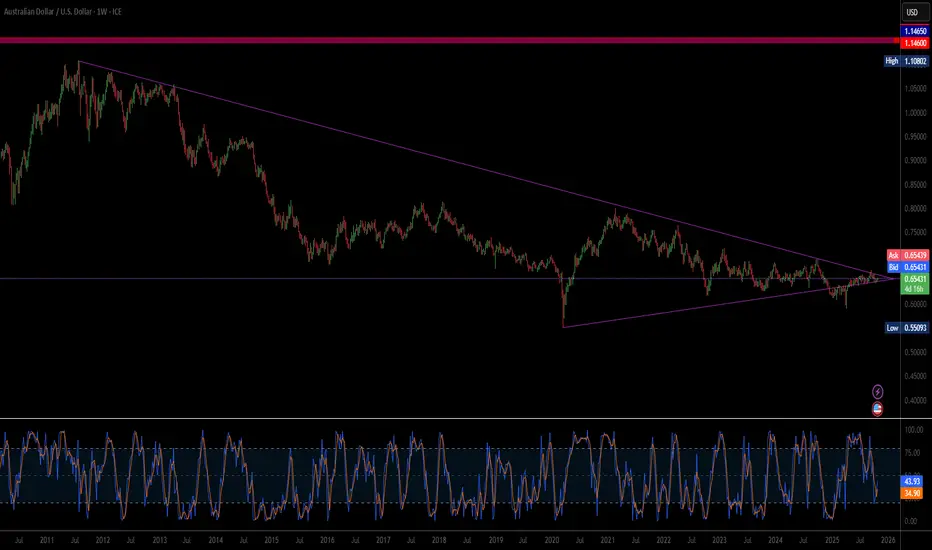
AUDUSD breakdown:Hidden oppportunity while Gold grabs headlines?While everyone's watching gold hit fresh records after Trump's China tariff threats, there's an overlooked opportunity in AUDUSD that could be setting up for a major breakdown.
The Australian dollar just broke key support at 0.6520 against the USD, creating a fundamental and technical alignment for further downside. With Australia sending 63% of its exports to China, any trade war escalation directly impacts the Aussie dollar.
Key Drivers:
Trade War Impact : Australia's heavy dependence on China makes AUD vulnerable to US-China trade war escalation
Technical Breakdown : Break below 0.6520 support with Fibonacci targets at 0.6443, 0.6311, and 0.6254
Dollar Strength : Government shutdown paradoxically supports USD strength by removing spending and debt payments from the equation
RSI Momentum : RSI shows room for further decline with potential head and shoulders pattern forming, targeting the neckline first
This macro/technical alignment presents a strong trading setup. When others chase gold headlines, smart traders can position for the AUD breakdown. Trade smart, respect the levels, and don't miss this overlooked opportunity.
This content is not directed to residents of the EU or UK. Any opinions, news, research, analyses, prices or other information contained on this website is provided as general market commentary and does not constitute investment advice. ThinkMarkets will not accept liability for any loss or damage including, without limitation, to any loss of profit which may arise directly or indirectly from use of or reliance on such information.

Forex pricing depending on TikTok Trade talks between the US and China are occurring this week, and a major topic of conversation could be how TikTok can be severed from its Chinese government and Chinese/ Hong Kong corporate interests.
How this plays out is could affect overall market sentiment in the U.S.–China trade relationship, which in turn could ripple through global risk assets. Forex pairs related to commodity exports or closely correlated with Chinese economic performance, like the Australian dollar (AUD), may see indirect effects.
AUD/USD is currently in an uptrend in the short‐term, trading within an ascending channel.
The latest candles show strong green closes with shallow pullbacks. That type of price action can indicates continuation rather than exhaustion, at least until the next key resistance zone.
Key resistance potentially lies at ~0.6687, with a more significant barrier at ~0.67485.
Support zones perhaps lie just below current prices: near the 9-day EMA. The 50-day EMA could provide a stronger support if the pair pulls back.

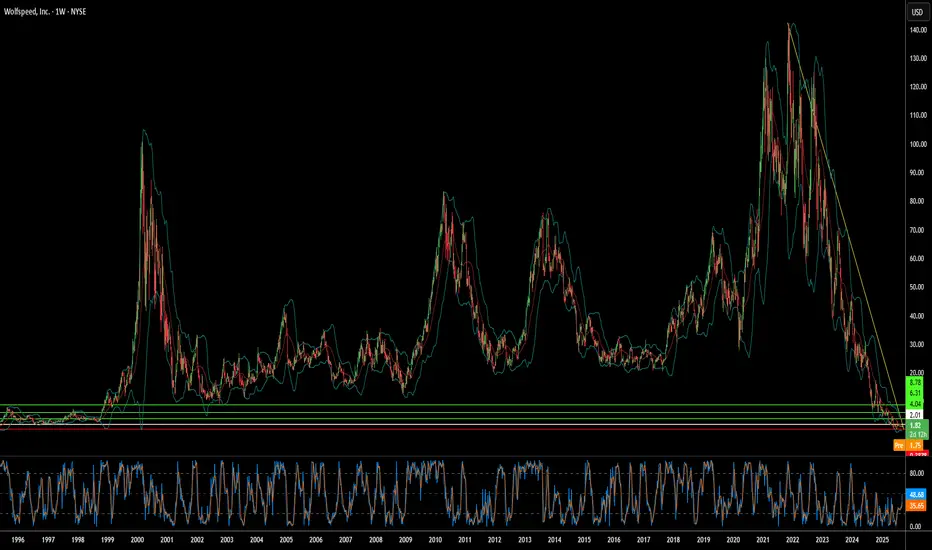
Can Silicon Carbide Save a Bankrupt Chip Giant?Wolfspeed's dramatic 60% stock surge following court approval of its Chapter 11 restructuring plan signals a potential turning point for the struggling semiconductor company. The bankruptcy resolution eliminates 70% of Wolfspeed's $6.5 billion debt burden and reduces interest obligations by 60%, freeing up billions in cash flow for operations and new fabrication facilities. With 97% creditor support backing the plan, investors appear confident that the financial overhang has been cleared, positioning the company for a cleaner emergence from bankruptcy.
The company's recovery prospects are bolstered by its leadership position in silicon carbide (SiC) technology, a critical component for electric vehicles and renewable energy systems. Wolfspeed's unique capability to produce 200mm SiC wafers at scale, combined with its vertically integrated supply chain and substantial patent portfolio, provides competitive advantages in a rapidly growing market. Global EV sales exceeded 17 million units in 2024, with projections of 20-30% annual growth, while each new electric vehicle requires more SiC chips for improved efficiency and faster charging capabilities.
Geopolitical factors further strengthen Wolfspeed's strategic position, with the U.S. CHIPS Act providing up to $750 million in funding for domestic SiC manufacturing capacity. As the U.S. government classifies silicon carbide as critical for national security and clean energy, Wolfspeed's fully domestic supply chain becomes increasingly valuable amid rising export controls and cybersecurity concerns. However, the company faces intensifying competition from well-funded Chinese rivals, including a new Wuhan facility capable of producing 360,000 SiC wafers annually.
Despite these favorable tailwinds, significant risks remain that could derail the recovery. Current shareholders face severe dilution, retaining only 3-5% of the restructured equity, while execution challenges persist regarding ramping the novel 200mm fabrication technology. The company continues operating at a loss with high enterprise value relative to current financial performance, and expanding global SiC capacity from competitors threatens to pressure pricing and market share. Wolfspeed's turnaround represents a high-stakes bet on whether technological leadership and strategic government support can overcome financial restructuring challenges in a competitive marketplace.
MARKETS week ahead: April 28– May 4Last week in the news
The market is currently perceiving that there is sort of relaxation in the US-China trade war. This was the major premise which boosted US equity markets. The S&P 500 gained around 4,6% on a weekly level. A positive market sentiment and short relaxation on uncertainty brought the price of gold lower by 2% on Friday, ending the week at the level of $3.318. On the same premise reacted the US Treasury bond market. The 10Y US benchmark closed the week lower, at the level of 4,25%. The crypto market was also part of the positive sentiment, as BTC managed to make a break-through from previous levels and reach levels above the $95K.
The US-China trade war continues, however, with a softener rhetoric, which brought market sentiment to the positive side. Still, it remains quite confusing, where the majority of analysts are not sure what the final deal would look like. Actually, it seems that nobody knows, even the US Administration. The latest comment from the US President on the topic is that eventually tariff rates will “come down substantially, but it won't be zero”. Also, the US President commented that he has no intention of “firing Powell”.
The Financial Times posted an article in which the journal noted that Apple was planning to shift all Iphones assembly to India. Analysts, involved in the matter, reacted to this news with arguments that such a move is highly questionable, both from the logistic side and from a tariffs side.
The federal Reserve withdraws crypto guidance for banks. The Federal Reserve revoked its 2022 and 2023 guidance that required banks to notify or get approval before engaging in crypto or stablecoin activities.
As Reuters reported during the previous week, based on six sources, the ECB is considering further cutting of its policy rates at the June meeting. The relaxing inflation and drop in the economic outlook ECB members see as a good reason to further decrease their reference interest rates.
China is targeting the supremacy in the AI industry and development in comparison to its US counterparts. As news reported, the China President Xi Jinping called during the previous week for a “self-reliance and self-strengthening” in China within artificial intelligence. This now represents a key strategic area for China when it comes to their US counterparts.
JPMorgan published the results of a survey among investors over their perception of the US economy in the future period. There has been a consensus on a high potential of stagflation, while the majority of participants perceive the weak US Dollar during this year. The major risk is coming from the ongoing trade war, which will have a negative impact on the US economy, as per survey.
Crypto market cap
The crypto market is in green again. After several weeks of struggling, the crypto market finally made its final break-through and increased the value of the total market capitalization. This move was supported by the relaxation of rhetoric of the US Administration in an US-China trade war. Total crypto market capitalization was increased by 10% on a weekly basis, increasing its total value by $262B. Daily trading volumes almost doubled from the week before, trading around $166B on a daily basis. Total crypto market increase from the beginning of this year, currently stands at -10%, with $318B outflow of funds.
The major coins which drew the total crypto market to the higher grounds was BTC. The coin added $183B to its market cap, increasing it by more than 10% on a weekly basis. ETH also performed well, with an weekly inflow of $ 23B, which increased its market cap by 12%. Other major coins also performed well during the week. Solana added $5,4B to its market cap, which was an increase of 7,5%. DOGE surged by 14,8%, adding $3,4B to its market cap. Among higher gainers was IOTA, with a surge in value of 27,3%, LINK was traded higher by 15%, Algorand gained around 19% w/w. The majority of other coins gained above 10% on a weekly basis. This week there were almost no losers on the crypto market.
As for coins in circulation, this week Polkadot and Filecoin added 0,6% of new coins to the market, same as EOS. Maker made a significant increase of 0,8% within a single week. Stablecoin Tether increased its number of coins by 1,7%, which was one of the highest increases for this stablecoin within this year.
Crypto futures market
The crypto futures market also reacted on a positive sentiment caused by relaxation in rhetoric regarding trade tariffs. BTC futures were traded higher by more than 12% for all maturities. The positive development is that the long term futures returned to the levels above the $100K. Futures maturing in December this year closed the week at $99.770, and those maturing a year later were last traded at $105.755.
Similar situation is also with ETH futures. Positive is that the long term maturities reached levels above the $2K. In this sense December 2026 was closed at price $2.043, while futures maturing in December this year were last traded at round $1,9K.

Why Did 3M Stock Soar Despite Tariff Clouds?Shares of industrial giant 3M Co. experienced a significant rally following the release of its first-quarter 2025 financial results. The surge was primarily driven by the company reporting adjusted earnings and total net sales that exceeded Wall Street's expectations. This performance signaled a stronger operational footing than analysts had anticipated.
The positive results stemmed from several key factors highlighted in the report. 3M demonstrated solid organic sales growth and achieved notable adjusted operating margin expansion. This margin improvement reflects the effectiveness of management's ongoing cost-cutting initiatives and strategic focus on operational efficiency, contributing directly to double-digit growth in earnings per share during the quarter.
While the company did warn about potential future impacts on 2025 profit due to rising global trade tensions and tariffs, management also detailed proactive strategies to mitigate these risks. Plans include supply chain adjustments, pricing actions, and leveraging their global manufacturing network, potentially increasing U.S. production. The company maintained its full-year adjusted earnings guidance, notably stating that this outlook already incorporates the anticipated tariff effects. Investors likely responded positively to the combination of strong quarterly performance and clear actions to address identified headwinds.

Chips Down: What Shadows Loom Over Nvidia's Path?While Nvidia remains a dominant force in the AI revolution, its stellar trajectory faces mounting geopolitical and supply chain pressures. Recent US export restrictions targeting its advanced H20 AI chip sales to China have resulted in a significant $5.5 billion charge and curtailed access to a crucial market. This action, stemming from national security concerns within the escalating US-China tech rivalry, highlights the direct financial and strategic risks confronting the semiconductor giant.
In response to this volatile environment, Nvidia is initiating a strategic diversification of its manufacturing footprint. The company is spearheading a massive investment initiative, potentially reaching $500 billion, to build AI infrastructure and chip production capabilities within the United States. This involves critical collaborations with partners like TSMC in Arizona, Foxconn in Texas, and other key players, aiming to enhance supply chain resilience and navigate the complexities of trade tensions and potential tariffs.
Despite these proactive steps, Nvidia's core operations remain heavily dependent on Taiwan Semiconductor Manufacturing Co. (TSMC) for producing its most advanced chips, primarily in Taiwan. This concentration exposes Nvidia to significant risk, particularly given the island's geopolitical sensitivity. A potential conflict disrupting TSMC's Taiwanese fabs could trigger a catastrophic global semiconductor shortage, halting Nvidia's production and causing severe economic repercussions worldwide, estimated in the trillions of dollars. Successfully navigating these intertwined market, supply chain, and geopolitical risks is the critical challenge defining Nvidia's path forward.

CNH: Hedging Currency Risk amid Heightened UncertaintiesCME: USD/Offshore RMB ( CME:CNH1! )
Even though the Chinese Yuan is not a component in the US Dollar Index, Dollar-Yuan exchange rate generally tracks the dollar index. If dollar gains in value, most foreign currencies depreciate against it, yuan included. When dollar is weakened, the opposite holds true. Foreign currencies appreciate relative to dollar.
However, this year the two trends diverged prominently. Dollar index was quoted 103.2 on Monday, down 0.8% year-to-date. Meanwhile, dollar/yuan rate moved up 5.2% to 7.26. A higher price quote means that yuan depreciated against the dollar.
In conventional thinking, yuan should have risen when dollar declined. The reversal of the trend could signal a major technical breakout down the road.
In the past ten years, the Yuan has been trading in the range of 6.0 and 7.3. looking back in early 2000s, the official exchange rate used to be set at a narrow band around 8.28.
Exchange Rate Key Driver: Interest Rate Parity
Let’s revisit a basic concept in economics. The interest rate parity (IRP) states that the interest rate differential between two countries is equal to the differential between the forward exchange rate and the spot exchange rate.
In plain English: An investor has the options of investing in either dollar or yuan. With higher interest rates, dollar asset will produce a higher return. To make yuan more attractive, the investor would need to get more yuan per dollar. Therefore, yuan will depreciate. This is the logic behind the IRP. It is called the Law of One Price.
Since the Federal Reserve began hiking interest rates in March 2022, the Fed Funds rate has risen 525 basis points in the following 17 months. At the same time, the People’s Bank of China cut interest rates by 15 basis points, from 3.70% to 3.55%.
• The US-China interest rate spread has widened by 540 basis points.
• If the investor held dollar denominated asset, his return would be 7.65% higher than someone holding the same asset denominated in yuan (=5.40% x (17/12) years).
• Meanwhile, the exchange rate went from 6.39 to 7.26, a 12.0% Yuan depreciation.
In this example, the IRP explains 64% of the total variation of Dollar/Yuan exchange rate. It is remarkable that fundamental economic theory works so well in the real world.
Relative Stock Market Performance
Another key factor driving capital flows in and out of China is the performance of its stock market relative to that of the global market.
China’s stock market had a good start this year. The hope of economic recovery pushed the Shanghai Stock Exchange (SSE) index up by 9%. However, economic data deteriorated markedly in the second quarter, which helped erase most of the gain.
• As of Monday, the SSE produced a meager 1.8% return YTD.
• For a comparison, the S&P was up 15.8% while the Nasdaq gained 37.8% YTD.
Relative Strength in the Economy
While interest rate spread and stock market performance drive the exchange rate trend in the short- to medium-term, the long-term value of one country’s currency is determined by the strength of its economy.
The US economy has so far managed to avoid a hard landing:
• Solid job market (unemployment rate below 4%);
• Strong GDP growth (the economy expanded from Q1 to Q2);
• Inflation getting under control (headline CPI around 3%);
• A banking crisis is contained (only a handful of bank failures);
• The debt ceiling crisis is resolved (new bill suspected the debt ceiling until 2025).
This year, China’s economic engine appeared to have lost steam.
• GDP growth slowed dramatically after a brief spike in Q1;
• Export declined by double digits;
• A gigantic housing market crisis is brewing to the boiling point;
• Debt crisis with provincial and local governments, many are technically bankrupt;
• High unemployment rates (youth unemployment exceeding 20%);
• Deflation discourages business activities and put further pressure on the economy.
Could the second largest economy in the world weather all the headwinds? This heightened risk profile warrants the need to proactively deploy risk management strategies.
Hedging for Currency Exposure Amid Rising Risk Outlooks
US-China relations remains the top geopolitical risk amid heightened uncertainties. In recent years, the relations have hit the lowest point since President Richard Nixon visited China in 1972.
While China now accounts for a smaller share of the US international trade, in 2022, both U.S. exports to China and imports from China continued to grow, according to the Bank of International Settlement data.
• U.S. exports totaled $153.8bn, an increase of 1.6% ($2.4bn) from 2021;
• U.S. imports from China totaled $536.8bn, an increase of 6.3% ($31.8bn);
• And the trade deficit with China was $382.9bn, an increase of 8.3% of ($29.4bn).
U.S. importers, exporters, and US companies operating in China all face significant risks when the exchange rate is so volatile. Some of the cost may be in one currency, while the revenue is in another. Hedging net currency exposure is key to locking in profit.
Where is the Dollar/Yuan Exchange Rate Heading?
In the previous sections, I highlighted the key drivers in the US/China currency exchange rate: relative interest rates; relative stock market performance; relative economic strength; and the state of the US-China relations.
If things are moving unfavorably for China, I could see the yuan breaking out of the recent range and going above 7.50. There are a lot of moving parts affecting the outcome.
CME Offshore RMB (CNH) is a futures contract on the Dollar/Yuan exchange rate. It has a notional value of $100,000 and is quoted as the number of Yuan per $1.
In a hypothetical case, let’s imagine that a commercial firm expects to receive 10 million yuan in six months. Should the exchange rate go from 7.26 to 7.60, the expected receipt in dollar terms would decline from $1.38M to $1.31M, down $70K or -4.7%.
The firm could hedge this exposure by buying 14 CNH contracts. The aggregate notional value is $1.4 million, matching over 10 million yuan at current market price. When yuan depreciates, futures price would go up as each dollar is getting more yuan. Therefore, when the firm loses money in business operation due to yuan depreciation, currency futures hedging would compensate for the losses.
Holding 1 CNH contract requires $21100 in minimum margin. If the exchange rate moves by 1 tick, or $0.0001, the futures account would gain or lose 10 Yuan.
A smaller firm could consider Micro RMB futures (MNH). It is 1/10 of the standard size CNH contract with a $10K notional. Margin requirement is 1/10 of the original, at $2110.
Happy Trading!
Disclaimers
*Trade ideas cited above are for illustration only, as an integral part of a case study to demonstrate the fundamental concepts in risk management under the market scenarios being discussed. They shall not be construed as investment recommendations or advice. Nor are they used to promote any specific products, or services.
CME Real-time Market Data help identify trade set-ups and express my market views. If you have futures in your trading portfolio, check out on CME Group data plans in TradingView that suit your trading needs www.tradingview.com

WTI (US-OIL) Ready to Open doors for Bulls !Trade Analysis Based on Fundamentals and Price Action.
With Risk Management You Will Never Loss.
Thank You.
Feel free to share Your View and Comments Below.


USDJPY: buy the rumor, sell the fact - possible scenarioI think the markets are pricing that the US-China Phase 1 deal is going to be signed, so the risk-off sentiment is still present. The idea of going short in USDJPY is based on a well-known phrase: buy the rumor, sell the fact (news).
Are we going to see the price going down? Who knows, but it's better to be prepared, if the price breaks the support zone around 109.3 price level it's decent to join bears with stop above 109.65 and profit around 108.4
(R:R=2.57)
//
Follow me to stay updated with my trading ideas.)

Trade conversations, US inflation and a tough day aheadTuesday in the news plan was noted by the information that the United States excluded China from the list of currency manipulators countries. This led to yet another sigh of relief among investors that already are in a rather relaxed on the eve of the signing of the documents on the first phase of the trade agreement between the US and China.
But at the same time, we did not see any significant development of the downward movement in the safe havens. This suggests that interest in the sale is beginning to decline. Plus, there was information about another attack on a military base in Iraq. So today we will continue to look for points for purchases of gold and the Japanese yen. We only note that in the first place we will not buy the yen against the dollar but against the euro.
And do not forget to put your feet. The signing of a trade agreement between the US and China will take place today, which may well provoke another round of sales of safe-haven assets. So those who adhere to more conservative trading today should stay away from gold and the Japanese yen.
Not that we were very worried about the growth of the dollar, but yesterday's data on consumer inflation turned out to be slightly lower than forecasts, which means we should not expect an increase in the Fed rate in current realities. And all the same, the percentage differential of the dollar-yen is several times higher than the differential of the euro-yen, so the sale of the EUR/JPY pair looks truer.
Interesting fact. By excluding China from the list of manipulating countries, the United States threatened to add Switzerland there. However, the franc did not bother him and he showed the strongest growth against the euro over the past few years.
Returning to yesterday's inflation statistics from the United States, we note that the probability of a rate hike in 2020 at the moment is 5%. But the chances of a decrease are about 55%. At the same time, some experts expect 3 more rate cuts in 2020. Against the backdrop of the Fed's aggression in the repo market, this does not seem to be something completely unbelievable. Which in turn makes the dollar vulnerable in the foreign exchange market.
The British pound is still a great candidate for purchases against the dollar. But today you should be careful. Since it will be published a large block of statistics on the UK, which includes consumer and industrial inflation. Recall that while the pound is above 1.2960 there is no threat to purchases. The departure of the pair below this mark is a signal for a temporary exit from positions and a rebound at the low of 1.28.

EURJPY Short IdeaHi everyone, here is a small idea I have: EURJPY Short.
JPY in my opinion is getting a little bit stronger considering the tensions that are a little bit rising with the US-China Trade War. Also, JPY has released some good numbers these past couple of days, like GDP, etc. so in my opinion JPY is Strong.
EUR in my opinion is a little bit neutral, I don't see anything good or very bad for them, so I would say EUR is neutral.
I am open to other opinions, so please comment if you have any other opinions or ideas on this trade.
