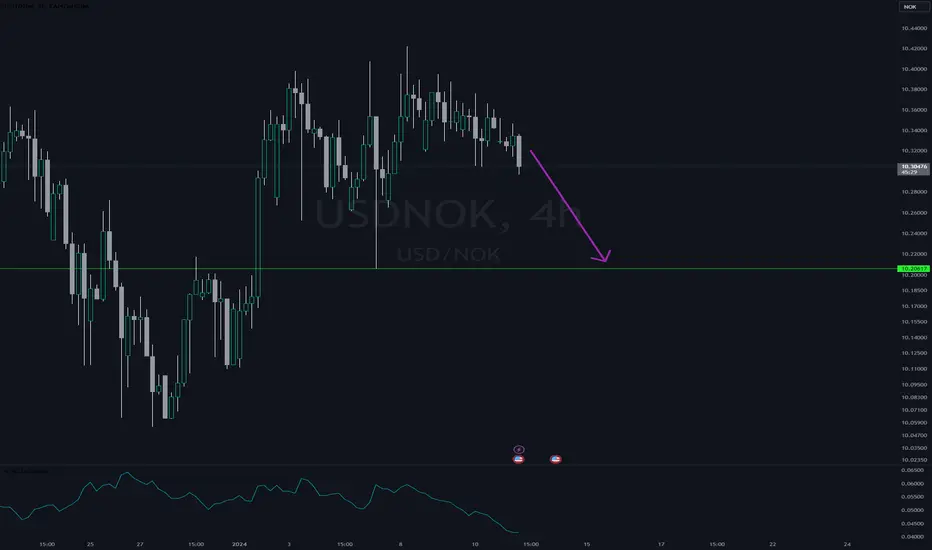
USDNOK: Wave (4) Correction In Play Before Wave (5) OccursUSDNOK has started a corrective phase after completing an impulsive intraday five-wave decline, which appears to represent wave A of a higher-degree ABC correction within wave (4).
Following the initial sell-off, the pair is expected to enter a corrective recovery phase in wave B. However, once this rebound matures, another decline in wave C could unfold, completing the broader wave (4) correction.
The ideal support area for the next downside move is located around the former wave 4 swing lows
USDNOK
USDNOK Completes A Corrective RecoveryUSDNOK Completes A Corrective Recovery that can resume its bearish trend from a technical point of view and from Elliott wave perspective.
USDNOK made some recovery recently, but in three legs only, which indicates for a correction within the downtrend by Elliott wave theory, called a zig-zag. It stopped perfectly at equal wavelength of waves (A)=(C) and at the channel resistance line, so bears can be back, especially if it breaks below 10.0 level.
A zig-zag correction within a bearish trend
USDNOK short potential setupUSDNOK recently broke down below the monthly 50ema (overlayed on this 4h chart) and has rejected off the daily 20ema (overlayed) twice this week. RSI is showing bearish momentum after a brief overbought period while the PA has remained in a strong downtrend. Short setup potential is evident but not certain.
I'm a cat not a financial advisor.
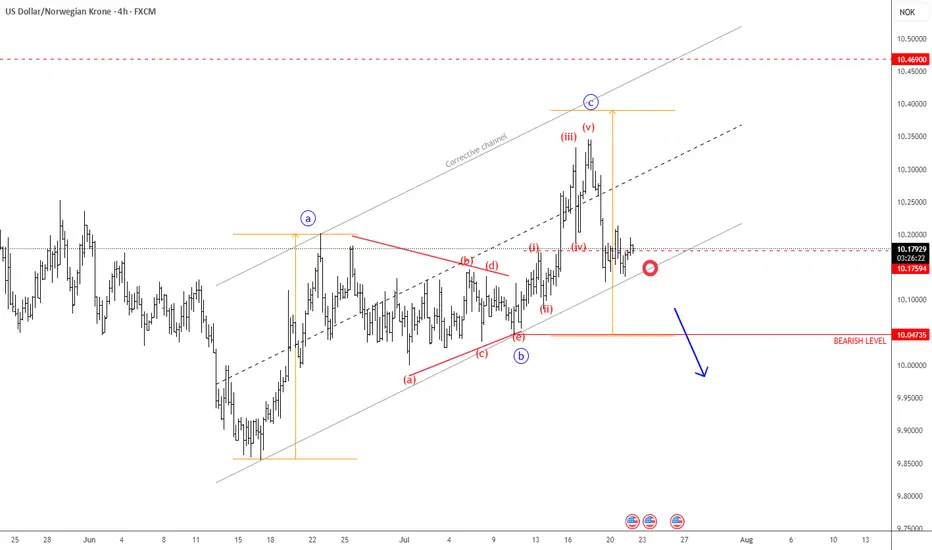
USDNOK Remains BearishUSDNOK made a three-wave rise from the recent low, indicating an abc correction within a downtrend—especially considering the triangle in wave "b" in the middle, and the current sharp decline following a completed five-wave impulse in wave "c". As long as this structure remains intact, there is still a risk of another leg lower. Therefore, we can expect further weakness toward the June lows, especially if it breaks below the channel support line. Just watch out for short-term intraday pullbacks.
USDNOKOn the monthly charts we have a confirmed bearish trend with a bullish correction in play.
On the weekly charts we have a shift in order flow confirming our bearish bias though its a long term view. We have an impulsive bearish move that has necessitated a bullish correction to clear previous disequilibrium.
The break in daily structure confirms shift in order flow from bullish to bearish. Presently we are bearish, in consonance with our monthly and weekly view.
USDNOK - US Dollar / Norwegian Krone (Daily chart, OANDA)USDNOK - United States Dollar / Norwegian Krone (Daily chart, OANDA) - Short Position; Short-term research idea.
Risk assessment: Medium {support structure integrity risk}
Risk/Reward ratio ~ 2
Current Market Price (CMP) ~ 10.31500
Entry limit ~ 10.30000 on May 06, 2025
Target limit ~ 10.50000 (+1.94%)
Stop order limit ~ 10.18000 (-1.17%)
Disclaimer: Investments in securities markets are subject to market risks. All information presented in this group is strictly for reference and persona
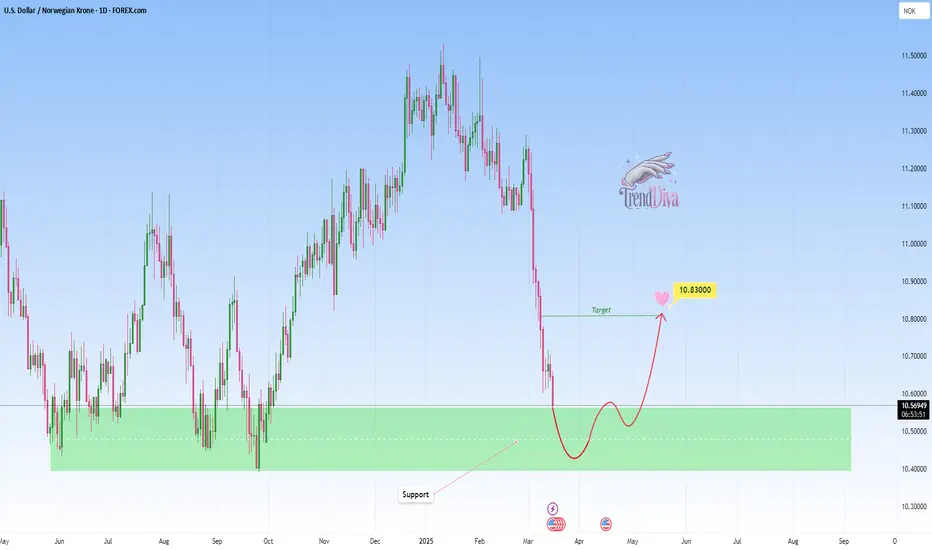
USDNOK - Buy opportunity towards 10,8300?OANDA:USDNOK is testing a clear support area, marked by previous bullish reversals and strong buyer interest. The recent bearish move into this zone suggests a potential buying opportunity if buyers confirm control.
If bullish signals, such as strong rejection wicks or bullish candlestick patterns, emerge, I anticipate an upward move toward 10,8300. If the support fails to hold however, further downside could be expected.
Remember, always confirm your setups and trade with solid risk manage
USDNOK false breakout leading to breakdown?Intraday Update: The USDNOK slammed back to the 10.90's as the Norges CB kept rates unchanged today. As other central banks (like the BOE just minutes ago cutting rates) this has allowed the USDNOK to break back below 11.00. The 11.1500 is shaping up as key resistance and stops below the 10.9000 should be building.
USDNOK Very strong buy signal medium-term.The USDNOK has been consistently giving us excellent signals on this 2-year pattern with the last one (July 10, see chart below) being a buy that hit the 11.0000 Target:
This time the pair is again inside the 2-year Higher Lows Zone, while holding Support 1. The previous High was rejected on Resistance 1, so the Triangle may be transitioning into a Rectangle medium-term.
In any case, this low price is a buy opportunity with our Target being slightly below the Lower Highs trend-line at 10.9
USDNOK Is Still Eyeing June LowsUSDNOK is sideways for the last two years that looks like a triangle within uptrend. It's an ABCDE pattern where wave E can be in play, ideally still to the lower side of a range for subwave (C) after the recent subwave (B) rally. Notice that we see price turning sharply and impulsively from the upper triangle resistance line as expected, so wave (C) is in full progress which can push the price down to 10.30 - 10.00 support zone before we will see stabilization and recovery.
USDNOK is not at th
USDNOK Buy opportunity above the 1D MA50.The USDNOK pair has been trading within a Triangle pattern for the past 2 years (since June 2022) and right now is consolidating right below the 1D MA50 (blue trend-line) after holding the Higher Lows Zone.
Within this 2-year pattern, every time the price broke above the 1D MA50 following a bottom bounce, the new Bullish Leg was initiated. Our Target is 11.000 (just below the Lower Highs trend-line).
-------------------------------------------------------------------------------
** Please LI
USDNOK Is Looking For More Short-Term WeaknessUSDNOK is sideways for the last two years that looks like a larger triangle within uptrend. It's an ABCDE pattern where wave E can be in play as pair stops at the upper side of this contracting range.
Ideally, market is coming down for a pullback within higher degree wave E, where pair can complete the sideways price pattern. So for now, seems like there is room for more weakness within a three-wave (A)-(B)-(C) decline to the lower side of a range.
Wave (B) looks to be a bearish triangle patte
USDNOK One of the best sells in the market.The USDNOK pair has formed a cyclical top on the 1D time-frame and is currently pulling back towards the 1D MA50 (blue trend-line). This level has been supporting since March 14 2024. If broken, we expect a a 2nd dip to the 1D MA200 (orange trend-line) as well and as it pierces through the (green) Ichimoku Cloud, stage a dead-cat-bounce back at its top and the 1D MA50.
That should give way to the 2nd part of the Bearish Leg towards the 2-year Higher Lows Zone. Our target is on the top of that Z
USDNOKOn the monthly charts we have a confirmed bearish trend. Presently, on the monthly charts, we have a bullish correction that we can trade.
On the weekly charts we have a shift in order flow confirming our bearish bias though its a long term view. We have an impulsive bearish move that has necessitated a bullish correction to clear previous disequilibrium.
On the daily charts we have a minor shift in order flow from bearish to bullish that we seek to trade.
USDNOK: Ascending Broadening Wedge Partial-Rise ConfirmationUSDNOK after giving what has been a very nice performance off of that Bullish Butterfly has now confirmed a Partial-Rise within the Ascending Broadening Wedge it has traded within and now sits just below the 21 and 200-day SMA. We would now expect a heightened chance of the price breaking down and hitting the measured move target down at 9.4 NOK, which so happens to align with the 0.618 Fibonacci retracement.
For reference this is the previous Bullish Setup on the USDNOK before it confirmed th
USDNOK: Buy signal.USDNOK is trading inside a Channel Up for almost four months, with the 1D MA50 supporting as the medium term Support. The very healthy bullish 1D technicals (RSI = 62.188, MACD = 0.074, ADX = 41.092) indicate that the current price action will lead higher so we are buying into today's strength and aim at another +4.60% rise (TP = 11.500).
## If you like our free content follow our profile to get more daily ideas. ##
## Comments and likes are greatly appreciated. ##
USDNOK Pull-back in full motion. Buy it.The USDNOK pair is trading within a 1 year Channel Up with the price above both the 1D MA50 (blue trend-line) and 1D MA200 (orange trend-line). Last week's rejection on the 0.786 Fibonacci retracement level is similar with the one in March 16 2023, which after pulling back to the 1D MA50 and was contained above the 0.382 Fibonacci, it reversed upwards to a new Higher High just below the 1.236 Fibonacci extension. As a result, we will buy the current pull-back and target 11.5000.
---------------