Stock Markets Consolidate Ahead of the HolidaysStock Markets Consolidate Ahead of the Holidays
A lull is expected on the financial markets today due to a shortened trading week related to the Easter holiday celebrations.
It is reasonable to assume that traders will get a “breather” after a news-heavy April, which caused a volatile “shakeout” in the stock markets.
US Stock Markets
On Wednesday, Federal Reserve Chair Jerome Powell was both cautious and somewhat aggressive in his forecasts regarding US monetary policy, stating that Trump’s tariffs could delay the achievement of inflation targets.
In response, US President Donald Trump accused Powell of “playing politics”, hinting at his possible dismissal.
European Stock Markets
On Thursday, the ECB cut interest rates for the seventh time in the past 12 months, and European Central Bank President Christine Lagarde left the door open for further easing.
Analysts had expected a rate cut from 2.65% to 2.40%, so the financial markets reacted relatively calmly to the ECB’s decision.
Technical Analysis of the S&P 500 Chart (US SPX 500 mini on FXOpen)
On the charts of European and US stock indices today, a narrowing triangle pattern is forming, indicating a balance between supply and demand — in other words, price is more efficiently factoring in all influencing elements.
On the S&P 500 chart (US SPX 500 mini on FXOpen), the triangle is highlighted in grey. The ADX and ATR indicators are trending downwards, which underlines signs of consolidation.
From a bearish perspective, the market is in a downtrend (marked by the red trend channel) — but from a bullish point of view, price is in the upper half of the channel.
Although the situation appears “reassuring”, the long weekend may bring a string of high-impact statements from the White House, which could disrupt the balance and lead to a breakout from the triangle.
It is not out of the question that the bulls may seize the initiative and challenge the upper boundary of the channel in an attempt to lay the groundwork for an upward trend (shown in blue lines).
This article represents the opinion of the Companies operating under the FXOpen brand only. It is not to be construed as an offer, solicitation, or recommendation with respect to products and services provided by the Companies operating under the FXOpen brand, nor is it to be considered financial advice.
Ustocks

TSLAHi guys,
In this chart i Found a Demand Zone in TSLA CHART for Positional entry,
Observed these Levels based on price action and Demand & Supply.
*Don't Take any trades based on this Picture.
... because this chart is for educational purpose only not for Buy or Sell Recommendation..
Thank you

$PLD with a bullish outlook following its earnings #StocksThe PEAD projected a bullish outlook for NYSE:PLD after a positive over reaction following its earnings release placing the stock in drift B with an expected accuracy of 91.67%.

$SNA with a bullish outlook following its earnings #StocksThe PEAD projected a bullish outlook for NYSE:SNA after a positive under reaction following its earnings release placing the stock in drift A with an expected accuracy of 76.74%.

20% upside in APPLEThe stock set into an impulse in Jan 2023 and completed the first wave up by Feb 2023 and corrected thereafter till the first week of march.
The wave 3 in the stock began in march 2023 and went on all the way till July and there after the stock was in complex wave 4 correction until last week.
The stock is now coming out of the 4th wave correction and could give a great "Santa Rally" beginning in November and extending till Christmas Day(or beyond).
The target for the 5th wave is projected around 205-210 zone.

TGGI WEEKLY CHART ANALYSISThe weekly time frame looks bullish as it breaks upward in Bollinger bands. However, it is taking resistance at.0072. Once it crosses above .0072, almost upward territory will open (approximately 169% returns). Further crossing above .0186, still 57% upside is left.
Below, look at the RSI (refer to the yellow arrow); it is also above 60, which looks bullish and ready to move upward, which is also a positive sign for trading in this stock.
Read more at : evtsn.com

AMZN NEXT MOVE AMZN AMAZON is looking forward to reversal towards 132 levels , all condictions is mentioned in the chart ,, trade with care , trade always with confidence

TESLAHELLO GUYS THIS MY IDEA 💡ABOUT TSLA is nice to see strong volume area....
Where is lot of contract accumulated..
I thing that the Seller from this area will be defend this SHORT position..
and when the price come back to this area, strong SELLER will be push down the market again..
DOWNTREND + Support from the past + Strong volume area is my mainly reason for this short trade..
IF you like my work please like share and follow thanks
TURTLE TRADER 🐢

SQQQHELLO GUYS THIS MY IDEA 💡ABOUT SQQQ is nice to see strong volume area....
Where is lot of contract accumulated..
I thing that the buyers from this area will be defend this LONG position..
and when the price come back to this area, strong buyers will be push up the market again..
UP TREND + Resistance from the past + Strong volume area is my mainly reason for this long trade..
IF you like my work please like share and follow thanks
TURTLE TRADER 🐢

multi-timeframe analysis for AMZNHello guys
As you see in chart, it formed a QM structure on a flip of monthly time frame, after confirming that structure started bullish movement and in way make a island pattern because of two sides gap. The last gap doesn’t fill so if we get short position, we can put target below that gap(target=$125.41).
Price formed a three-drive pattern and with RSI divergence confirmed this pattern, three drive is a great approach.
always do your own research.
If you have any questions, you can write it in comments below, and I will answer them.
And please don't forget to support this idea with your like and comment.
BE PROFITABLE

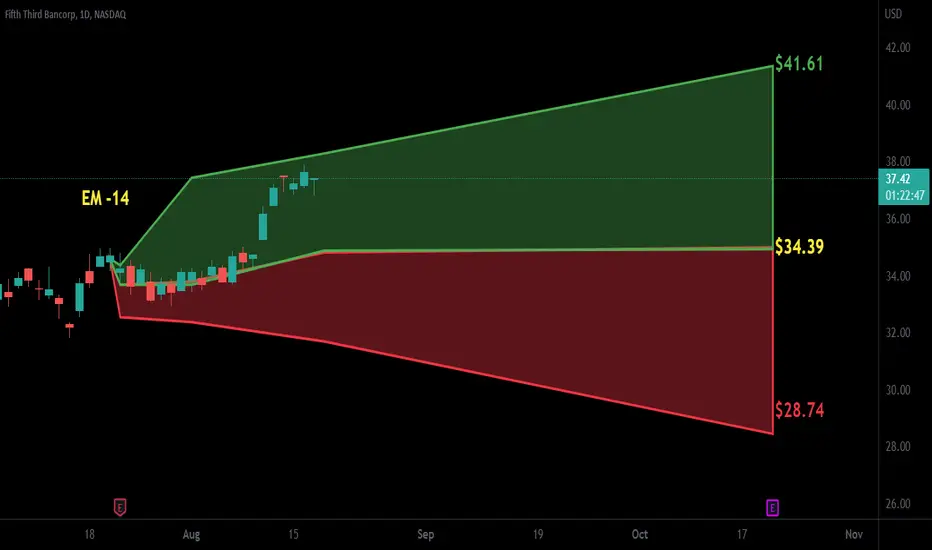
$FITB with a Neutral outlook following its earnings #Stocks The PEAD projected a Neutral outlook for $FITB after a Negative Under reaction following its earnings release placing the stock in drift D with an expected accuracy of 50%.
This is not photoshopped - Adobe heading lower?Adobe - Short Term - We look to Sell at 380.40 (stop at 401.40)
The medium term bias remains bearish. The gap open from 10/06/2022 to 13/06/2022 has now been closed. As this corrective sequence continues we look to set shorts on a rally at better risk/reward levels. Further downside is expected and we prefer to set shorts in early trade.
Our profit targets will be 321.30 and 256.00
Resistance: 392 / 426.42 / 441.90
Support: 357.56 / 338.00 / 320.90
Disclaimer – Saxo Bank Group. Please be reminded – you alone are responsible for your trading – both gains and losses. There is a very high degree of risk involved in trading. The technical analysis, like any and all indicators, strategies, columns, articles and other features accessible on/though this site (including those from Signal Centre) are for informational purposes only and should not be construed as investment advice by you. Such technical analysis are believed to be obtained from sources believed to be reliable, but not warrant their respective completeness or accuracy, or warrant any results from the use of the information. Your use of the technical analysis, as would also your use of any and all mentioned indicators, strategies, columns, articles and all other features, is entirely at your own risk and it is your sole responsibility to evaluate the accuracy, completeness and usefulness (including suitability) of the information. You should assess the risk of any trade with your financial adviser and make your own independent decision(s) regarding any tradable products which may be the subject matter of the technical analysis or any of the said indicators, strategies, columns, articles and all other features.
Please also be reminded that if despite the above, any of the said technical analysis (or any of the said indicators, strategies, columns, articles and other features accessible on/through this site) is found to be advisory or a recommendation; and not merely informational in nature, the same is in any event provided with the intention of being for general circulation and availability only. As such it is not intended to and does not form part of any offer or recommendation directed at you specifically, or have any regard to the investment objectives, financial situation or needs of yourself or any other specific person. Before committing to a trade or investment therefore, please seek advice from a financial or other professional adviser regarding the suitability of the product for you and (where available) read the relevant product offer/description documents, including the risk disclosures. If you do not wish to seek such financial advice, please still exercise your mind and consider carefully whether the product is suitable for you because you alone remain responsible for your trading – both gains and losses.

Tesla: Current Price Moves Within a Bearish StructureTesla has been moving in a wide descending channel since late 2021. We can clearly spot that prices have been making lower highs and lower lows. The price is currently moving within a short-term bearish structure after a rejection by the trend line. Last week, we can observe that price has completed its retracement and was rejected at the previous support level. This makes the bearish structure still valid and we expect the price to fall to test the $760 level first, and then to test $700 level, which is the 2022 low.

BNNLFThis is an OTC Uranium miner stock based out of Africa, they are lagging the big majors like CCJ &UUUU GLATF as far as most recent push off the retracement that tested 618% gold fib ratio. Looking for a wave 5 push to around .49c possible moon shot to .61c

UUUUHere is my detailed analysis on UUUU. I think we need to test $3.60 to finish the larger HTF Wave C. Please like the video and share it on your social media. Big Mike loves you all.

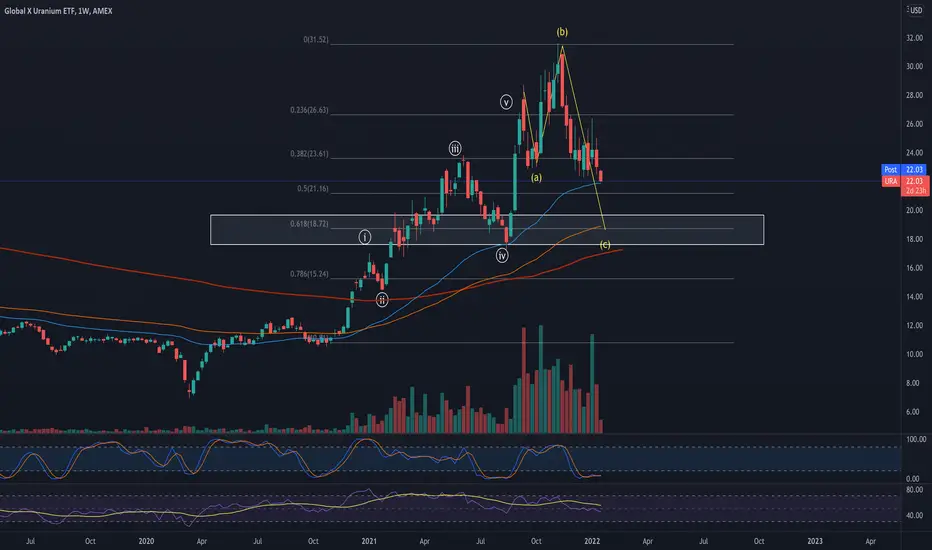
URACount on URA looks like 5 up followed by an irregular top which in EW terms means that after 5up impulsive waves complete the correction ensues but wave A falls short to correct the prior impulsive move then the B wave over shoots the top of wave 5 in an irregular top, the C wave that follows should be 5 down and make up for the A wave which was small in % compared to the trend. C wave should retrace to 618% fib lvl around $18
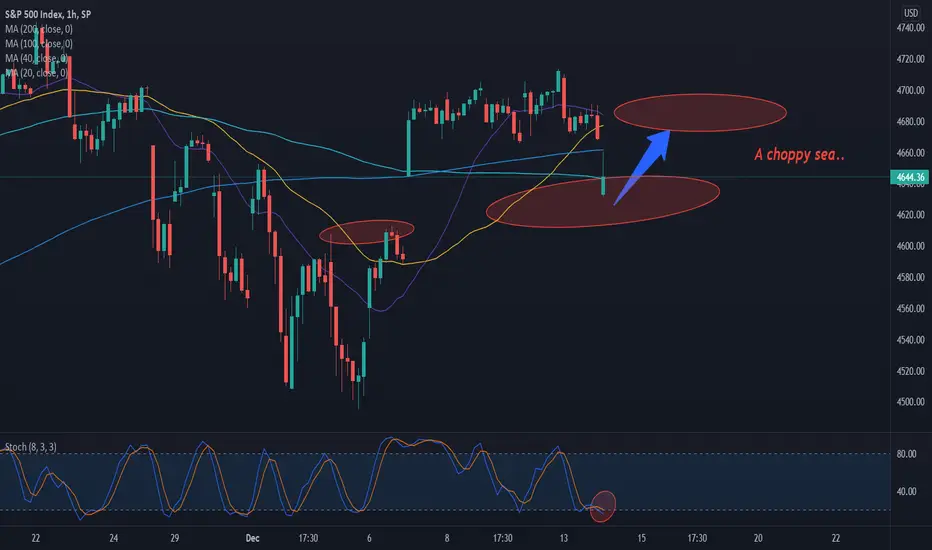
SPX the next episode..For more daily detailed analysis, don’t forget to click on the follow button. Also, please ask any questions you may have and I will be happy to answer them.
Recently, we looked at the SPX and took gains on our shorts.
Market sentiment is feeding heavily into this asset.
There is room for an intraday long. More comfortable long term support is below so incorp RM and DCA measures.
We are looking long back to the TGT noted.
The key aspect is keeping an eye on current market sentiment. This heavily affects indices.
FSSPure technical Entry.
VSA . price action and fibo included for analysis
Market will take 2 - 7 days to achieve Target . close trades during weekend .
Trade Responsible. We dont take responsibility for your loss

£AZN 1-day classic patternsQ: What has the highest probability of occurring?
After being one of the strongest performers in 2020 during the initial UK lockdown the stock lost over 30% of its value.
In 2021 it has staged a modest recovery but is still over 15% below its all time high requiring an over 20% rally.
There is well tested support at 8100p and resistance at 8775p.
There is 2 classic patterns 1 that has not validated. 1 that has validated.
The bull flag, with a breakout of 8775p, stop at 8100p, and projected target at 10150p. A risk-to-reward ratio of 2R.
The breakout from the bull flag needs to be confirmed by a close outwith both the flag and resistance. A difficult task therefore requiring more time to confirmation.
The double top, with a breakout of 8100p, and projected target at 7400p. Using a stop half the size of the range creates a 2R opportunity.
The stock also pays a 2.48% dividend semi-annually. Given the length of the setup this trade may run deep into 2022 to allow that dividend to be collected.
Although before that point there will be 2 earnings releases adding volatility to any potential positions held.
The short trade is therefore not of interest here however considering it has validated this may act as a catalyst for the long side. But again it is not yet validated.

Nasdaq: Weekly Forecast 20210620Nasdaq managed to break a new high last week as it reached the top of a rising wedge.
While Nasdaq was able to remain somewhat bullish, both Dowjones and S&P500 ended the week in a loss, especially the Dowjones which shed off 3.7%, the biggest weekly loss in 8 months.
It is fundamentally reasonable for the stock market to come off the top as the Fed signals for earlier tightening of monetary policy which ultimately means a reduction for "hot money".
As such, we expect Nasdaq to follow suit and therefore we will be looking for selling opportunities this week at the top of the rising wedge, targeting at 13800 and 13500.


