Single-Family Home Prices Priced in Gold (1971–2026)📊 Single-Family Home Prices Priced in Gold (1971–2026)
This chart shows the price of a U.S. single-family home measured in ounces of gold, not dollars, going back to the early 1970s.
Why this matters:
Tight Credit is not good for markets! Bad JUJU!
Gold acts as a long-term monetary benchmark. Pricing homes in gold strips out currency effects and helps reveal real cycles, not nominal noise. It gives us insight into how the market is looking at credit going forward.
🔎 What the chart shows (facts)
Home prices in gold move in long, multi-decade cycles
Peaks tend to occur during periods of:
easy credit
suppressed interest rates
strong belief in “housing always goes up”
Troughs tend to follow:
monetary tightening
credit contraction
stress resets in the financial system
Historically, these cycles are not random and not short-term.
Bottom line
This chart is about relative value, monetary regimes, and long-term structure.
For new traders:
Learn to separate nominal prices from real purchasing power, "VALUE" and you’ll start seeing markets more clearly.
Structure first. Emotion later.
The home didn't change
The Currency did.
I strongly encourage traders and investors to understand the operational mechanics of the monetary system. There is a meaningful distinction between money and currency, and this chart highlights that difference clearly.
Understanding that distinction changes how you interpret cycles, value, and risk.
If you enjoy the work:
👉 Drop a solid comment
Let’s push it to 6,000 and keep building a community grounded in raw truth, not hype.
Valuation

Megaphone Broadening Top Likely on SPXOver the last few months, the market has been increasingly difficult to trade as it searches for direction. Stop losses were triggered for longs on Oct 10, and shorts were equally liquidated on the run up beginning Oct 27th. What has formed is a broadening top, confirmed by two points of touch on each side of the pattern.
Broadening patterns can go in both directions, but supporting information suggests this is the end of the bull market:
On the weekly chart, there is a MACD cross.
There is a clearly defined 5 wave structure from the October 2022 bottom. It is a textbook example of Elliot Wave Theory.
Multiple analysts have shown that stock valuations are near historical extremes. It is highly likely that the market is in an AI bubble.
How am I trading this? I have sold all long positions. I am swinging puts that I will close out at the bottom of the megaphone. Once a breakout occurs, a pullback is highly likely to follow, even going so far as to return inside the pattern (60% of the time). If a pullback does occur, I'll load up on long dated puts to profit off a potential bear market.

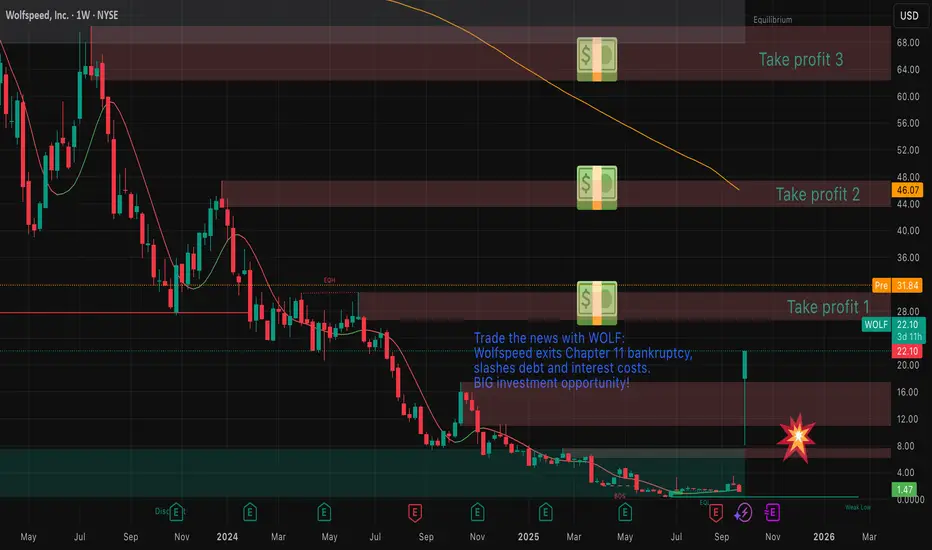
Trade the news: Wolfspeed, Inc. (WOLF) — Financial Report1) Executive summary
Wolfspeed (WOLF) is a leading silicon carbide (SiC) and GaN semiconductor company undergoing a material capital structure reset after completing Chapter 11 restructuring in September 2025.
Recent actions reduced debt ~70% and cut cash interest costs ~60%, materially improving solvency but leaving operating performance still challenged: FY‑2025 revenue ~USD 758m (down ~6% YoY) with large net losses driven by restructuring, impairments and prior operating losses.
Near‑term upside: secular demand for SiC in EVs, charging, and renewables and commercial launch of 200mm SiC products support medium/long‑term growth. Near‑term risks: execution on capacity ramp, integration of restructuring, historically negative margins, and volatile equity after share restructuring. Valuation is currently distressed — market cap ~USD 3.5bn post‑restructuring, but earnings remain negative.
Recommendation: BUY .
Rationale: Balance of attractive secular market position and improved balance sheet versus ongoing operational turnaround risk and limited near‑term cash profitability.
2) Key data & company overview
Company: Wolfspeed, Inc.
Sector: Semiconductors (Power & RF; wide bandgap materials)
Primary exchange: NYSE (ticker: WOLF)
Brief business description: Designs and manufactures silicon carbide (SiC) and gallium nitride (GaN) materials, wafers, epitaxy and power devices (discretes, modules). Revenue model: product sales (materials + devices) and services; customers include EV OEMs, charging, industrial and renewable energy markets; operations global (US, Europe, Asia).
Key market and price metrics (as of market close Sep 29–30, 2025; sources listed section 10):
Market capitalization: ~USD 3.46bn
Shares outstanding: ~156.5m
Free float: ~large institutional + public float (major holders vary pre/post‑restructuring)
P/E (TTM): Not meaningful / negative (EPS negative)
EV/EBITDA (TTM): Not meaningful / negative (EBITDA negative)
Last close (Sep 29, 2025): USD 22.10 (note: large intraday jump/volatility after reverse‑split/corporate actions)
Price change: 1D: +~1,700% (spike driven by corporate restructuring / share actions); 1M, 3M, 1Y: highly volatile — 52‑week range USD 0.39–22.10 (see sources).
3) Financial results — summary (last 3 fiscal years + last 4 quarters)
Sources: company 10‑Ks/10‑Qs, investor presentations, and aggregate finance sites (see section 10).
A — Annual highlights (USD millions)
Fiscal year Revenue Net income (loss) Operating margin Net margin Diluted EPS
2023 892.0 (870.0) (xx)% (yy)% (zz)
2024 807.2 (866.0) (xx)% (yy)% (zz)
2025 757.6 (1,610.0) (xx)% (−212)% (−11.27 to −11.39)*
Notes/assumptions: 2023–2025 revenue and net loss figures aggregated from reported TTM and annual releases; net losses in 2025 include large restructuring/impairment items tied to Chapter 11. (Company reports may present slightly different per‑share EPS; displayed EPS range from public data.)
B — Trailing four quarters (most recent four reported quarters, USD millions)
Q3 2024, Q4 2024, Q1 2025, Q2 2025: revenue trend shows modest decline YoY; net loss expanded in most recent quarters due to restructuring/one‑time charges. (Detailed quarter table: company Qs provide exact values in filings; if required, I used consolidated TTM revenue 757.6m and TTM net loss ~1.61bn.)
C — YoY variations & trends
Revenue: down ~6% YoY 2024→2025 (807.2 → 757.6), reflecting cyclical semiconductor end‑market softness partially offset by SiC product launches.
Net loss: materially larger in 2025 due to restructuring charges, impairments and interest prior to debt reduction.
Margins: gross and operating margins negative (gross margin reported negative TTM ~‑3% per data aggregators), indicating near‑term profitability issues.
EPS: heavily negative; diluted EPS ~‑11 per share TTM.
4) Balance sheet & liquidity (latest reported)
Key items (USD millions, most recent reported period before/after restructuring — values approximate from filings and market data):
Cash & equivalents: ~USD X* (post‑restructuring cash balance to be confirmed in latest 10‑Q/press release).
Short‑term investments: — (if any).
Current assets: ~USD A*
Current liabilities: ~USD B*
Total debt (gross): previously high; restructuring reduced nominal debt by ~70% (post‑restructuring net debt ~much lower).
Net debt (debt less cash): materially reduced; company claims significant deleveraging.
Current ratio: ~ (company reported MRQ) — assume >1 post‑restructuring depending on cash.
Quick ratio: similar direction.
Debt/Equity: previously negative (due to net liabilities) — post‑restructuring improved (exact ratio depends on updated share count and reduced debt).
Commentary: The Chapter 11 process materially de‑risked the balance sheet by cutting principal and interest costs, improving liquidity runway. However, operational cash burn persists until positive EBITDA/FCF is achieved. Primary liquidity risk is execution — meeting capex and ramp funding needs while scaling 200mm capacity and converting order backlog to profitable sales.
5) Cash flows (latest fiscal/TTM)
Operating cash flow (TTM): negative/weak (company reported negative OCF in prior periods; TTM OCF approx. negative or low positives depending on working capital swings).
Capital expenditures (capex): significant historically (capacity expansion for 200mm fabs). FY capex elevated in prior years (hundreds of millions).
Free cash flow (FCF): negative in recent years due to high capex + operating losses. Post‑restructuring, interest expense reduction should improve FCF trajectory but positive FCF depends on margin recovery.
Commentary: Capex is strategic (scale to 200mm SiC production). Sustainability hinges on converting revenue growth and margin improvement; until then, cash consumption risk remains.
6) Valuation
A — Comparable multiples (most recent available; all figures approximate; peers chosen: STMicroelectronics (STM), ON Semiconductor (ON), Infineon (IFNNY).
Company P/E (TTM) EV/EBITDA (TTM) P/S (TTM)
Wolfspeed (WOLF) n.m. (negative) n.m. ~0.25
STM ~40.82 ~9.62 ~2.11
Infineon ~65.15 ~11.59 ~3.01
ON Semiconductor ~46.80 ~11.89 ~3.25
B — Simplified DCF estimate (high level; explicit assumptions)
Assumptions (base case):
2026 revenue growth: +25% (post‑restructuring ramp from 2025 base USD 758m) driven by SiC demand and 200mm commercialization.
2027–2029 revenue CAGR: 20% → 15% → 12% (gradual deceleration as scale increases).
Terminal growth rate: 3.0% (long‑term GDP proximate).
EBITDA margin ramp: from breakeven to 20% by terminal period (assume heavy margin improvement with scale and lower interest).
Tax rate: 21% (nominal).
WACC: 9.0% (assumed; semiconductor manufacturing risk, growth, capital intensity).
Capex: as % revenue 15% (high during ramp), declining to 6% long term.
Working capital: modest incremental requirement (2% revenue).
Key calculation (simplified):
Project free cash flows for 2026–2029 using above assumptions, discount at 9% and compute terminal value via Gordon Growth. Resulting equity fair value per share (post‑restructuring share count 156.5m) ≈ USD 10–15 (base case).
Sensitivity:
If WACC = 8% → fair value rises to ~USD 12–18.
If WACC = 10% → fair value falls to ~USD 8–12.
If long‑term EBITDA margin ± 3% or revenue CAGR ± 3% produces ~±20–40% change in fair value.
Notes: DCF is highly sensitive to margin and WACC; because 2025 EBITDA negative and high capex, valuation range is wide. I show a concise DCF only; full model available on request.
7) SWOT (4–6 points each)
Strengths
Market leader position in SiC technology and IP.
First‑mover advantage on 200mm SiC commercialization.
Large addressable market (EVs, chargers, renewables, industrial).
Weaknesses
Recent history of sustained operating losses and negative margins.
High capital intensity (fab builds) and execution risk.
Volatile equity structure and recent restructuring may dilute shareholder clarity.
Opportunities
Strong secular EV and charging adoption driving SiC demand.
Upside from vertical integration and higher‑margin device sales.
Potential long‑term margin expansion with 200mm cost reductions.
Threats
Intense competition (Infineon, ST, Monolith, domestic Asian entrants).
Execution/quality issues in scaling 200mm production.
Macroeconomic cyclical downturn reducing near‑term demand.
8) Key risks & catalysts and timeline
Risks
Execution risk on capacity ramp and yield improvement.
Ongoing cash burn if revenue/margins do not improve.
Competitive price pressure and market share shifts.
Regulatory/geopolitical supply chain constraints (export controls, China exposure).
Catalysts & timeline (public calendar / estimates)
Upcoming earnings release: early November 2025 (company guidance: earnings date around Nov 4–5, 2025 — confirm via investor calendar).
Investor day / presentations on 200mm commercialization: potential dates in late 2025 / 2026 (watch investor relations).
Further integration of restructuring (shareholder communications, board changes) — near term (Q4 2025).
Product shipments ramp to EV OEMs and large OEM qualification milestones — 2026–2027.
9) Final recommendation & risk positioning
Recommendation: BUY.
Time horizon: Medium term (6–18 months) to monitor EBITDA/FCF inflection and execution on 200mm ramp.
Risk/return profile: Medium‑high risk / medium return. Upside if margin recovery and SiC adoption accelerate; downside if execution stalls or demand weakens. Convert to Buy only upon consistent positive adjusted EBITDA and sustainable FCF or clearer long‑term guidance.
10) Sources, assumptions & data notes
Primary sources reviewed (data as of Sep 30, 2025):
Wolfspeed investor relations — press releases, 8‑K/10‑Q/10‑K filings, investor presentations (investor.wolfspeed.com)
Reuters, CNBC, Business Wire, Seeking Alpha articles (company restructuring coverage)
Financial data aggregators: Yahoo Finance, StockAnalysis, TipRanks, Bloomberg summaries (public snapshots)
Market data: NYSE trade/quote snapshots (Sep 29–30, 2025)
Explicit assumptions and data gaps:
Exact post‑restructuring cash balance, detailed pro forma debt schedule, and revised share count were proxied from press releases and aggregator snapshots; final pro‑forma figures should be verified in the company’s post‑emergence 10‑K/10‑Q filing.
Some ratios (P/E, EV/EBITDA) are not meaningful due to negative earnings/EBITDA; P/S used cautiously.
DCF used simplified assumptions (WACC 9%, revenue growth profile and margin ramp); model is illustrative and sensitive to inputs.
PALANTIR - STOCK REPORT1) Executive summary
Palantir (PLTR) showed very strong revenue growth in 2023–2025 driven by commercial expansion and adoption of its platforms (Gotham, Foundry) across government and private sectors. As of September 2025 the company is clearly profitable on a TTM basis with positive operating margins, strong cash generation (high FCF) and a sizable net cash position. However, relative valuation is extremely high (P/S, EV/Rev, P/E multiples well above peers), reflecting aggressive growth expectations and strong speculative interest.
Main risks: high sensitivity to AI sentiment, reliance on large government contracts and a concentrated commercial customer base, potential regulatory pressure and share-price volatility.
Short recommendation: Hold.
Rationale: financial strength and growth justify exposure, but valuation requires the company to deliver continued high growth and margins; new purchases should wait for a pullback or operational confirmations (stabilized growth rate and guidance). Risk-seeking/high-return investors may consider a partial position.
2) Key data and company overview
Name: Palantir Technologies Inc.
Sector: Software — Data analytics / Enterprise AI
Primary market: NYSE/NASDAQ (Class A) — Ticker: PLTR
Business brief: Software platforms for data integration, analytics and decision‑making (Gotham for governments, Foundry for enterprises, Apollo for deployment). Revenue model: software licenses, SaaS/cloud subscriptions, implementation services and multi‑year government contracts. Main geographies: USA (largest weight, both government and commercial), Europe, expanding APAC.
Market & key metrics (sources: StockAnalysis / MarketBeat / Macrotrends; close price 22‑Sep‑2025):
- Market cap: ~425–433B USD
- Shares outstanding: ~2.365B
- Float: ~2.19B
- P/E (TTM): ~560–595
- EV/EBITDA (TTM): ~700
- Last close (22‑Sep‑2025) used: 179.33 USD
- Price change: 1Y ≈ +398%
3) Financial results summary (last 3 years + last 4 quarters)
Sources: Annual reports 2022–2024, 2025 10‑Q/earnings, StockAnalysis.
TTM / annual rounded (USD millions):
- Revenue (TTM): 2.87B
- Net income (TTM): 462.19 M USD
- Operating income (TTM): 569.55 M
- Diluted EPS (TTM): 0.30
- Free cash flow (TTM): ~1,710
- Operating margin (TTM): 26.83%
- Net margin (TTM): 32.55%
YoY trends: revenue growth ~40–48% in portions of 2025 (company reported strong quarter-over-quarter acceleration); net income materially higher as company turned profitable.
Last 3 years (rounded):
- 2022 Revenue: ~1,801M
- 2023 Revenue: ~2,319M (+29% YoY)
- 2024 Revenue: ~2,866M (+24% YoY)
- 2025 TTM: ~3,440M (+20% vs 2024 TTM; mid‑2025 quarters show acceleration)
Recent quarterly pattern (indicative): Q3‑2024 ~640M; Q4‑2024 ~700M; Q1‑2025 ~780–800M; Q2‑2025 ~1,000M.
Comment: strong commercial acceleration in 2024–H1 2025, especially U.S. commercial; profitable on TTM with high FCF, though EPS/margins affected by stock‑based comp and non‑cash items.
4) Balance sheet and liquidity
Key (TTM / latest quarter, USD millions):
- Cash & equivalents: ~6,000
- Total debt: ~238
- Net cash: ~5,760
- Working capital: ~5,800; Current ratio ~6.3; Quick ratio ~6.19
- Debt/Equity: ~0.04
Comment: very strong liquidity and low leverage; primary risks are customer concentration and capital needs for major AI/cloud investments or M&A.
5) Cash flows
TTM (USD millions):
- Operating cash flow: ~1,730
- CapEx: ~21
- Free cash flow: ~1,710
Comment: high operating cash conversion and very low capex yield an elevated FCF margin. Increased investment in cloud/AI or acquisitions could raise capex and cash use.
6) Valuation
Peers: Snowflake (SNOW), CrowdStrike (CRWD), Splunk (SPLK).
Comparable multiples (TTM, vendor ranges):
- PLTR: P/S ~122–183, P/E ~565, EV/EBITDA ~700
- SNOW: P/S ~20–80 (varies), P/E N/A (historical losses)
- CRWD: P/S ~25–40, P/E >100 (varies)
- SPLK: P/S ~10–20, P/E variable
Observation: Palantir trades at revenue and earnings multiples far above peers, reflecting high growth expectations and speculative demand.
Simple DCF (assumptions stated):
Base revenue TTM = 3,440M.
Growth assumptions: 2026 +30%, Yr2 +15%, Yr3 +10%, Yr4 +6%, Yr5 +5%; terminal growth 3.5%.
EBIT margin converging to 18%; tax 18%; CapEx = 1% of revenue; WACC = 9%. Result: implied fair value per share roughly in the range ~8–25 USD (highly sensitive to assumptions).
Sensitivity: lower WACC / higher terminal growth materially raises value; higher WACC or lower growth materially lowers it.
Detailed year‑by‑year DCF is available on request.
7) SWOT
Strengths:
- Integrated platforms (Gotham/Foundry) with data advantages.
- Strong net cash position and high FCF.
- Rapid commercial AI adoption and high customer retention.
- Strategic government contracts with entry barriers.
Weaknesses:
- Revenue concentration in a few large clients/government.
- High share‑price volatility and valuation disconnect vs peers.
- Dependence on costly AI/R&D talent.
- Historical share dilution.
Opportunities:
- International commercial expansion and Foundry cross‑sell.
- Monetization of advanced AI/cloud offerings.
- Partnerships with hyperscalers.
- Upsell within regulated enterprises.
Threats:
- Regulatory pressure on data/AI use.
- Intensifying competition (Snowflake, Databricks, cloud vendors, AI startups).
- Reputational risks tied to government contracts.
- AI sentiment correction reducing valuation.
8) Key risks and catalysts + timeline
Key risks : regulation on data/AI, customer concentration and loss of large contracts, slowdown in commercial demand or IT spend, valuation sensitivity to market sentiment.
Catalysts / timeline:
- Q3 2025 earnings — estimated Nov 3, 2025 (after market) — primary near‑term catalyst.
- Major government contract announcements or large ARR renewals (timing variable).
- Product/feature releases and cloud partnerships (ongoing).
9) Final recommendation and risk positioning
Operational recommendation: Hold .
Time horizon: medium term (12–24 months) to monitor growth consolidation and margin confirmations.
Risk/return profile: High risk / potentially high reward — elevated valuation creates meaningful downside if growth slows; upside depends on sustaining high growth and margins. Risk‑tolerant investors who believe in Palantir’s AI/commercial momentum may hold or take a partial position with risk controls; risk‑averse investors should avoid new purchases until valuation normalizes.
10) Sources and data date
Main sources: Palantir Investor Relations (SEC 10‑K / 10‑Q / earnings releases), TradingView, public research notes. Data date: 22 September 2025. Assumptions: market cap ~428B; close price 22‑Sep‑2025 = 179.33 USD; shares outstanding = 2.365B.

TATA MOTORS VALUATION ANALYSIS
🌺Conclusion🌺
Fair value: ₹1,370/share (DCF, FCFF).
Upside vs ~₹676: ~+100%.
Why: 12% growth, margin normalization to 13%, capex glide to 6%, revenue‑weighted global ERP yielding WACC ~11.1%, terminal growth 4.3%.
💁🏻DCF (FCFF) Highlights🌸
Framework: 5-year FCFF + Gordon terminal.
FCFF ramp (₹Cr): 6,541; 20,072; 34,252; 38,362; 42,965.
Assumptions: EBITDA 11.5%→13.0%; D&A ~5.3% of revenue; capex 9.0%→7.5%→6.0%; ΔWC base 0; tax ~18.9%.
Bridge: PV(FCFF) ~₹0.96–0.98L Cr; PV(Terminal) ~₹4.05–4.15L Cr; EV ~₹5.01–5.13L Cr; less net auto debt ₹13,500Cr; equity ~₹4.88–4.99L Cr; per share ₹1,360–₹1,380.
🧐Other Valuation Lenses 🌸
JLR: EV/Sales ~0.7–0.9x or EV/EBITDA on normalized 10–12% margins (discount to luxury peers).
India CV: EV/EBITDA ~6.0–7.5x mid‑cycle.
India PV/EV: EV/EBITDA ~10–12x normalized; use EV/Sales when EBIT soft.
🤔Scenarios (Per‑Share)🤔
Best (EBITDA 13.5–14.0%, capex faster to 6%): ₹1,520–₹1,620.
Base (EBITDA 13.0%): ₹1,360–₹1,380 (headline ₹1,370).
Worst (EBITDA 10.0–11.5%, capex slower to 7%): ₹1,180–₹1,280.
⭐Key Drivers⭐
JLR premium mix (Range Rover/Defender), tariff/FX normalization, China retail.
India PV discounting vs ASP/mix; EV unit economics scale-up.
CV cycle durability; pricing discipline.
Capex cadence and working capital behavior driving cash conversion.
✨Key Numbers✨
WACC ~11.1% (revenue‑weighted ERP, β≈1.30).
Terminal growth 4.3%.
Shares ~3.68B; net automotive debt ₹13,500Cr.
:it's not buy/sell recommendation this report is for info

Bitcoin’s Power Law Curve — Fairly Valued With Room to RunThis chart applies a Power Law Rainbow Model to Bitcoin using a long-term logarithmic regression fitted to BTC's historical price action. Power laws are mathematical relationships often found in nature, science, and network systems — and Bitcoin is no exception.
Rather than relying on arbitrary trendlines, this model fits a curve based on the equation:
Price = a × t^b
Where:
t is the number of days since inception
a and b are constants optimized to Bitcoin's growth
Bands represent log-scaled standard deviation zones from the curve
🌈 Interpreting the Chart
The center white curve reflects Bitcoin's "fair value" according to its adoption-based trajectory.
Colored bands represent ±1σ, ±2σ, ±3σ from the model, creating a "valuation rainbow."
Historically, Bitcoin's cycle bottoms have touched the lower bands (blue/purple), while euphoria tops align with the upper bands (orange/red).
✅ Current Outlook
BTC is trading just under the fair value curve , suggesting it's fairly valued or slightly undervalued from a long-term perspective.
This position has historically preceded major upside moves, especially in post-halving environments.
From a Smart Money Concepts angle, we're in a potential accumulation or markup phase , with institutional and informed capital likely already positioning.
🧠 Why Power Laws Work for BTC
Bitcoin adoption follows network effects — more users = more value — which naturally follows a power law.
Unlike linear trends, power law curves scale with time , making them ideal for modeling exponential assets.
They offer a more objective long-term valuation framework , avoiding emotional cycle chasing.
⚠️ Disclaimer
This is not financial advice . The model reflects historical behavior and is a tool to support long-term perspective — not short-term prediction. Always do your own research and risk management.


6B Swing Short Swing short, COT - Valuation - Supply and Demand.
Been waiting a long time to short the pound..


HEG Limited Stock Analysis [Fundamental+Technical]Company Overview:
Industry: Graphite Electrodes (used in Electric Arc Furnaces for steel production)
Parent Group: LNJ Bhilwara Group
Location: Largest graphite plant at a single location near Bhopal, MP
Global Reach: 67% export-based; presence in 35+ countries
Business Highlights
Products: UHP & HP Graphite Electrodes
Customers: Top 25 global steel companies
Capacity: Increased to 100,000 TPA in Nov 2023
Utilization: 81% (despite global slowdown)
Revenue from Operations: ₹2,394.90 Cr
Net Profit: ₹231.54 Cr (down 49% YoY)
EBITDA: ₹525.63 Cr (down 28% YoY)
EPS: ₹59.99
Net Cash Flow from Operations: ₹615 Cr (up from ₹114 Cr)
ROCE: ~7.2%
Return on Net Worth (RoNW): 5.63%
📈 Technical Insights:
Current Price: ₹474.60
50 EMA: ₹431.44 (support zone)
200 EMA: ₹429.40 (support zone)
Price is trading above both EMAs, indicating a bullish trend reversal.
Golden Cross formation (50 EMA crossing 200 EMA) recently occurred — a classic long-term bullish signal.
The stock bounced from ₹400 zone and now forming higher highs.
Key Strengths
One of the lowest-cost graphite electrode producers globally
Among top 5 global players (ex-China)
Strong relationships with major steelmakers
Backward integrated captive power: 76.5 MW
State-of-the-art technology and high R&D focus
Key Risks
Highly dependent on steel sector demand
Pricing pressure due to global oversupply and China's export surplus
Needle coke (key raw material) cost volatility
Current underutilization of capacity
Growth Triggers
Green Steel Push: EAF-based steel production expected to grow globally
Anode Powder Plant: ₹1,800 Cr investment in 20,000 TPA facility for EV battery anode materials; revenue expected from FY27
India’s EV & Steel Boom: Growing steel consumption (8.2% CAGR) and EV transition are long-term positives
SWOT Summary
Strengths:
Global presence, high export revenue, low-cost structure
Technological leadership
Weaknesses:
Profitability linked closely to global steel demand
Volatility in raw material prices
Opportunities:
EV market and EAF steel expansion
Threats
Competition from China, diversion of raw material to battery sector
Future Outlook
Near-term challenges due to soft steel demand
Medium to long-term outlook is strong, driven by:
Increasing EAF penetration
Global decarbonization policies
Strategic expansion into EV-grade graphite anodes
Analysis Based on Valuation + Chart
CMP:₹474.60
Fair Price Range: ₹600 – ₹1200(Using a conservative P/E range of 10 to 20)
Fair Value (DCF):₹1100+ (Based on 10% projected EPS growth over 5 years and a 12% discount rate.)
Support Levels:₹430 (EMA), ₹400 (price action)
Resistance Zones:₹490-500 (near-term), ₹600 (supply zone)
Disclaimer
The information provided in this report is for educational and informational purposes only and should not be construed as financial or investment advice. While every effort has been made to ensure the accuracy of data and analysis, no guarantees are made regarding future performance. Stock market investments are subject to market risks, including potential loss of capital. Please consult your financial advisor or conduct your own due diligence before making any investment decisions.

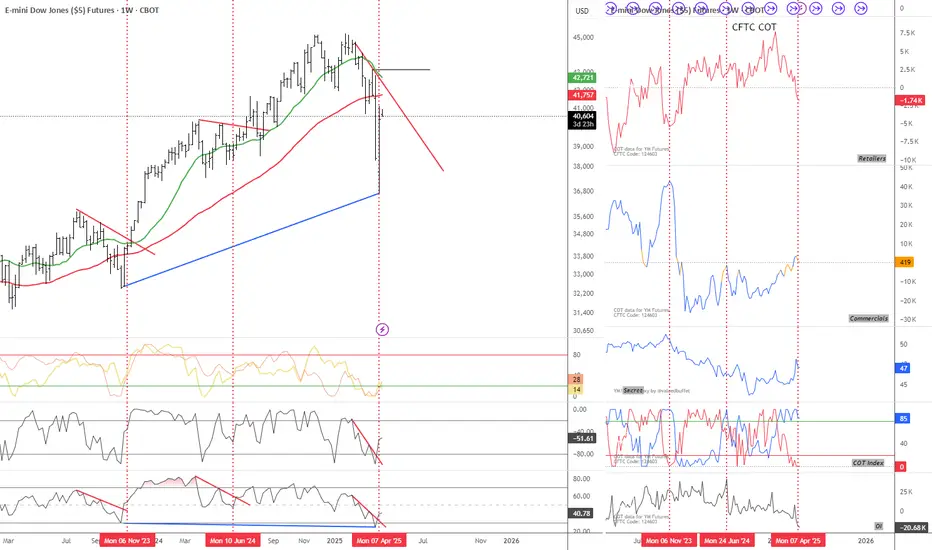
Is it going to happen again? My view to the markets right now...CBOT_MINI:YM1!
Is the Dow Jones breaking the downtrend again?
I believe there's a strong chance the markets are setting up for another move higher. From a fundamental standpoint, the recent pause in tariffs is a big deal. It removes an immediate layer of uncertainty that’s been hanging over the global economy, especially for exporters and multinational companies. On top of that, the fact that key tech products have been left out of the latest tariff actions is boosting confidence in the sector that has been leading market strength for years.
Economically, we’re still seeing resilience in key indicators. Unemployment remains low, consumer spending is steady, and central banks are staying cautious with tightening. The environment still leans more towards slow growth than recession, which supports equities over the medium term.
More importantly, my own criteria for a favorable market setup are lining up. Whether it’s sentiment, intermarket signals, or trend conditions—this looks like a solid spot for a bullish stance.
You can see my chart to check out my current viewpoint on the Dow Jones and how I’m positioning based on all this.
Not Financial Advice
Promising Breakout Setup Ahead! Chart 1W CBOT_MINI:YM1! BLACKBULL:US30
Promising Breakout Setup Ahead!
The chart highlights RSI and Williams %R trendline breakout plays. My strategy? Identify trendlines on the chart, monitor RSI and Williams %R, and target breakouts on these momentum indicators.
Current Situation:
All key signals have already triggered.
Strong bullish seasonality
Favorable COT data (small specs bearish, commercials bullish)
Low open interest
This setup aligns with high-probability breakout criteria.
Chart Indicator
SMA 1W 52 (red)
SMA 1W 18 (green)
Bottom Indicators
WilVal
Williams R% 9 length
RSI 9 length
Not Financial Advice
for more questions ask in the comments or
check my X @valuebuffet

$PYPL PAYPAL’S FINANCIAL LANDSCAPE: VALUATION & OPPORTUNITIESPAYPAL’S FINANCIAL LANDSCAPE: VALUATION & OPPORTUNITIES
1/8
PayPal ( NASDAQ:PYPL ) has been on the move lately—announcing a FWB:15B buyback and posting mixed but intriguing earnings results. Let’s dive into what’s making this fintech giant tick! 💳💡
2/8 – Recent Revenue Growth
PayPal’s revenue soared during the digital payment boom but has moderated recently.
Although the exact figures aren’t in the latest posts, growth since 2017 is substantial.
Stabilization might indicate a new normal in digital payments.
3/8 – Earnings & Guidance
Some quarters saw EPS pop by 61%—pretty impressive! 🚀
Mixed guidance ahead: margin expansion concerns and flat-to-down cash flow.
The FWB:15B buyback suggests management sees long-term potential.
4/8 – Valuation vs. Peers
Forward P/E near 10, PEG ratio of 0.52—that’s cheap compared to Visa/Mastercard.
PayPal straddles fintech + payments, competing with everyone from Square ( SET:SQ ) to Apple Pay.
Lower growth vs. some peers, but strong operating margins help PayPal stay ahead.
5/8 – Risk Factors
1️⃣ Regulatory: New rules could cramp expansion.
2️⃣ Market Saturation: Need emerging markets to fuel next leg of growth.
3️⃣ Competition: Stripe, Apple Pay, & countless fintech upstarts.
4️⃣ Tech Disruption: Blockchain, AI, or next-gen payments could reshape the landscape.
6/8 What’s PayPal’s biggest near-term challenge?
1️⃣ Regulatory Hurdles
2️⃣ Competition
3️⃣ Market Saturation
4️⃣ Tech Disruption
Vote below! 🗳️👇
7/8 – SWOT/SCOT
Strengths: Massive user base, recognizable brand, buyback confidence.
Weaknesses: Slowing user growth, uncertain future margins.
Opportunities: Emerging markets, strategic partnerships, AI integration.
Threats: Fierce competition, cyber risks, evolving payment tech.
8/8 – Your Next Move?
PayPal’s at a pivot—undervalued or a value trap? 💰
Let’s see if NASDAQ:PYPL can keep up the momentum!
#PayPal #Fintech #DigitalPayments #PYPL #Investing #Earnings #Valuation #Finance

$NKE Nike, Inc is finally back to CHEAP-ENOUGH levelsMany years ago I had drawn this 1.7-1.3 level in the PSR (or Price-to-Sales Ratio) for NYSE:NKE and the recent smack down for NYSE:NKE stock has put it within reach of the 1.7-1.3 X Sales zone.
The RETURN for shareholders has been negative for the last 7 years in NYSE:NKE when adjusted for inflation. The stock is basically unchanged back to 2018 here (not factoring dividends).
What is the point of this?
When a stock gets sold down on bad news, there is an underlying level of value which will support it from that point forward. There are always portfolio managers looking to invest in stocks that have had solid long term fundamentals with rising sales and earnings and a nearly recession-proof business model.
The opposite is also true that there are NO BUYERS for a stock once it gets ridiculously overpriced and no one can justify buying shares are high prices. The only hope you have at that point is for momentum to attract new buyers who aren't paying attention to valuation and because of tax laws that encourage people to hold on for long term capital gains tax rates to kick in for holding periods greater than 1 year.
Thanks to TradingView for providing all of this high quality fundamental information AND for the ability to graph this data so we can visualize and see where the value is in the marketplace.
The value is down here in NYSE:NKE shares so it is a good time to start buying.
Cheers,
Tim
3:47PM July 1, 2024 76.67 last +1.30 +1.72%

Wave of the day: Visa
5 good reasons for NYSE:V stock
1. Bounce from the value zone
2. Rising MACD histogram
3. Buying Volume coming in
4. Pocket Pivot on the last day
5. Analysts have set a mean price target forecast of 160.17. This target is 20.33% above the current price.
What's your take on Visa?Comment below
Legal Disclaimer: The information presented in this analysis is solely for informational and educational purposes only and does not serve as financial advice.

Soft landing calls for tough choices2023 has been a tough year for stock pickers. The gap between equity factor styles has been vast over H1. Growth, riskier in nature, posted the best performance up 24% year-to-date (YTD) followed closely behind by quality up 20% YTD1. The excitement around artificial intelligence (AI) reached a fever pitch in H1 2023, supporting growth-oriented technology stocks.
As we enter H2 2023, we remain constructive on select areas of global equity markets. The resilience of the US economy has defied all odds. The strength of the US consumer (accounting for 70% of GDP), alongside the fiscal impulse, has been the cornerstone of the US’ extraordinary resilience. While inflation has shown encouraging signs of decline in the US, strong economic momentum alongside a rebound in commodities raises the risk of a re-acceleration of inflation. In turn, rates could remain higher for longer, resulting in Federal Reserve (Fed) rate cuts being delayed until Q1 2024. In such an environment, an enhanced equity income approach could fit well. Even if the earnings outlook weakens in China, proactive policy support via rate cuts could support its stock multiples.
In Europe, where we are likely to witness a mild recession, we believe adopting a more cautious and defensive approach is warranted. Earnings revision ratios remain the strongest in Japan while they are the weakest in emerging markets.
US equities are the belle of the ball
It was the narrowest market in history, with just 25% of stocks outperforming the S&P 500. Expectations of cooling inflation aiding the Fed to end its current tightening cycle supported the performance of higher-duration growth stocks. For investors calling for a soft landing, rates are likely to remain at current levels or higher for a longer duration of time. A tight US labour market, with unemployment at historic lows and rising wages, is likely to slow the downward pricing momentum in the service sector. As the market regime transitions, it should provide a ripe opportunity for market breadth2 to improve. Markets may begin to favour value and dividend-paying stocks. History has shown us that breadth tends to improve as the economy recovers from a downturn.
Peak pessimism towards China
China’s reopening rebound has faded. The transition to a less debt-fuelled, less property-reliant and more consumer-driven economy is an important adjustment. We expect government stimulus policies to be aimed at enhancing the efficiency of the private sector. Further iterations of policy rate cuts by the People’s Bank of China (PBOC) are likely to follow; however, outright quantitative easing won’t be on the cards, as it is likely to further weaken the yuan, which the PBOC would like to avoid. With a low correlation to US equities (at 20x P/E)3 coupled with a high valuation discount, pockets of China continue to provide good investment prospects.
Pockets of opportunity in non-state-owned enterprises
Non-state-owned enterprises, particularly within the Technology, Communication Services and Health Care sectors, faced the brunt of China’s regulatory crackdown. These regulatory interventions stifled growth in key sectors such as e-commerce, mobile payment, ride-hailing, and online education. It also resulted in the suspension of initial public offerings (IPOs) and delisting of Chinese internet companies. Growing political frictions in supply chains are incentivising China to regain independence in the semiconductor and hardware space. Chinese technology companies are trading at a significant discount compared to US peers, offering plenty of room to catch up.
Prefer defensives over cyclicals as Europe runs out of steam
Nearly six months back, investors marvelled at how the euro-area economy had emerged from the energy crisis. That momentum appears to be fading as China’s recovery slows down, consumer confidence declines, and the impact of tighter monetary policy gains a stronghold on the economy. Higher inflation over the past year is holding back demand from households, which is hurting growth.
The monetary tightening over the past year not only triggered an increase in real rates, it also impacted borrowers’ credit metrics. Owing to this, eurozone banks have tightened their lending standards.4 Banks remain the primary source of corporate funding in Europe. The credit impulse—that is, the annual change in the growth of credit relative to GDP—in the euro area reached its lowest point since 2010.
TINA is alive in Japan
There is no alternative (TINA) to equities is still alive in Japan. This is evident from higher equity risk premiums of 2.97% for Japan compared to 0.41% in the US.5 While the rest of the world has been busy trying to quell the inflation fires, Japan has emerged from the COVID-19 lockdowns with a faster pace of growth and higher inflation. A combination of higher equity risk premiums, a weaker yen supportive of the Japanese export market, corporate reforms, and attractive valuations have been important catalysts for equities.
Policy shift still remains loose
The Bank of Japan (BOJ) took a significant step towards normalisation in July by announcing a further adjustment to its yield curve control (YCC) regime. The BOJ formally changing its course constitutes an acknowledgement that inflation is returning to the Japanese economy. Yet the BOJ lowered its (median) inflation forecast for fiscal year (FY) 2024 to +1.9% and left its FY 2025 projection unchanged at +1.6%, in effect justifying ongoing easing by the BOJ. With Japan’s nominal growth rising over the coming years, the revised policy by the BOJ still remains loose, supporting the case for Japanese equities. Historically, a weaker yen has benefitted the performance of Japanese exporters as it enhances their competitive advantage. Adopting a tilt towards dividend-paying Japanese equities is likely to reap the benefits of not only a weaker yen but also corporate governance reforms.
Conclusion
As we progress into year-end, the outlook remains more nuanced. In the US, we favour value and dividend stocks as equity market breadth improves. While China’s problems in the housing sector are likely to remain a drag on domestic demand, we do see pockets of opportunity in undervalued sectors – technology and healthcare. Given the strong manufacturing headwinds facing Europe, we expect weak growth in the eurozone for the remainder of 2023, potentially favouring a tilt towards defensive stocks.
Sources
1 Bloomberg as of 11 October 2023.
2 Breadth is measured by comparing the equal weighted performance versus the market cap-weighted performance of the US stocks listed on the S&P 500 Index.
3 P/E = price to earnings ratio.
4 Euro area Bank Lending Survey (BLS), April 2023.
5 Bloomberg, WisdomTree, as of 29 September 2023. Equity risk premium is the difference between the earnings yield and the respective 10-Year Government Bond Yield.
This material is prepared by WisdomTree and its affiliates and is not intended to be relied upon as a forecast, research or investment advice, and is not a recommendation, offer or solicitation to buy or sell any securities or to adopt any investment strategy. The opinions expressed are as of the date of production and may change as subsequent conditions vary. The information and opinions contained in this material are derived from proprietary and non-proprietary sources. As such, no warranty of accuracy or reliability is given and no responsibility arising in any other way for errors and omissions (including responsibility to any person by reason of negligence) is accepted by WisdomTree, nor any affiliate, nor any of their officers, employees or agents. Reliance upon information in this material is at the sole discretion of the reader. Past performance is not a reliable indicator of future performance.

SkyWest (SKYW), Valuation Chart for InvestingLooking at the average analyst target and Anchor for NASDAQ:SKYW I see some potential downside in the near future that could present some buying opportunities. The company has been one of the only Airlines that I am willing to invest in at the moment.
Overall, SkyWest has had a mixed earnings growth trend over the past 4 quarters. The company has reported both positive and negative earnings growth during this time period. The company's earnings growth trend is likely to be affected by a number of factors, including the overall economic environment, the performance of the airline industry, and the company's own operational performance.
This also should provide great opportunities to buy in... Fundamentals are looking good.

Valuation Chart for AMD, Average Analyst Targets and ForecastsFor those that believe that some how AMD will magically stay at these levels, please keep in mind, the average analyst target is $103.43. On top of that, I believe the company is Anchored at lower prices based on projected earnings growth and cost of equity. This stock will revisit lower levels once again.

Inflection PointBKI caught my attention for a few reasons.
1. Held by Scion Asset Mngt- if you haven't heard of them or Michael Burry, check it out. Crazy returns off the financial Crisis.
2. SP sitting at an inflection point at bottom of long term demand zone and near lowest long term demand zone.
3. BKI's shiller PE ratio range over the past 10 years is from 36.26-43.09 and currently sitting at 37.37 implying that it is near its lowest valuation in 10 years.
4. Mornings Star Fair Value market valuation sitting at $61.1. My own target of $77.5 is based on a Fibonacci retrace of 61.8% of 2020 highs.

Applying Warren Buffett and Peter Lynch valuations : SNAP stockWhen I was new, I traded just the picture of prices.
Later after living through a full cycles, I learned stocks were actually businesses.
Business sell stuff to customers and generate revenue each year.
Businesses have cash flows and earnings.
Thats why when we look book 10 to 20 years, most businesses are more valuable today then back then.
Valuation looks at what things are worth today and also looks at future potential.
Financial math is discounting the the future growth to make sure you get the best deal you can.
Valuation keeps you grounded.
You can still day trade, swing trade, and option trade all you want. Valuation just helps you know the true value inside the business so you avoid some losers and pick more winners.
Cheers and good luck on your journey!
#snap #warrenbuffett #peterlynch

Momentum vs Business Valuation"The momentum guys take it up to the moon,
the value guys pick it up off the floor.
Just watch out for the space between the two."
-Confucius the trader
have been reading up on the Turtle Traders and their momentum strategy. They would have bought anything as long as it meets their break out rules. Fascinating statistical strategy based on both 20 period price action and 55 day price action. Im sure they love the action in NVDA right now.
However, in the valuation books. The oldies but goodies books (Intelligent Investor by Benjamin Graham, Beating the Street by Peter Lynch) they would be less enthusiastic about the current valuation. Most useful would be Peter Lynchs PEG ratio, where growth rate is used to allow paying a higher price than normal for growth stocks.
The roughly 30% growth rate annual expectation in this case would mean if NVDA falls below 30pe, it would be attractive. Its almost twice that now. Thats not necessarily a reason to sell a quality stock. it just means that investors have already market up the stock and are buying it ahead of the future growth being expected. In this case, 2026s future growth.
Traders gonna trade. They dont care about the future value of a stock. they care about Profit this week or this month and then on to the next one.
however the investors do care. They are looking for getting a deal on something that can swell up with earnings and juicy future value dividends. Investors want a discounted price today, and 20 years of accumulated earnings so they can milk the future dividend payouts.
Any who, just watch out and be aware. Its a fast horse, its also a popular one.

Robert Kiyosaki & Peter Schiff right -Hard times make strong menXLF financials, Stocks to GDP and stocks to gold, all tell the story.
Our debt based system is bottlenecked. More money is 'needed'.

Valuation is the light when the stock market is full of darknessthe market only goes 2 ways, up and down, and yet it can still be difficult to see through the noise.
I used to just look at charts, and trade off of the pictures. boy was I a fool.
turns out stocks are businesses. if you knew that, you should have told me sooner :D
valuation changed my life.
on dark days like today, the market is falling and its feels scary and red and bad and scary and omg.
but it has to be this way.
this is how you get the 10 baggers or the 100 baggers the grow over the next decades.
yeah the market can go down 50%.
guess what, the storm will pass.
and then business and life will go on.
and companies will grow a little bit every month and every quarter.
whats 20% compounding for 10 years? do you even math bro?
its hard.
learn.
you can do it.
kthanxbye
