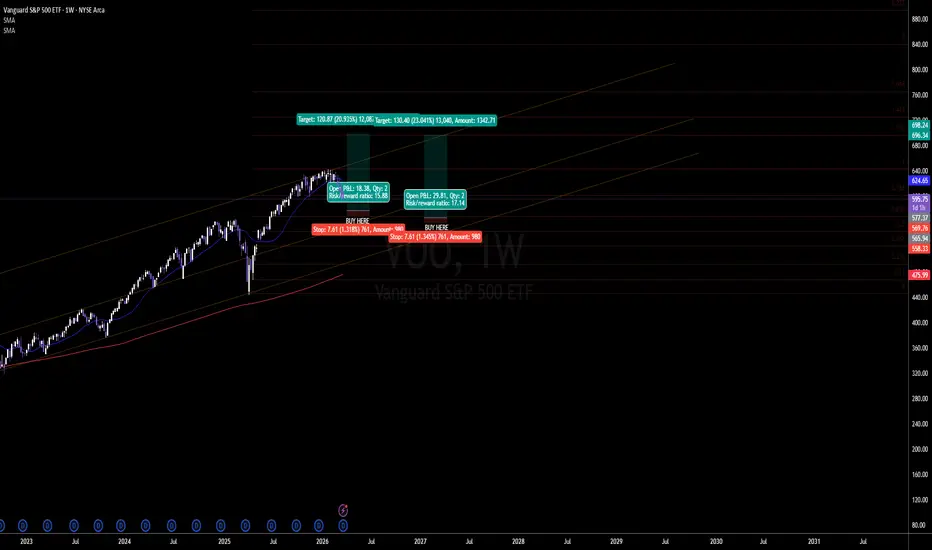
$VOO America's Index. War Discount. Two Weekly Buy Zones Plotted📊 The S&P 500 is down approximately 5% year-to-date. The Iran war drove Brent crude past $120 per barrel, spooked the Fed into holding rates, pushed the Dow to fresh 2026 lows, and triggered a rotation out of growth stocks and into defensives.
VOO, which tracks every single one of those 500 companies, is sitting at a weekly demand zone with two clean entries mapped.
History is unambiguous on this. The S&P 500 has delivered a compound annual return of 10.6% since its inception in 1957. Every
Vanguardsp500
US500 potential move to the downsideMarket sentiment has been negative with fears of the hard recession approaching. I've been looking for short opportunities in the market because of this and spotted this setup
UShort
Comparing Vanguard to BTC In both of these charts, you can see the correlation between 2 sectors that had if not IDENTICAL run ups due to their nature of being overbought and unregulated. (housing crisis of 08 vs Crypto crisis of 2022)
As of now we are still on our path downwards. The housing crisis took until Nov 2007 to late 2009 to start on the path of recovery. We know cryptocurrency is here to stay and the technological advances in our payments systems and the way we book keep and communicate will eventually if not
$VUG indicators bullish | Possible run up to 160's$VUG
Seeks to track the performance of the CRSP US Large Cap Growth Index.
Provides a convenient way to match the performance of many of the nation’s largest growth stocks.
Follows a passively managed, full-replication approach.
investor.vanguard.com