#VETUSDT A Key Support Zone Could Unlock Further Upside#VET
After moving sideways from June until early September, VeChain (VET) managed to break out of its consolidation range and enter an upward trend, supported by a key support zone around $0.004000.
Currently, the price has returned to retest this important support area, where another bullish rebound is anticipated. This could lead to the formation of an ascending consolidation range, potentially supporting further upward movement toward the target of $0.006184.
Expected Price Target: $0.00
Vetusd
WARNING: VET has completed a bullish pattern! (4H)VET appears to have completed a bullish diametric pattern, with the final wave ending in a truncation. This type of ending can be an early sign that buying momentum is weakening and selling pressure is starting to increase.
For now, I’m watching the red zone closely. If price makes a pullback into this area and shows a proper rejection, we can start looking for a potential sell/short setup.
The main targets are marked directly on the chart, so I will be monitoring price action around these lev
$VET Potential to 3800% Bullish Rally in This Altseason?NYSE:VET Down ~97% From ATH: Is This A Macro Accumulation Opportunity With 3800%+ Potential Upside?
#VET Has Perfectly Reacted From Its HTF Bullish Order Block And Is Now Trading Above A Major Macro Accumulation Zone.
After years of correction and consolidation, VET is approaching a potentially important structural inflection point. The current setup offers a clearly defined invalidation level with significantly larger upside potential if the macro breakout confirms.
Technical Structure
✅ Pr
VET - Trade ActiveThe correction is complete and the entry has triggered.
Price broke the descending trendline off the September high — the line that capped every rally for the past year. That's the confirmation we were waiting for.
Wave Y bottomed at 0.004256. That's our invalidation, and it's the only level that matters on the downside.
Targets stacked above:
- 0.04
- 0.08
- 0.12
- 0.27 longer term
Impulse. Correction. Next impulse. We're in the third part now.
Invalidation: a close below 0.004256
Goodluc
VET - Over 3000% Potential!VeChain ran a clean impulse off the 2020 low into the April 2021 top at 0.28.
Everything since has been one correction. Five years of it.
That correction has now completed at 0.0043 —Price is up over 30% in seven days.
Impulse. Correction. Next impulse. That's the sequence, and we're at the turn.
Why now?
- Hayabusa and StarGate replaced passive VTHO rewards with staking. VET has to be locked to earn, and gas is burned in full — inflation cut roughly in half
- The Interstellar upgrade passed
VET is really bullish! (12H)First of all, pay attention to the timeframe the timeframe is hourly and higher, so it requires time to play out.
A key mid term trigger line has been broken, and VET is continuously forming higher lows on the chart. We also have a bullish change of character (CH), and the recent drops can be considered internal pullbacks.
The entry zone has been defined enter positions using DCA within this range. Considering the distance between the entry zone and the invalidation level, make sure to manage
VET/USDT 1D — Descending Channel Breakdown or Reversal Setup?The VET/USDT 1D chart shows a clear bearish trend over the past few months, with price consistently moving within a descending channel. Currently, price is approaching the upper boundary (channel resistance), which is a critical area to determine the next direction.
---
Pattern: Descending Channel
This pattern is characterized by:
Lower Highs (LH) → red resistance line
Lower Lows (LL) → yellow support line
This structure indicates strong selling pressure, but it can also become a potenti
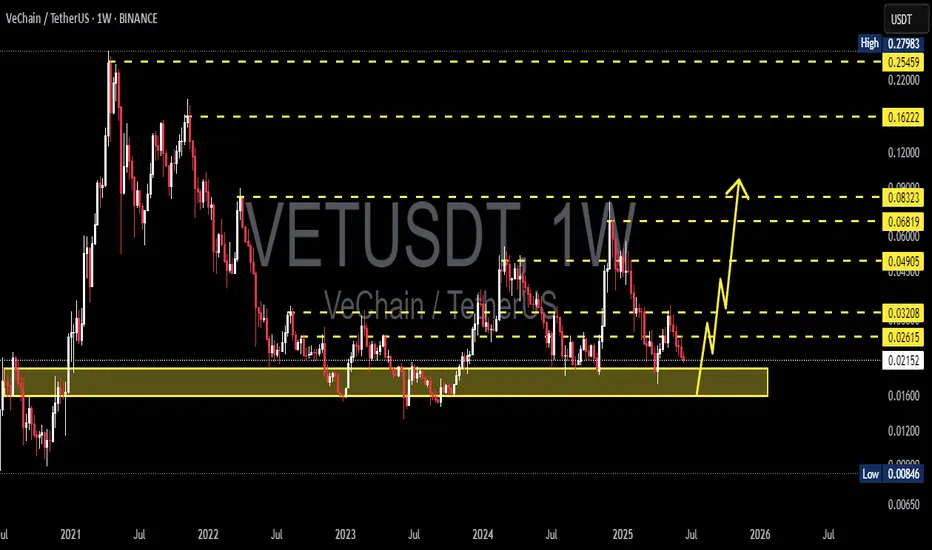
VETUSDT Approaching Demand Zone – Massive Rebound Potential?The VET/USDT weekly chart shows a long-term downtrend after reaching its bull market peak in 2021. Since then, price has formed a series of Lower Highs and Lower Lows, indicating bearish dominance on the higher timeframe.
Currently, the price is trading around $0.007, approaching a very strong macro support zone that previously acted as a major accumulation area during 2019–2020.
The zone marked by the yellow block ($0.0033 – $0.0026) represents a major demand zone / support block, which histo
VET/USDT at a Demand Zone – Major Reversal or Breakdown?VeChain (VET/USDT) is currently at a major long-term decision zone. Price has declined and is now retesting a strong historical demand area, highlighted by the yellow block between 0.01225 – 0.00965.
This zone previously acted as a major accumulation base and triggered several strong bullish impulses in the past.
From a macro perspective, the market structure is still bearish (lower highs – lower lows) since the 2021 ATH. However, current price positioning is within a low-risk, high-reward area
#VET Ready for a Major Bullish Move | Key Levels to Watch Yello, Paradiser! Is #VeChain about to trap all the late bears, or are we about to witness one more brutal shakeout? Let's view the #VETUSDT trading setup:
💎#VET is currently trading around $0.0116 on the 1D timeframe, and just completed a breakout from a textbook Falling Wedge, one of the most reliable bullish reversal patterns when combined with confirmation signals.
💎The breakout has already occurred, and most importantly, it is now retesting the descending resistance to validate this break
A letter to myself. (Buy the dip)This is phase one of a global technological financial system. If our parents even parked a fraction of their cash here 10–20 years ago the long-term payoff would have been nice, but they didn't and it's okay because they didn't know. We now have the privilege of choosing to contribute to our financial future in ways that were previously out of reach for everyday people because we couldn't even fathom the future the internet is today.
This data from the adoption curve theory further supports tha
VETUSDT – Reaccumulation or Breakdown? Market Will Decide Here!VeChain (VET) has once again returned to its historical multi-year support zone, a level that has consistently acted as institutional accumulation territory around $0.012 – $0.017.
Every touch of this zone in the past has triggered massive bullish reversals, leading to multi-fold rallies. Now, VET stands at this critical juncture once again — and how it reacts here could determine its direction for the coming months.
The latest weekly candle shows a long downside wick, signaling strong buy-side
Is #VET Ready for Massive Bullish Rebound or Not? Watch CloselyYello, Paradisers! Is #VET setting up for a breakout play, or are we about to witness another classic bull trap unfold? Let’s dig into what the chart is telling us on #VeChain:
💎After climbing steadily inside an ascending channel, #VETUSDT is now approaching a major resistance zone around $0.02–$0.02. A confirmed breakout above this area would significantly boost the probability of a bullish continuation, especially with the 50EMA providing dynamic support from below.
💎The immediate support zo
Traders watch VeChain 20% upside targeting $0.031 soonHello✌️
Let’s analyze VeChain’s price action both technically and fundamentally 📈.
🔍Fundamental analysis:
VeChain just kicked off its StarGate program with $15M in rewards for staking 10K+ VET.
It’s moving to a Weighted Delegated Proof-of-Stake system and burning all base fees to cut $VTHO supply.
Less selling pressure and a 5.48B $VTHO burn could make VET scarcer, but results depend on network growth. 🔥📊
📊Technical analysis:
BINANCE:VETUSDT demonstrates solid trading volume, support
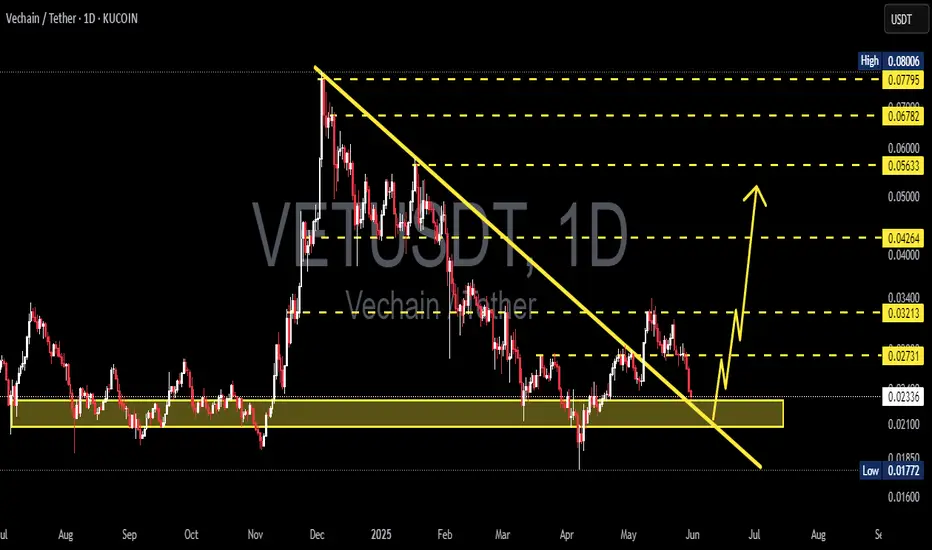
VET/USDT – Golden Pocket Retest After Breakout!🧠 Overview: Is VeChain About to Flip Bullish?
The 2D VET/USDT chart (KuCoin) is presenting a high-potential setup. After months of downward pressure, VET has finally broken above a long-standing descending trendline, which has been intact since early 2025.
Now, price is retesting a major support zone—which also happens to be the Golden Pocket of the Fibonacci retracement (0.5–0.618). This area is crucial for confirming whether this is a real trend reversal or just another fakeout.
---
🧩 Tech
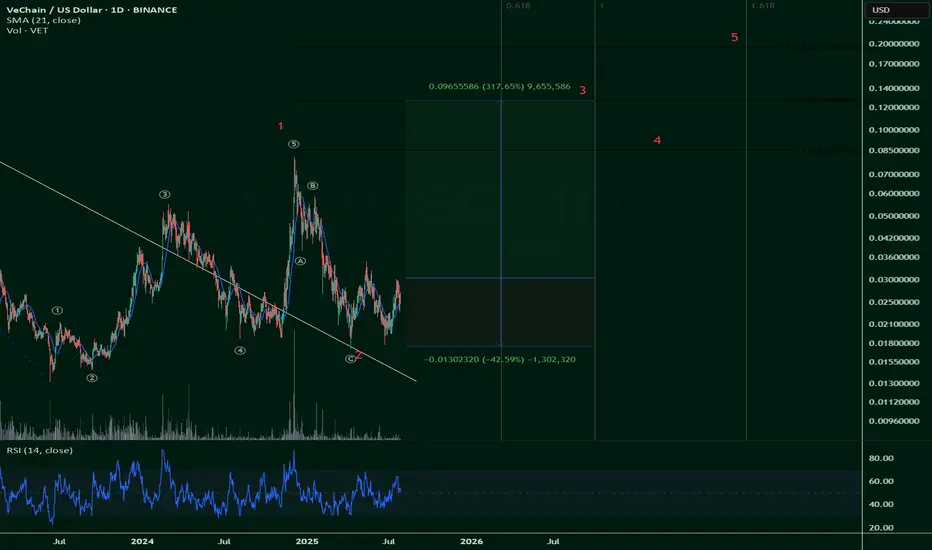
$VET Vetchain - A very generous Bullish scenario (ShortTerm)NOT FINANCIAL ADVICE
This is a very generous idea that considers the bullish scenario for $VET.
The risk/reward ratio is 7.5 (317% upside vs42.5% downside).
However, this is only due to the really high beta that NYSE:VET posits.
It's a risky trade, sure, but the rewards are sweet -- if this plays out.
V
Check if it can break through 0.03779-0.04757 at once
Hello, traders.
If you "Follow", you can always get new information quickly.
Have a nice day today.
-------------------------------------
(VETUSDT 1W chart)
Support zone: 0.00440-0.101741
Resistance zone: 0.03779-0.04757
If it breaks through the resistance zone upward and maintains the price, it is expected that a step-by-step uptrend will begin.
Therefore, it is important to check whether there is support around 0.03779-0.04757.
-
(1D chart)
The key is whether it can maintain the price
VeChain: Struggling…VeChain is struggling to stay above the key support at $0.018, but the anticipated low of the orange corrective wave ii should form above this red line – or may have already done so. Once the bottom is indeed settled, we expect the orange wave iii to break out impulsively, pushing well beyond the $0.08 resistance, where the entire orange five-wave move should ultimately complete the blue wave (iii). However, if VET falls below $0.018, the broader green wave alt. will reach a new bear market low
V