US 500 – Signs of Fatigue After a Strong Recovery?It’s been an edgy start to December for the US 500 index, a month which is historically one of the strongest. Part of the reason could be that the last 7 trading days of November saw a 5.3% rally from lows of 6508 (Nov 21st) to 6852 (Nov 28th) as markets reacted positively to more dovish commentary from Federal Reserve policymakers, which revived the possibility of a final Fed rate cut at their last meeting of the year on December 10th.
Now Fed speakers are in the blackout period before that meeting where they are banned from publicly discussing current policy and it suddenly feels like a long time to wait to hear the outcome of their deliberations, especially with the US 500 sitting a mere 2% from its record highs of 6925 set on October 30th.
Traders also must contend with a busy data schedule across this week, and it didn’t get off to the best start with yesterday’s US ISM Manufacturing PMI survey showing activity falling further into contraction territory (below 50), with sagging order books and higher prices being paid.
However, while manufacturing activity is important to the US economy, by far the biggest driver is services and the ISM Services PMI survey is due for release tomorrow at 1500 GMT. Last month’s reading sat comfortably in expansion territory (above 50) and US 500 traders will be looking to judge this new release against the previous month. Any disappointment could weigh on sentiment and vice versa.
The available updates on the US labour market could also be important as they could impact the Fed rate decision next week. The ADP monthly private sector payrolls is released tomorrow at 1315 GMT, with the Challenger job cuts due Thursday at 1230 GMT and weekly jobless claims due at 1330 GMT. The shock weaker Challenger job cuts reading last month initiated some extra US 500 volatility and it will be interesting to see if this happens again.
The technical backdrop is also potentially crucial going into such a critical period and the current assessment can be seen below.
Technical Update: Signs of Fatigue After Strong Recovery?
The US 500 index has staged an impressive recovery of more than 5.3% since the November 21st low, as recent price weakness once again found dip buyers. This pattern has been a consistent feature in US equities for some time. However, as the chart below highlights, the latest upside move in price has yet to achieve a close above the potential resistance defined by the October and November highs.
This may be seen by some as the latest buying failing to breach a previous price peak, thereby disrupting the pattern of higher highs and higher lows. In other words, a possible sign of slowing upside price momentum.
Of course, this does not necessarily signal the end of recent price strength. However, it may remain prudent to monitor both support and resistance levels closely, as doing so may help clarify whether the latest activity reflects a slowing of upside momentum that could lead to renewed weakness, or simply a pause in the advance before fresh price strength emerges.
Potential Resistance Levels:
As strong as the rally from the November 21st low appears, it currently remains capped below 6880, the November 12th session high. As the chart below highlights, this 6880 level represents the last recovery high and failure point, where selling pressure was sufficient to reverse the price advance back to the downside. Traders are therefore possibly viewing 6880 as the first potential resistance level to the current rally.
While not a guarantee of continued upside, closing breaks above 6880 may be interpreted as a sign of price strength resuming. If this proves to be the case, closes above 6880 could pave the way for attempts to challenge 6925, the October 30th session high, with possibilities for further gains should that level also give way on a closing basis.
Potential Support Levels:
If resistance at 6680 continues to hold, traders may begin to suspect that upside price momentum is slowing, which in turn could see renewed selling pressure. At the same time, attention may shift to 6751 as the first support. This level is equal to the Bollinger mid‑average.
While much will depend on future market sentiment and price trends, closing breaks below 6751 could open scope for further declines. Such moves, if seen, may lead to tests of 6722, the 38.2% Fibonacci retracement of the latest advance, and potentially even extend toward 6681, the deeper 50% retracement.
The material provided here has not been prepared accordance with legal requirements designed to promote the independence of investment research and as such is considered to be a marketing communication. Whilst it is not subject to any prohibition on dealing ahead of the dissemination of investment research, we will not seek to take any advantage before providing it to our clients.
Pepperstone doesn’t represent that the material provided here is accurate, current or complete, and therefore shouldn’t be relied upon as such. The information, whether from a third party or not, isn’t to be considered as a recommendation; or an offer to buy or sell; or the solicitation of an offer to buy or sell any security, financial product or instrument; or to participate in any particular trading strategy. It does not take into account readers’ financial situation or investment objectives. We advise any readers of this content to seek their own advice. Without the approval of Pepperstone, reproduction or redistribution of this information isn’t permitted.
Volatility

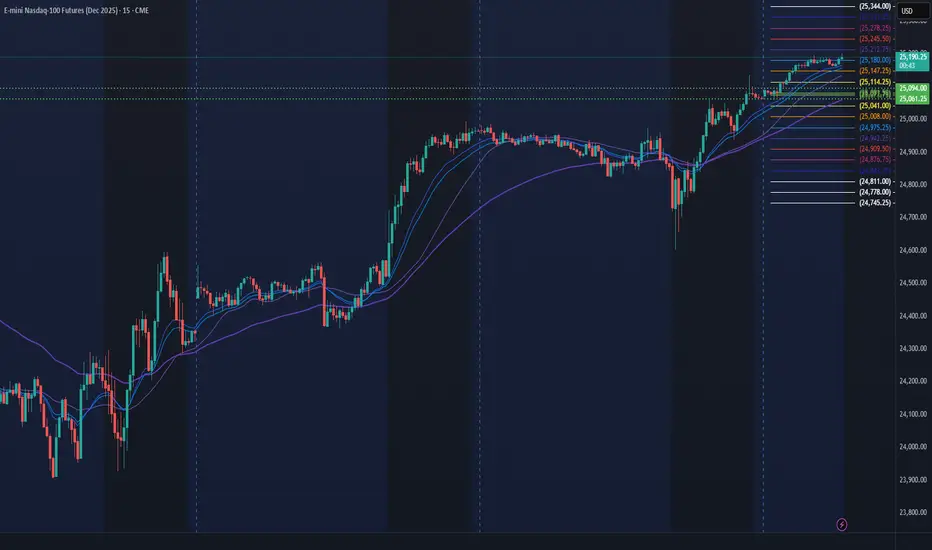
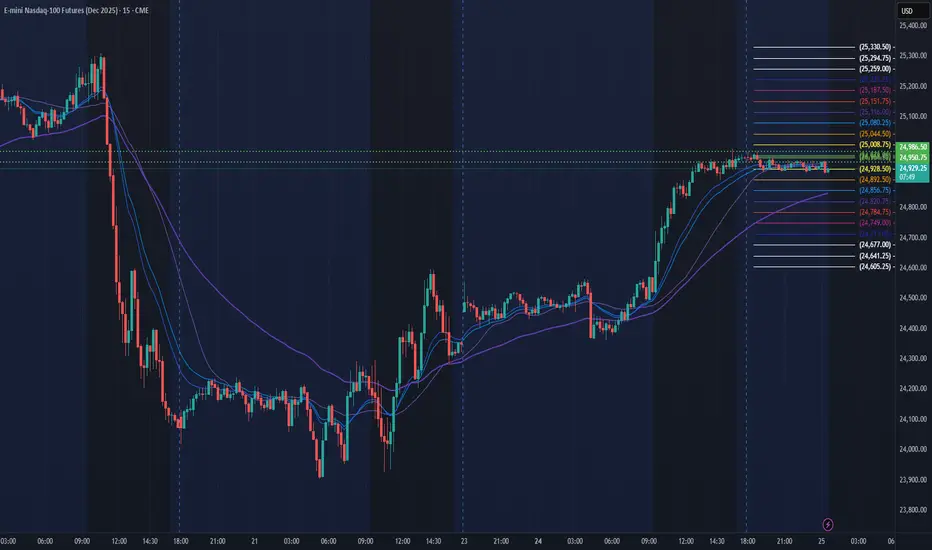
NQ Power Range Report with FIB Ext - 12/2/2025 SessionCME_MINI:NQZ2025
- PR High: 25425.00
- PR Low: 25378.50
- NZ Spread: 104.0
Key scheduled economic events:
10:00 | JOLTs Job Openings
Session Open Stats (As of 12:15 AM)
- Session Open ATR: 479.80
- Volume: 28K
- Open Int: 299K
- Trend Grade: Long
- From BA ATH: -3.7% (Rounded)
Key Levels (Rounded - Think of these as ranges)
- Long: 26636
- Mid: 25410
- Short: 23426
Keep in mind this is not speculation or a prediction. Only a report of the Power Range with Fib extensions for target hunting. Do your DD! You determine your risk tolerance. You are fully capable of making your own decisions.
BA: Back Adjusted
BuZ/BeZ: Bull Zone / Bear Zone
NZ: Neutral Zone

XAUUSD | Gold Signal |Dec 2,2025BUY TREND TARGET FOR TODAY 📊
The market is pricing in a near-certain rate cut in December. Dovish comments from Fed officials from Waller to Williams, coupled with weak manufacturing data, reinforce the argument that growth risks are rising faster than inflation risks. Gold reacted sensitively to this backdrop, with the dollar falling to a two-week low before recovering slightly. I believe the gold-silver market is entering a period of high volatility, but the bullish structure remains intact.
Rate cut expectations, a weaker dollar, and weak economic data continue to be the three main pillars supporting prices. However, rising bond yields and uncertainty over Fed leadership mean the rally could be interrupted in the short term. Powell’s speech this week will play a guiding role, especially on Q1 2026 interest rate expectations.1
Strategically, investors should keep a close eye on employment, PCE, and bond developments. In an environment where the monetary policy cycle is pivoting, gold plays the role of portfolio insurance, while silver continues to be the asset that responds most strongly to market sentiment and macro expectations, with higher returns but also greater risk.1% The main trend of gold remains bullish in structure.
♾️Gold BUY @ 4215- 4220
💰TP1 - 4225
💰TP1 - 4230
🚨Sl: 4210

Golden Liquidity Sweep & FVG Reversal [XAU/USD]OANDA:XAUUSD Golden Liquidity Sweep & FVG Reversal
Signal: BUY
Entry: 4,203.560
TP1: 4,236.765
TP2: 4,259.639
TP3: 4,280.000
SL: 4,189.322
Insights:
Price swept liquidity below 4,203.560 (red level) and tapped into the 0.618–0.705 Fibonacci zone, aligning with a Fair Value Gap (FVG) and high-volume node on VRVP.
RSI is rebounding from midline (50), MACD histogram shows bullish momentum building, and price is above the 50-period MA.
Market structure shows BOS to the upside, suggesting bullish continuation after liquidity grab.
#FVGReversal #LiquiditySweep #GoldScalpingSetup#HighRR #SmartMoneyConcepts #BreakoutMomentum
🌟 Trade Like Hunter (for professional edge)
✅ High-Probability Setup: Confluence of FVG, BOS, VRVP support, RSI bounce, and MACD crossover
📊 Risk-Reward Ratio: Approx. 1:2.5 to TP2, 1:4 to TP3
🔑 Liquidity Zone Confirmation: Entry aligns with swept liquidity and imbalance zone
🧠 Market Psychology: Accumulation phase post-sweep, breakout momentum expected
⚡ Probability Score: 80% High Probability
📈 Scalability: Setup aligns across H1 and H4 timeframes for intraday and swing potential
🔒 Risk Disclaimer: Always use proper risk management. Past performance does not guarantee future results.

How to Trade with Bollinger Bands in TradingViewBollinger Bands are a volatility indicator that helps traders identify market extremes, trend strength, and potential breakout setups by measuring how far price moves away from its average.
What You’ll Learn:
• Understanding Bollinger Bands as a volatility-based trading tool built around a moving average
• How the middle band represents the 20-period simple moving average (SMA)
• How the upper and lower bands are calculated as two standard deviations above and below that SMA
• Why expanding bands signal rising volatility — and tightening bands signal market compression
• Recognizing overbought and oversold conditions when price touches or moves beyond the upper or lower bands
• Why these signals aren’t automatic buy or sell triggers, and how to confirm them with other tools like RSI or MACD
• Identifying the “Bollinger Band squeeze,” a setup that often precedes major breakouts
• Spotting potential mean-reversion trades when price closes back inside the bands after moving outside
• How to add Bollinger Bands on TradingView via the Indicators menu
• Understanding the default settings (20, 2) and how adjusting the period or deviation affects sensitivity
• Practical examples using the E-mini S&P 500 futures chart
• Applying Bollinger Bands across daily, weekly, and intraday timeframes for volatility analysis and signal confirmation
This tutorial is designed for futures traders, swing traders, and technical analysts who want to integrate volatility dynamics into their trading approach.
The methods discussed may help you identify breakout conditions, trend continuation signals, and potential reversal zones across multiple markets and timeframes.
Learn more about futures trading with TradingView:
optimusfutures.com
Disclaimer
There is a substantial risk of loss in futures trading. Past performance is not indicative of future results. Please trade only with risk capital. We are not responsible for any third-party links, comments, or content shared on TradingView. Any opinions, links, or messages posted by users on TradingView do not represent our views or recommendations. Please exercise your own judgment and due diligence when engaging with any external content or user commentary.
This video represents the opinion of Optimus Futures and is intended for educational purposes only.
Chart interpretations are presented solely to illustrate objective technical concepts and should not be viewed as predictive of future market behavior. In our opinion, charts are analytical tools — not forecasting instruments.

Gold – Can the Recent Upside Momentum Continue?Gold rallied 3.7% or $150 last week from opening levels on Monday (November 24th) at 4069 to close on Friday (November 28th) at 4219 and in doing so registered its highest weekly close since the middle of October. An impressive rally indeed! The question now is, can this up move continue in December?
To start with, it must be said that since the late sell-off where prices hit a low of 3887 on October 28th, Gold has performed well during a period of broad leveraged risk reduction and dollar strength, two scenarios that can lead to enforced selling of an asset, like Gold, that has performed strongly across 2025. In fact, despite numerous tests of the 4000 level between November 18th and 21st, the shiny metal showed remarkable resilience.
With this price action in mind, it seems that many of the fundamentals supporting the Gold price rally through 2025 may continue to remain in place, namely, central banks buying dips to diversify from their holdings of US dollars, concerns over swelling debt burdens in the major developed economies, highlighted recently by the new stimulus package announced by Japanese PM Sanae Takaichi, as well as on-going issues in the US, France and UK.
Perhaps the most important driver for Gold traders to consider at the start of December could be what the Federal Reserve does regarding interest rates at their next meeting on December 10th. Recent more dovish comments from Fed policymakers over the last 10 days have led the market to currently price an 80% chance of a further 25bps (0.25%) rate cut, a big increase from the middle of November when it was just a 5% chance.
This rate outlook may face its first test early on Tuesday with Fed Chairman Jerome Powell due to speak at 0100 GMT. Although he is restricted from making comments on current policy due to the black out period, traders may react to anything he says that isn’t in line with their current thinking.
His speech is followed by updates on the health of the US labour market in the form of the monthly ADP Private Sector Payrolls which is released at 1315 Wednesday, closely followed on Thursday by the Challenger Job Cuts release at 1230 GMT, and the weekly jobless claims update at 1330 GMT.
How these important events shape the US interest rate outlook, alongside updates on Ukraine ceasefire negotiations and the technical trends, outlined below, could determine whether Gold prices push on towards all-time highs at 4381 or reverse back down to lower levels.
Gold Technical Update: Can Upside Resumption in Price Be Seen?
Since posting its 4381 all-time high on October 20th, Gold has entered a period of choppy sideways activity, as the over-extended upside conditions seen after the sharp price acceleration higher have been unwound.
However, the latest activity has been positive for the shiny metal, which includes posting the highest price (4256) since late October in a move that is now challenging the first possible resistance at 4245, which is the November 13th high.
Traders may be asking themselves if this marks the end of the consolidation activity, or as has proved to be the case in the past, is a limited upside move before further extension of the sideways activity is seen.
To help assess the next directional themes for Gold, it may be worth establishing the potential support and resistance levels to monitor in the week ahead.
Possible Resistance Levels:
After the latest price strength, it could be that the November 13th session high at 4245 is something of a pivot point for traders. Having found sellers around this level previously, they may be found again, so this could continue to be an important resistance focus.
While no guarantee of continued price strength, closing breaks above 4245 may lead to further attempts to develop an uptrend pattern, which in time could see a challenge of the 4381, the October 20th all-time high, and further if this is also broken on a closing basis.
Potential Support Levels:
While resistance at the November 13th high of 4245 continues to cap the current phase of strength on a closing basis, the risk remains that Gold’s choppy sideways activity could persist.
If 4245 holds, fresh weakness may emerge, with traders potentially watching 4098, a level marked by the rising Bollinger mid‑average as the next support. How this level is defended on a closing basis could determine whether consolidation gives way to further downside pressure.
Closing breaks below the support at 4098 could suggest continued declines towards 3998, the November 18th low and if this in turn gives way, it could even open the way for moves towards 3887, the October 28th downside extreme.
The material provided here has not been prepared accordance with legal requirements designed to promote the independence of investment research and as such is considered to be a marketing communication. Whilst it is not subject to any prohibition on dealing ahead of the dissemination of investment research, we will not seek to take any advantage before providing it to our clients.
Pepperstone doesn’t represent that the material provided here is accurate, current or complete, and therefore shouldn’t be relied upon as such. The information, whether from a third party or not, isn’t to be considered as a recommendation; or an offer to buy or sell; or the solicitation of an offer to buy or sell any security, financial product or instrument; or to participate in any particular trading strategy. It does not take into account readers’ financial situation or investment objectives. We advise any readers of this content to seek their own advice. Without the approval of Pepperstone, reproduction or redistribution of this information isn’t permitted.

NQ Power Range Report with FIB Ext - 12/1/2025 SessionCME_MINI:NQZ2025
- PR High: 25546.00
- PR Low: 25442.75
- NZ Spread: 230.25
Key scheduled economic events:
09:45 | S&P Global Manufacturing PMI
10:00 | ISM Manufacturing PMI
- ISM Manufacturing Prices
20:00 | Fed Chair Powell Speaks
Session Open Stats (As of 12:15 AM)
- Session Open ATR: 508.34
- Volume: 65K
- Open Int: 298.K
- Trend Grade: Long
- From BA ATH: -4.3% (Rounded)
Key Levels (Rounded - Think of these as ranges)
- Long: 26636
- Mid: 25410
- Short: 23426
Keep in mind this is not speculation or a prediction. Only a report of the Power Range with Fib extensions for target hunting. Do your DD! You determine your risk tolerance. You are fully capable of making your own decisions.
BA: Back Adjusted
BuZ/BeZ: Bull Zone / Bear Zone
NZ: Neutral Zone

XAUUSD | Gold Signal |Dec 1,2025BUY TREND TARGET FOR TODAY 📊
☄️ GOLD (XAU/USD) H1 STRUCTURE BREAKDOWN: BULLS IN CONTROL ☄️
The market has decisively confirmed the trend reversal. After navigating the consolidation phase, the price action has established a strong, clear Bullish structure.
📊Key Observations
🔤Clear BOS: We have seen multiple Bullish Break of Structures (BOS), confirming that buyers are in complete control of the H1 timeframe. The initial structural resistance (4140-4150) has been cleared.
🔤Current Price Action: Price is currently pushing into the prior high liquidity zone (around 4220) and shows strong momentum, now trading near 4250.
🔤Unmitigated FVG: The most critical immediate Demand Zone lies around 4150 - 4160 (FVG/Order Block). This is the key zone the price may return to for mitigation before continuing higher.
📊Trading Outlook
🔤The bias remains STRONGLY BULLISH.
🔤Primary Strategy: Look for BUY opportunities on minor pullbacks or when price revisits the nearest Demand Zone/FVG for correction.
🔤Invalidation: A decisive close below the key structural low (the Order Block below 4150) would signal a CHoCH back to bearish pressure.

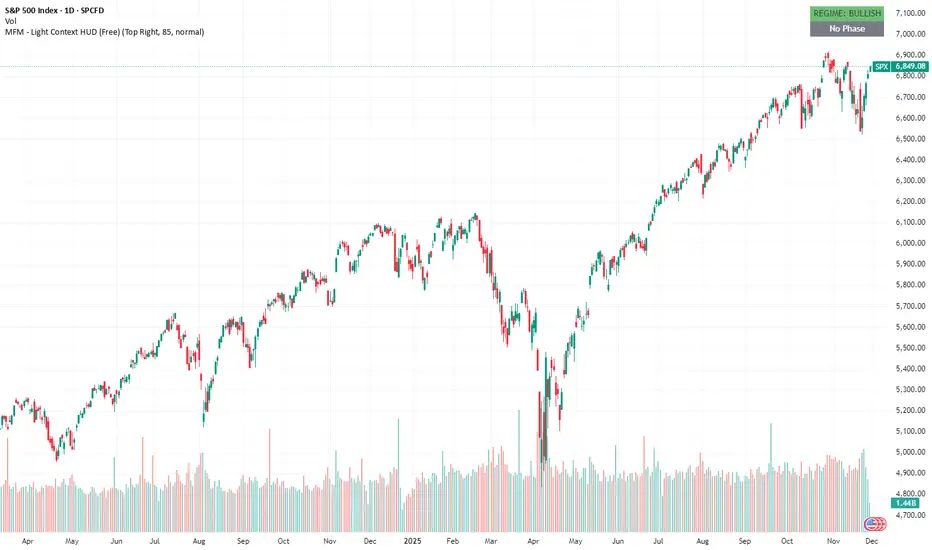
SPX – MFM Light HUD (Free) shows a clean bullish regimeThis post is an educational example of how to interpret the free MFM Light Context HUD. It does not provide trading signals or directional predictions.
The MFM – Light Context HUD (Minimal) gives a simple view of the structural state of the market. On SPX the model shows a clear bullish regime on the weekly momentum ratio. This does not predict direction. It only shows whether the underlying environment is supportive or restrictive.
The phase is currently neutral. That means SPX is not in a volatile phase, not in a compression field, and not in a drift phase. When no phase is active, price tends to behave without strong internal pressure. It is simply the absence of structural imbalance.
What the phases mean
These phases describe structure, not trade signals.
Volatile (Phase 1): fast movement and unstable conditions.
Compression (Phase 2): contracting conditions with slowing momentum.
Drift (Phase 3): more controlled and persistent movement.
Neutral: no clear structural condition.
This is why the HUD is useful. It removes noise and gives a clean top level reading.
You can still use your own strategy or analysis. The HUD just tells you what kind of environment you are operating in.
What you see in this chart
Weekly regime is bullish
No active phase
No signals or forecasts
Only structural context
Why this matters
In strong bullish regimes markets often react differently to pullbacks, volatility spikes or news events. Context does not replace analysis. It frames it.
Disclaimer
The Market Framework Model (MFM) and this indicator are for educational and informational purposes only. Nothing in this script, its visuals, or any documentation should be interpreted as financial advice or as a recommendation to buy or sell any asset.
All examples and historical references are illustrative only and do not imply future results. Trading and investing involve risk, including the potential loss of capital. Users remain fully responsible for their own decisions.
No guarantees are made regarding accuracy, completeness, or reliability. MFM describes structural market context only and should not be used as the sole basis for trading actions.
© 2025 Inratios. Market Framework Model (MFM) is protected via i-Depot (BOIP) – Ref. 155670.
Small Caps Are Entering Their Next Expansion PhaseThesis
Small caps have materially lagged the broader market for two years while capital crowded into mega caps and AI leaders. That phase is now ending. The macro backdrop is shifting, and the price structure across the higher timeframes shows the early development of a new expansion cycle.
Macro Backdrop
Rate cuts are expected as inflation cools and growth stabilizes. Small caps benefit more than any other equity class when financing costs fall because they carry higher leverage and have shorter debt cycles. Lower rates directly lift margins and earnings outlooks.
Foreign investment flows into the United States remain strong. Over the past year most of that flow was absorbed by a handful of large names. When that segment becomes extended, capital naturally rotates down the market cap ladder. This is the exact setup taking place now.
Earnings across smaller companies have quietly turned higher. Revenue revisions have stabilized, and cost pressure is easing. With rate relief approaching, profitability spreads improve faster in small caps than in large caps. Historically this combination of improving fundamentals plus easing financial conditions has led to multi-quarter outperformance.
Technical Structure
The weekly chart shows price breaking above the entire cluster of prior compression bands with multiple strong candles closing above them. That type of reclaim typically marks the beginning of a new trend phase rather than a temporary bounce.
On the same chart, the volume footprint is rising and shows persistent accumulation since the 2024 low. The upward sloping volume trendline confirms steady demand through every pullback.
The multi-wave momentum structure on the weekly chart has flipped from contraction into expansion. This shift generally occurs in the early stage of broader moves that last several months.
On the 3-day chart, price is firmly holding above its prior consolidation zone. Each corrective dip has been absorbed at higher levels, showing strong underlying demand. The volume trend on this timeframe also remains upwards, matching the weekly structure and confirming healthy participation.
Momentum on the 3-day chart mirrors the weekly: prior downside pressure has faded, and the bars are now expanding upward. That is the same setup seen before longer upside cycles in past rotations.
The daily chart provides the clearest confirmation. Price reclaimed multiple stacked levels in one impulsive leg, along with one of the strongest volume days in over a year. Pullbacks have been shallow and immediately bought. There are no signs of distribution.
Overall Structure
Large caps have already completed their expansion wave. Small caps have not. With rate cuts approaching, foreign capital still flowing in, and earnings momentum turning positive, the fundamental and macro drivers now favor small caps.
The multi-timeframe price structure aligns with that backdrop:
Reclaims across all higher timeframes
Expanding momentum after long contraction
Persistent accumulation on volume
No distribution signals on the daily
This is exactly the type of setup that precedes multi-month rotation into smaller names. Small caps remain the last unfinished leg of this cycle, and conditions are in place for that rotation to continue.
Bearish risk remains in a lower high and OBV failing its underside retest

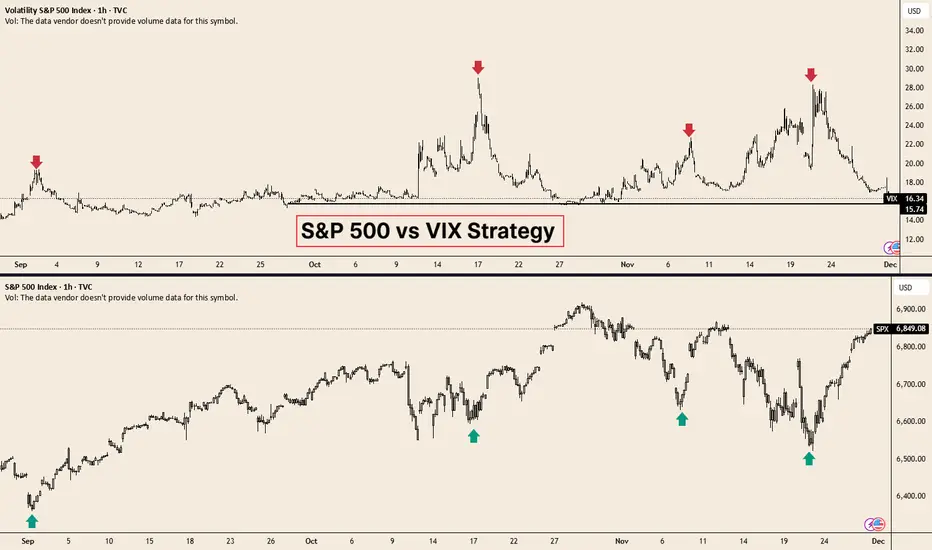
Why Every Investor Should Track the VIXThe VIX measures the market’s expectation of 30-day volatility using SPX option prices.
Because it reflects real-time hedging demand and fear levels, it tends to move violently during stress periods and collapse when investors become complacent.
This behaviour makes the VIX one of the most effective short- and mid-term indicators for equity turning points.
The chart above shows this clearly:
• 🔺 When the VIX spikes sharply (red arrows), the S&P 500 is usually in a capitulation phase driven by forced selling.
• 📉 These spikes almost always align with local bottoms in the index (green arrows), as panic exhausts itself and liquidity stabilises.
• 📈 Once volatility mean-reverts lower, equities typically recover strongly from oversold conditions.
• ⚠️ When the VIX collapses to structural lows, forward returns weaken and the probability of pullbacks increases.
Why this matters for long-term performance:
• 🎯 Buying SPY during volatility spikes has historically delivered superior forward returns compared with adding exposure during low-volatility periods.
• 💰 High VIX readings correspond to discounted prices, elevated risk premia, and stronger 6–12 month forward outcomes.
• 🟡 Low VIX environments, like the current one, signal complacency and a less attractive asymmetry for new entries.
In our view, the present volatility reset — with the VIX back near its lower range while the S&P 500 hits new highs — argues for caution.
It does not imply an immediate top, but it does suggest that the balance of risk favours patience over aggressive entries.
Why Every Investor Should Track the VIXThe VIX measures the market’s expectation of 30-day volatility using SPX option prices.
Because it reflects real-time hedging demand and fear levels, it tends to move violently during stress periods and collapse when investors become complacent.
This behaviour makes the VIX one of the most effective short- and mid-term indicators for equity turning points.
The chart above shows this clearly:
• 🔺 When the TVC:VIX spikes sharply (red arrows), the TVC:SPX is usually in a capitulation phase driven by forced selling.
• 📉 These spikes almost always align with local bottoms in the index (green arrows), as panic exhausts itself and liquidity stabilises.
• 📈 Once volatility mean-reverts lower, equities typically recover strongly from oversold conditions.
• ⚠️ When the VIX collapses to structural lows, forward returns weaken and the probability of pullbacks increases.
Why this matters for long-term performance:
• 🎯 Buying SPY during volatility spikes has historically delivered superior forward returns compared with adding exposure during low-volatility periods.
• 💰 High VIX readings correspond to discounted prices, elevated risk premia, and stronger 6–12 month forward outcomes.
• 🟡 Low VIX environments, like the current one, signal complacency and a less attractive asymmetry for new entries.
In our view, the present volatility reset — with the VIX back near its lower range while the S&P 500 hits new highs — argues for caution.
It does not imply an immediate top, but it does suggest that the balance of risk favours patience over aggressive entries.

XAUUSD | Gold Signal |Now 27,2025BUY TREND TARGET FOR TODAY 📊
XAUUSD is maintaining a clear upward trend with price trading above the EMA 34, 89, and 200. These EMAs are stacked in a bullish formation, indicating strong upward momentum. On the Volume Profile, the area near 4160 typically coincides with a high-liquidity zone or a section of the Value Area, where previous trading activity created a natural support base. When price pulls back into this zone during an uptrend, it often represents a healthy correction rather than a reversal—especially if bullish rejection candles or increasing buy volume appear. Given this structure, entering a BUY at 4160 is reasonable because it takes advantage of a Volume Profile support area while aligning with a strong uptrend, increasing the probability that price will bounce and continue its upward movement.
♾️Gold BUY now @ 4162
💰TP1 - 4166
💰TP1 - 4170
🚨Sl: 4155

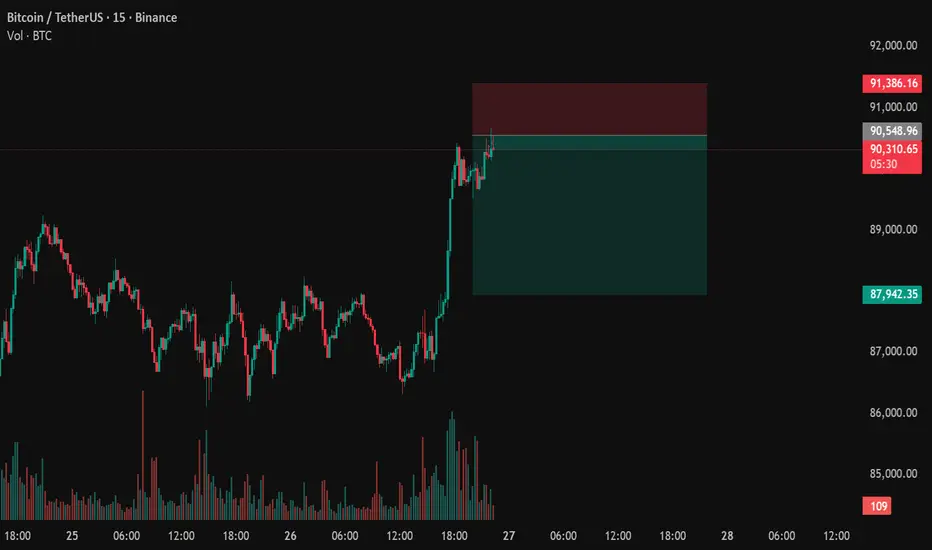
BTC Short - Structured ScalpingJoin me on the short side.
My trades are based on a personal setup focused on liquidity and supply–demand dynamics
FLNC - BullishFLNC – Volatility Expansion Thesis
The chart shows a multi-year range with two critical Volatility Expansion levels acting as the fulcrum of every major move. Price has repeatedly expanded away from these levels and then reverted back into them. They function as the midpoint of the entire structure.
1. Primary Setup
Price is attempting to reclaim the upper Volatility Expansion band near 17.40–17.76. Historically, every time price reclaimed this zone, it triggered a multi-month expansion leg to the upside (yellow arrow reference). When price failed this zone, the move unwound back into the lower expansion level at 14.83.
This is the same mechanic repeating now.
2. Why This Area Matters
This 17–18 zone is where prior expansions initiated and where prior failures collapsed. It is the single most important decision-making level on the chart. It represents:
• structural acceptance or rejection
• volume re-accumulation or distribution
• volatility compression or release
Holding above it converts the entire multi-year range into bullish continuation.
3. Current Structure
Price swept the lower expansion level at 14.83, held, and impulsively rotated back toward the upper expansion band. The current rejection wick only matters if price cannot reclaim 17.40–17.76. Reclaiming it confirms buyers stepping back into control and signals a new expansion cycle.
4. Expansion Target
The next untested zone is the large inefficiency at 36–38. This is the same grey box drawn on the chart. It is the only clean upside magnet left once price accepts above the expansion band. Liquidity is thin above 22, so the move accelerates quickly once the reclaim is secured.
5. Trigger
The trade is binary:
• Reclaim 17.40–17.76 → expansion toward 36–38.
• Fail the reclaim → mean reversion back toward 14.83.
Price is sitting right under the trigger and volatility is compressing, which usually leads to an expansion move.

NQ Power Range Report with FIB Ext - 11/26/2025 SessionCME_MINI:NQZ2025
- PR High: 25094.00
- PR Low: 25061.25
- NZ Spread: 73.25
Key scheduled economic events:
08:30 | Durable Goods Orders
- GDP
- Initial Jobless Claims
10:00 | Core PCE Price Index (MoM|YoY)
- New Home Sales
Session Open Stats (As of 12:15 AM)
- Session Open ATR: 532.12
- Volume: 27K
- Open Int: 291K
- Trend Grade: Long
- From BA ATH: -4.6% (Rounded)
Key Levels (Rounded - Think of these as ranges)
- Long: 26636
- Mid: 25410
- Short: 23426
Keep in mind this is not speculation or a prediction. Only a report of the Power Range with Fib extensions for target hunting. Do your DD! You determine your risk tolerance. You are fully capable of making your own decisions.
BA: Back Adjusted
BuZ/BeZ: Bull Zone / Bear Zone
NZ: Neutral Zone
LEU - Bullish
LEU Volatility Expansion Thesis
LEU is moving through a large volatility expansion cycle that began after a multi-year consolidation base. The initial breakout confirmed the shift in long-term trend, but the current pullback has pushed price back into key expansion levels across the 1D and 3D timeframes. These levels act as the reset zone before any continuation can occur.
Short-term structure remains bearish. The 1D and 3D charts both show lower highs, lower lows, and declining momentum. Volume Delta on the 3D timeframe continues to lean negative, confirming that buyers have not taken control of the pullback. Until these signals shift, the market is still in a consolidation phase rather than the next leg higher.
The main objective is a full reclaim of the 50D 1.168 level near 256 to 260. That level acted as the pivot that launched the previous expansion leg, and regaining it would flip structure back into bullish continuation. Failure to reclaim it keeps LEU in compression across the 173 and 112 levels, with volatility building instead of releasing.
If the reclaim occurs, higher-timeframe expansion targets reopen toward 315, 420, 740, and eventually the long-term zone around 1339 plotted on the 50-day chart. The larger the consolidation pattern, the larger the move that typically follows. LEU remains in a constructive phase, but confirmation is mandatory.

NQ Power Range Report with FIB Ext - 11/25/2025 SessionCME_MINI:NQZ2025
- PR High: 24986.50
- PR Low: 24950.75
- NZ Spread: 79.75
Key scheduled economic events:
08:30 | Retail Sales (Core|MoM)
- PPI
10:00 | CB Consumer Confidence
Session Open Stats (As of 12:25 AM)
- Session Open ATR: 529.65
- Volume: 28K
- Open Int: 296K
- Trend Grade: Long
- From BA ATH: -7.4% (Rounded)
Key Levels (Rounded - Think of these as ranges)
- Long: 26636
- Mid: 25410
- Short: 24039
Keep in mind this is not speculation or a prediction. Only a report of the Power Range with Fib extensions for target hunting. Do your DD! You determine your risk tolerance. You are fully capable of making your own decisions.
BA: Back Adjusted
BuZ/BeZ: Bull Zone / Bear Zone
NZ: Neutral Zone
XAUUSD | Gold Signal |Now 25,2025BUY TREND TARGET FOR TODAY 📊
Gold price maintains the main uptrend in the green uptrend channel, with each bottom being higher than the previous bottom. The strong correction in early October successfully retested the Fibonacci 0.382-0.5 zone around 3,970-3,850 USD, creating a foundation for the current recovery.
The price is currently moving above the MA21 and clinging to the lower edge of the uptrend channel, indicating a return of buying power.
The conditions for a new uptrend cycle include:
• The price holds the 4,050-4,000 USD zone (key support + MA21).
• RSI exits the neutral zone and moves up in sync with the price.
• Breaks out and closes steadily above the resistance of 4,128-4,216 USD, corresponding to Fibonacci 0.236 and the old peak.
If these conditions are triggered, gold could reopen the upside momentum to $4,300-$4,380 along the upper channel border.
♾️Gold BUY now @ 4045 - 4050
💰TP1 - 4128
💰TP2 - 4216

MONAD - Public Release 11-24-2025 - Spot Long!I pre-ordered 12,000 MON tokens on Coinbase 11-17-25
Coinbase added the tokens to my wallet today! :)
IN $0.025

Exivara24: Bitcoin Weakens – Liquidity Drains, Demand ReversesBitcoin continues to face heavy pressure. Over the past two weeks, the market has experienced a sharp liquidity outflow and a simultaneous reversal of all the major capital inflow channels that were previously pushing price upward. At Exivara24, we are detecting an alarming synchronization of three key factors that is now dictating sentiment for both retail traders and institutions.
The three main demand engines are reversing at the same time
ETF outflow pressure stronger than expected
Spot Bitcoin ETFs (especially U.S. and European) have been recording consistent selling for the third straight week. Net outflows over the last 10 days exceeded $1.18 billion – the largest figure since May 2025. When ETFs shrink their balances, they directly pull capital out of the market, reducing order-book depth and amplifying volatility.
Sharp decline in DAT (Daily Active Transfers) activity
The number of daily active transfers on the Bitcoin network has fallen 34 % compared to October averages. This is a direct indicator of real network usage: fewer transfers = less capital rotation = weakening organic demand.
Stablecoin liquidity squeeze
The total volume of USDT and USDC held on exchanges (the primary source of “fast money”) has dropped by $2.4 billion in 14 days. Shrinking stablecoin reserves is a classic precursor to deeper and sharper price moves, as most margin buying is funded from these reserves.
Why this matters right now
When all three demand drivers reverse simultaneously, the market shifts into “thin liquidity” mode.
Any additional pressure (ETF outflows, whale selling, or macro-negative news) now triggers much stronger and faster price reactions than during periods of high liquidity.
What Exivara24 internal analytics show
Order-book depth on the top 5 exchanges is down 38–42 % versus October
Average BTC/USDT spread has widened from 0.008 % to 0.024 %
4-hour candle volatility has increased 61 % – every move is now “stretched”
Short-term scenarios from Exivara24
Base scenario (58 % probability)
Continued liquidity squeeze → test of $80,000 – $82,000 in the next 7–12 days → gradual stabilization and return above $90,000 after the holidays.
Bearish scenario (31 % probability)
Accelerated ETF outflows + continued DAT decline → break of $80,000 and fast move toward $72,000–75,000 (March 2025 lows).
Bullish scenario (11 % probability)
Unexpected major inflow (e.g., new large institutional buyer announcement or Fed dovish shift) → rapid reclaim above $95,000 as early as this week.
Exivara24 recommendations right now
Reduce or completely close leveraged long positions / move to spot or stablecoins
Prepare dry powder for entries in the $80,000–84,000 range – the most probable accumulation zone
Hard stops below $79,000 (weekly close) are mandatory
Watch ETF inflows and DAT dynamics – these two metrics will give the first reversal confirmation
Final take from Exivara24 – what this means for you right now
We see a clear picture: Bitcoin has entered a thin-liquidity stress phase, with the three key demand sources – ETFs, network activity, and stablecoins – all weakening at once.
This is not just a correction; it is structural compression that makes every price move sharper and more unpredictable.
Until these three trends reverse, downward pressure will remain dominant.
Yes, an unexpected catalyst (major institutional buyer, Fed softening, positive regulatory news) could flip the market in hours – but the current probability of that is only 11 %.
This is not the end of the bull cycle and not a “sell everything” signal.
It is a signal that easy money is gone.
The market has shifted into professional mode, where only those who:
strictly follow risk management
avoid unhedged leveraged longs
keep cash ready for buys at $80,000–84,000
are prepared for ±10–15 % swings in either direction within a day
…will survive and profit.
For us at Exivara24, this is not a crisis – it’s our normal working environment.
Our internal models switched to “liquidity stress” mode 10 days ago: we cut long exposure, strengthened hedging, and prepared client portfolios for the current conditions.
Result: average drawdown across all accounts in November is under 4.1 %, even on the worst days.
We don’t panic and we don’t get euphoric.
We just do our job: read capital flows, measure liquidity, and give you clear levels and actions.
If you want to get through this period calmly, with minimal losses (and ideally with profit on rebounds), now is the perfect time to join our real-time updates.
Full December protection & accumulation plan
Precise entry/exit levels and 24/7 alerts
Access to the private channel and morning/evening briefings

USD/JPY: Intervention Risk RisingThe broader macro environment continues to shift against the U.S. dollar, with markets increasingly pricing the start of Federal Reserve easing as early as December or January. Rising expectations of rate cuts, paired with softening U.S. front-end yields, have weighed on the dollar’s momentum across major pairs. On the one hand, a potential Fed decision to delay easing until later in the year could reinvigorate the dollar, creating unexpected volatility. On the other hand, should the Fed opt for a more aggressive shift toward easing, it might accelerate dollar depreciation. At the same time, Japanese authorities have intensified their intervention rhetoric, particularly as USD/JPY trades near historically sensitive levels where the Ministry of Finance has previously acted to stabilize yen depreciation. A potential shift in the Bank of Japan's stance toward normalization, such as adjusting their yield curve control policy, could further alter the market dynamics. Despite these pressures, interest-rate differentials continue to favor USD/JPY upside, keeping the pair elevated as carry demand persists.
Price action on the 1H, 15m, and 5m charts shows repeated absorption of sell orders at the 156.75–156.80 region with declining pullback volume, a sign of demand defending the level. However, the pair remains vulnerable to a downside break should sellers regain control, particularly given early-stage MACD compression. With the 4H 200 EMA positioned well below current price action, any sustained breakdown could trigger a deeper correction aligned with the broader shift toward USD softness.
Thesis
Bull Bias (High Probability)
Entry: 156.80 – 156.95
Stop Loss: 156.55
Take Profit Levels:
TP1: 157.30
TP2: 157.55
TP3: 157.90 – 158.00
Reasoning: While BoJ intervention risk caps the upside, the bull case remains valid as long as intervention does not occur and 156.75 holds. Moreover, until the BoJ signals a clear shift toward normalization (e.g., raising rates or ending yield curve control outright), the yen’s fundamental backdrop remains weak. However, and this is critical, the bull case is fragile, not because of technicals, but because the entire upside continuation depends on no intervention event occurring. Upside targets toward 157.50–158.00 remain technically justified, but every pip higher increases the probability of official action. Historically, the probability of intervention at these levels is approximately 30%, underscoring the fragile nature of the bull case and serving as a quantitative anchor for informed skepticism.
Sell Bias (High-Probability, Conditional)
Entry: 156.72 – 156.78 (after breakdown confirmation)
Stop Loss: 157.15
Take Profit Levels:
TP1: 156.20
TP2: 155.70
TP3: 154.90 – 155.00
Reasoning: The strongest macro catalyst for a bearish reversal in USD/JPY is the risk of direct Japanese intervention, which is significantly elevated as the pair trades near historically sensitive levels around 157–158. This zone has repeatedly triggered the Ministry of Finance. Statements from the MoF have shifted from “monitoring FX markets closely” to explicit warnings about “excessive and one-sided moves that may require decisive action.” This is usually the final verbal step before intervention. For traders, this means that any breakdown below 156.75—especially if accompanied by high volume—could reflect market participants front-running expected intervention.
This publication is for informational and research purposes only and does not constitute financial, investment, or trading advice. The views expressed are those of the author and do not necessarily reflect those of Novaque & Co or its affiliates.
Novaque & Co, its employees, contributors, or related parties accept no liability for any loss or damage arising from reliance on the information presented. Readers are strongly advised to conduct their own due diligence and consult with a licensed financial advisor before making any investment decisions.
Past performance is not indicative of future results. The author and/or affiliated parties may hold positions in the assets discussed. Content is subject to change or update without notice.

XAUUSD | Gold Signal |Now 24,2025BUY TREND TARGET FOR TODAY 📊
🔱Gold opened the week under pressure, sliding toward $4,040/oz as the market waits for clearer signals on the Federal Reserve’s next move. After last Friday’s decline, sentiment continues to shift rapidly ahead of this week’s key US data.
📌 Key Drivers This Monday:
Fed President John Williams hinted at support for another rate cut soon, pushing market expectations for a December 25bps cut to nearly 70%, up from just 40% last week after the strong jobs report.
However, traders are staying cautious as the market looks for confirmation from incoming economic indicators.
📊 Data to Watch This Week:
- Tuesday: Retail Sales & PPI (September)
- Wednesday: Initial Jobless Claims
These releases will shape how aggressively markets can price in additional easing from the Fed.
⚠️ Market Sentiment:
Despite today’s decline, gold remains up around 54% year-to-date, supported by geopolitical uncertainty, strong central bank buying, and persistent hedging demand.
Risk appetite in global markets is improving slightly, adding short-term pressure to gold, but long-term fundamentals remain supportive.
♾️BUY XAUUSD 4060–4063
🚨SL: 4057
💰TP 1:4066
💰TP 2:4069
