US 100 Index – Can the Year End Rally Continue?News released yesterday that Alphabet were going to buy data center partner Intersect in a deal worth around $5 billion to give it more power generation, alongside the on-going battle between Netflix and Paramount for Warner Bros has thrown the spotlight back on US stock indices, especially now that Larry Ellison, Chairman of Oracle and the world’s 5th richest man is now heavily involved in the deal.
Turning focus to the US 100 index, traders may now be wondering if it can turn its current 3 day winning streak into a longer string of daily gains, even pushing itself back up to challenge its record high set on October 30th at 26277, or whether the rally could run out of steam around current levels (25445, 0630 GMT).
With the Christmas Day holiday less than 48 hours away, today’s volatility driver could be the release of two pieces of US economic data. First up at 1330 GMT is the latest Q3 GDP growth update. Although it’s a second estimate, this could provide further insight into the current health of the US economy and shed some light on whether the market’s expectation of 2 further 25bps interest rate cuts from the Federal Reserve in 2026 is spot on, overblown or understated.
Then, next up is the US consumer confidence reading at 1500 GMT. This number has been under pressure in recent months with households worried about their financial situation and job security. Traders may be looking to see if the number has rebounded at all, which if it has, could be good news for spending and corporate profits over the important festive period.
Technical Update: Santa Rally Only Extends Sideways Range
If the latest 3.7% rally in the US 100 index from its December 17th low at 24644 can even be described as a “Santa rally,” it hasn’t so far at least brought too much in the way of Christmas cheer. As the chart below shows, price action is still trapped between the October 30th high at 26277 and the November 21st low at 23834, suggesting the index remains caught within a broad more balanced range at best.
As we move into the Christmas–New Year trading period, traders may be looking to identify key support and resistance levels to monitor in case a confirmed breakout triggers a more sustained move in the direction of the price break.
Potential Resistance Levels:
Following the latest price strength, the December 10th high at 25844 could now mark the first resistance level. While not a guarantee of further gains, closing breaks above 25844 may now be needed to open the way for additional price strength.
As the chart above shows, if the 25844 resistance were to give way on a closing basis the focus could then shift to the high from October 30th which stands at 26277. A break above that level could then open the way for scope for further upside.
Potential Support Levels:
Of course, the resistance levels highlighted above currently remain intact, and while they do price weakness can still emerge. If that happens, traders could be monitoring how the 25094 level is defended on a closing basis. This level represents half of the latest rally and could be the first support focus.
Closing breaks below 25094 could signal further price weakness, possibly leading to a test of 24644, which is the December 17th low. Closes below 24,644 could then warn of a deeper decline toward 23834.
The material provided here has not been prepared accordance with legal requirements designed to promote the independence of investment research and as such is considered to be a marketing communication. Whilst it is not subject to any prohibition on dealing ahead of the dissemination of investment research, we will not seek to take any advantage before providing it to our clients.
Pepperstone doesn’t represent that the material provided here is accurate, current or complete, and therefore shouldn’t be relied upon as such. The information, whether from a third party or not, isn’t to be considered as a recommendation; or an offer to buy or sell; or the solicitation of an offer to buy or sell any security, financial product or instrument; or to participate in any particular trading strategy. It does not take into account readers’ financial situation or investment objectives. We advise any readers of this content to seek their own advice. Without the approval of Pepperstone, reproduction or redistribution of this information isn’t permitted.
Volatility

NQ Power Range Report with FIB Ext - 12/23/2025 SessionCME_MINI:NQH2026
- PR High: 25722.50
- PR Low: 25700.50
- NZ Spread: 49.0
Key scheduled economic events:
08:30 | Durable Goods Orders
- GDP
10:00 | CB Consumer Confidence
15:00 | New Home Sales
Session Open Stats (As of 12:15 AM)
- Session Open ATR: 405.86
- Volume: 16K
- Open Int: 267K
- Trend Grade: Long
- From BA ATH: -2.8% (Rounded)
Key Levels (Rounded - Think of these as ranges)
- Long: 26521
- Mid: 25264
- Short: 24008
Keep in mind this is not speculation or a prediction. Only a report of the Power Range with Fib extensions for target hunting. Do your DD! You determine your risk tolerance. You are fully capable of making your own decisions.
BA: Back Adjusted
BuZ/BeZ: Bull Zone / Bear Zone
NZ: Neutral Zone

BTC market regime change
BTC daily market regime changed.
Market environment looks different from last week.
I track market environment using:
- Trend vs Range
- High vs Low Volatility
Trend + High Vol -> Range + High Vol

NIFTY Quick View – Dec 23, 2025NIFTY Quick View – Dec 23, 2025
(Chart: )
Spot:
26177
Supports
30min: 26,000
|| 1D: 25,700
View
Supports dominate – no visible resistance.
Higher likelihood of testing support than reaching new all-time highs.
Trade Approach
Enter long calls on rejection at put strikes (support holds).
• Enter long puts on rejection at call strikes (upside fails).
Dynamic flip: Shift to inverse strikes when the initial direction weakens.
Clear levels only – no SL or targets provided.
You define your own setup.
DYOR – Options trading carries high risk! 📈
More details on my view
www.tradingview.com
www.tradingview.com
My Trading approach
www.tradingview.com

NQ Power Range Report with FIB Ext - 12/22/2025 SessionCME_MINI:NQH2026
- PR High: 25675.00
- PR Low: 25632.25
- NZ Spread: 95.75
Key scheduled economic events:
10:00 | Core PCE Price Index (MoM|YoY)
Weekend gap up 0.23% (open)
Session Open Stats (As of 12:15 AM)
- Session Open ATR: 425.74
- Volume: 25K
- Open Int: 269K
- Trend Grade: Long
- From BA ATH: -2.7% (Rounded)
Key Levels (Rounded - Think of these as ranges)
- Long: 26521
- Mid: 25264
- Short: 24008
Keep in mind this is not speculation or a prediction. Only a report of the Power Range with Fib extensions for target hunting. Do your DD! You determine your risk tolerance. You are fully capable of making your own decisions.
BA: Back Adjusted
BuZ/BeZ: Bull Zone / Bear Zone
NZ: Neutral Zone

PLTR GEX - Bull Flag Breakout SetupPLTR Technical & Options Setup Overview
PLTR is setting up a clean bull flag breakout on the daily chart, following a strong impulsive leg higher.
The consolidation has been holding above the 50-day moving average , which has acted as dynamic support throughout the flag structure. Two sessions ago price briefly dipped below the 50 SMA, but that weakness was immediately bought, signaling strong dip demand and structural acceptance above this level.
From an options perspective, the setup remains supportive. On the Feb 20 (Optimal Monthly) expiration, PLTR shows a Positive GEX Profile .
Volatility and skew conditions further strengthen the bullish case:
Core Call Pricing Skew is elevated (~36%), indicating persistent call demand
Implied volatility remains relatively low, leaving room for price expansion without volatility headwinds
Looking ahead, the next major reference is the 200 level , which represents the primary Core Resistance for the Optimal Monthly cycle. Given the compression within the bull flag and supportive options structure, 200 becomes a natural upside objective if the breakout confirms.
Structure to watch:
50 SMA – key trend support
Bull flag high – breakout trigger
Positive GEX – supportive dealer flow
200 – next major upside target (Core Resistance)
As long as price holds above the 50 DMA and volatility stays contained, risk remains skewed to the upside, with a measured breakout toward 200 favored.

NQ Power Range Report with FIB Ext - 12/19/2025 SessionCME_MINI:NQH2026
- PR High: 25257.50
- PR Low: 25209.75
- NZ Spread: 106.75
Key scheduled economic events:
08:30 | Core PCE Price Index (MoM|YoY)
10:00 | Existing Home Sales
Session Open Stats (As of 12:55 AM)
- Session Open ATR: 430.77
- Volume: 35K
- Open Int: 271K
- Trend Grade: Long
- From BA ATH: -4.1% (Rounded)
Key Levels (Rounded - Think of these as ranges)
- Long: 26521
- Mid: 25264
- Short: 24008
Keep in mind this is not speculation or a prediction. Only a report of the Power Range with Fib extensions for target hunting. Do your DD! You determine your risk tolerance. You are fully capable of making your own decisions.
BA: Back Adjusted
BuZ/BeZ: Bull Zone / Bear Zone
NZ: Neutral Zone

Two or one leg down to 23850 again
From Thursday's closed around 25 000, looks to me, like the downtrend channel may be maintained, with todays breakout failing. The 4 hourly rose up and was rejected at the 150 sma (pink arrow). So thinking it now will retest the 23850 lows.
I think it will do this in a 2 leg more or less equal measured move down. At an estimate first to ~24350, then less of a rally than the last couple we have had, and more of a slow retrace back to ~24500 - more flag like, then down 23850 ish. Though it could potentially do that in one move on friday. Possible, but a bit of a stretch for one day though, unless some rather dire news happens to coincide tomorrow. The visible range volume profile certainly seems to adequately accommodate a move to 24350, with little problem, while less so to ~24000k in my interpretation, yet, i still feel the price will need to go there as a significant low.
Of interest, it is also setting up to look similar to a period of last months chart - see set of three thin black arrows. If it stays similar this pattern, then that would suggest a one leg down move, like we had then. But that is a less probable scenario i think, barring any particularity bad news event. So this similarity is mentioned more as a point of interest, as it doesnt have a technical basis of which i am aware.
This could all be a load of nonsense of course, and it breaks out back up!

NQ Power Range Report with FIB Ext - 12/18/2025 SessionCME_MINI:NQH2026
- PR High: 24999.00
- PR Low: 24925.00
- NZ Spread: 165.5
Key scheduled economic events:
08:30 | Initial Jobless Claims
- CPI (Core|MoM|YoY)
- Philadelphia Fed Manufacturing Index
Session Open Stats (As of 12:55 AM)
- Session Open ATR: 426.70
- Volume: 36K
- Open Int: 266K
- Trend Grade: Long
- From BA ATH: -5.3% (Rounded)
Key Levels (Rounded - Think of these as ranges)
- Long: 26521
- Mid: 25264
- Short: 24008
Keep in mind this is not speculation or a prediction. Only a report of the Power Range with Fib extensions for target hunting. Do your DD! You determine your risk tolerance. You are fully capable of making your own decisions.
BA: Back Adjusted
BuZ/BeZ: Bull Zone / Bear Zone
NZ: Neutral Zone

Protective Put Support Zone & Gap FillAVGO – Breakdown Below HVL, Gap Fill Toward 320, Protective Put Support Zone
AVGO is trading in a high-volatility, momentum-driven downside phase , following a clean breakdown below the HVL. The move marks a clear regime shift, as price exited a tight transition zone and accelerated lower with conviction.
The downside was well signaled by sustained put-side pressure over multiple sessions, with price repeatedly rejecting from the 50 EMA . Once HVL failed, downside momentum expanded rapidly, consistent with a retail-driven move rather than a controlled dealer-defended range.
From an options structure perspective, protective put positioning now defines the next meaningful downside reference. Current positioning shows the next major protective put support clustered around 320 , which also aligns with a clean gap-fill level on the chart.
This makes 320 a dual-confluence area:
technical gap fill
protective put floor where dealer hedging dynamics may begin to dampen downside momentum
Until that zone is reached, price is effectively moving through thin structure, where volatility expansion and sharp intraday swings should be expected.
Key levels & structure:
Below HVL → bearish regime confirmed
50 EMA → repeated rejection, trend continuation signal
320 → primary downside target & potential stabilization zone (gap fill + protective puts)
Any stabilization or bounce attempts are more likely to occur only after interaction with the 320 area, not before.

NQ Power Range Report with FIB Ext - 12/17/2025 SessionCME_MINI:NQH2026
- PR High: 25363.00
- PR Low: 25294.25
- NZ Spread: 154.0
No key scheduled economic events
Session Open Stats (As of 12:25 AM)
- Session Open ATR: 414.92
- Volume: 32K
- Open Int: 246K
- Trend Grade: Long
- From BA ATH: -4.0% (Rounded)
Key Levels (Rounded - Think of these as ranges)
- Long: 26521
- Mid: 25264
- Short: 24008
Keep in mind this is not speculation or a prediction. Only a report of the Power Range with Fib extensions for target hunting. Do your DD! You determine your risk tolerance. You are fully capable of making your own decisions.
BA: Back Adjusted
BuZ/BeZ: Bull Zone / Bear Zone
NZ: Neutral Zone

BTC (last 2 days)Yesterday was a liquidation-style selloff: multiple oversized 5m candles and wicks, no clean pullbacks, and consecutive inefficiencies printed (stacked 5m/15m FVGs). Any “normal” retest logic got distorted by volatility spikes, so execution quality depended on waiting for acceptance/reclaim rather than trying to catch the first touch.
Today shifted into repair mode: price started building bases out of prior displacement (what looked like a 15m FVG effectively behaved like a higher-TF supply/base zone, then evolved into an actionable RBD/RDB structure). We got a push into the 5m FVG and a reaction, but the retest failed and price slipped back into the 1h RBD, invalidating the long continuation attempt. One partial TP was possible, but the runner got taken out on the reversal—classic “paid for information” trade: initial confirmation, then rejection/rotation back into the higher-TF base.
Key takeaway: in this volatility regime, treat FVGs as reaction areas, not guaranteed entries—confirmation (hold/reclaim + retest) matters more than precision. Execution priority was: reclaim/acceptance first, then entry; otherwise fade/short only after loss of base and failed reclaim.

NQ Power Range Report with FIB Ext - 12/16/2025 SessionCME_MINI:NQH2026
- PR High: 25373.25
- PR Low: 25280.25
- NZ Spread: 208.0
Temp 25% AMP margin requirements increase
Key scheduled economic events:
08:30 | Average Hourly Earnings
Retail Sales (Core|MoM)
Nonfarm Payrolls
Unemployment Rate
09:45 | S&P Global Manufacturing PMI
S&P Global Services PMI
Session Open Stats (As of 12:55 AM)
- Session Open ATR: 430.72
- Volume: 41K
- Open Int: 168K
- Trend Grade: Long
- From BA ATH: -4.8% (Rounded)
Key Levels (Rounded - Think of these as ranges)
- Long: 26521
- Mid: 25264
- Short: 24008
Keep in mind this is not speculation or a prediction. Only a report of the Power Range with Fib extensions for target hunting. Do your DD! You determine your risk tolerance. You are fully capable of making your own decisions.
BA: Back Adjusted
BuZ/BeZ: Bull Zone / Bear Zone
NZ: Neutral Zone

GOOGL GEX & Bullish Decision Point at 320February 20 Expiration – GEX & Options Structure
Looking at the February 20 expiration, the options and GEX structure suggests that price is currently sitting at a critical decision zone .
Put side
The chart shows a clear put support level around 310 .
Price has briefly traded through this level, but there has been no strong downside continuation .
This keeps the scenario alive that 310 can still act as put support into this expiration.
Call side / Decision point
The next core resistance is located around 320 .
This level represents a bullish decision zone .
A clean break and acceptance above 320 could quickly shift dealer positioning.
Such a move would open the door for a potential gamma squeeze to the upside.
Technical context
Since summer, this is already the third similar bull flag structure on the daily chart.
The previous two structures resolved to the upside.
The current pattern has not yet confirmed a breakout.
This makes the 320 level especially important for technical confirmation.
Upside scenario
If price accepts above 320 , the next logical magnet becomes the next core resistance.
Based on daily structure and call wall positioning, this sits around 350 .
Volatility & Skew
Core pricing skew is currently around +25% , favoring calls.
Implied volatility has been compressing for several sessions .
This supports the idea that a directional expansion could follow once price resolves this range.
Summary
310 = key put support
320 = bullish decision point
Acceptance above 320 increases the probability of gamma-driven upside toward higher call resistance levels

Yields May Be Squeezing HigherThe Federal Reserve cut interest rates last week, but the yield on the key 10-year U.S. Treasury note may be going the other way.
The first pattern on today’s weekly chart is the series of higher weekly lows since 2023, which may reflect the presence of a long-term uptrend.
Second, TNX tested 4 percent in March and has remained firmly above it since.
Third, yields made a series of lower highs as they squeezed against 4 percent. They closed above that falling trendline last week, which could be viewed as a potential breakout.
Next, average true range (ATR) has narrowed steadily since April. That may potentially resemble the moves in 2020 before yields started climbing. Could the current tight range also morph into a new phase of rapid upward movement?
TradeStation has, for decades, advanced the trading industry, providing access to stocks, options and futures. If you're born to trade, we could be for you. See our Overview for more.
Past performance, whether actual or indicated by historical tests of strategies, is no guarantee of future performance or success. There is a possibility that you may sustain a loss equal to or greater than your entire investment regardless of which asset class you trade (equities, options or futures); therefore, you should not invest or risk money that you cannot afford to lose. Online trading is not suitable for all investors. View the document titled Characteristics and Risks of Standardized Options at www.TradeStation.com . Before trading any asset class, customers must read the relevant risk disclosure statements on www.TradeStation.com . System access and trade placement and execution may be delayed or fail due to market volatility and volume, quote delays, system and software errors, Internet traffic, outages and other factors.
Securities and futures trading is offered to self-directed customers by TradeStation Securities, Inc., a broker-dealer registered with the Securities and Exchange Commission and a futures commission merchant licensed with the Commodity Futures Trading Commission). TradeStation Securities is a member of the Financial Industry Regulatory Authority, the National Futures Association, and a number of exchanges.
TradeStation Securities, Inc. and TradeStation Technologies, Inc. are each wholly owned subsidiaries of TradeStation Group, Inc., both operating, and providing products and services, under the TradeStation brand and trademark. When applying for, or purchasing, accounts, subscriptions, products and services, it is important that you know which company you will be dealing with. Visit www.TradeStation.com for further important information explaining what this means.

Canadian Natural Resources Ltd. (CNQ) — Swing Trade💰 CNQ — Swing Trade Breakdown (TSX)
Canadian Natural Resources Ltd.
🏢 Company Snapshot
Canadian Natural Resources (CNQ) is one of Canada’s largest integrated energy producers, with long-life oil sands, heavy oil, natural gas, and offshore assets. The stock is drawing attention after a sharp pullback into its rising 50-day moving average, aligning with mean-reversion setups in an otherwise intact primary uptrend and continued strength in crude prices.
📊 Fundamentals
Valuation & Profitability
P/E: ~10–11×
Below large-cap North American E&P peers, reflecting disciplined capital returns rather than aggressive growth.
P/B: ~2.0–2.2×
Reasonable for a high-ROE, asset-heavy producer with long reserve life.
ROE: ~25–30%
Strong profitability driven by operating leverage and cost control.
Balance Sheet & Cash Flow
Debt/Equity: ~0.4–0.5
Moderate leverage and steadily improving balance sheet.
Free Cash Flow: Strong and recurring
Supports dividends, buybacks, and debt reduction even at mid-cycle oil prices.
Dividend Yield: ~4.5–5%
Attractive income component with a long track record of dividend growth.
Summary:
High-quality large-cap energy name with strong free cash flow, disciplined capital returns, and a reasonable valuation relative to peers.
📈 Trends & Catalysts
Revenue Growth:
Moderate YoY growth, largely driven by commodity pricing and stable production volumes.
EPS Trend:
Uptrend over the past year, with some quarterly volatility tied to oil price fluctuations.
Cash Flow Trend:
Consistently strong; excess cash increasingly directed toward shareholder returns.
Balance Sheet:
Debt trending lower over time, improving financial resilience.
Catalysts:
Directional move in WTI crude oil
Continued share buybacks and dividend increases
Energy sector rotation during inflationary or risk-off macro phases
Seasonal winter demand and geopolitical supply risks
Risks:
Pullback in crude oil prices
Broad market risk-off environment
Policy or regulatory pressure on Canadian energy producers
🪙 Industry Overview (Energy)
Weekly:
Performance: ▲ modest
Trend: Up
Sentiment: Bullish to Neutral
Monthly:
Performance: ▲
Trend: Up
Sentiment: Rotation back into energy on inflation and geopolitical risk
12-Month:
Performance: Outperforming TSX
Trend: Up
Sentiment: Supported by cash-flow durability and capital discipline
📐 Technicals (Daily Chart)
Price: ~45.4 CAD
50-SMA: ~45.5 CAD
Price pulling back into rising trend support.
200-SMA: Well below current price
Confirms long-term uptrend.
RSI(2): Oversold / deeply compressed
Classic mean-reversion condition within an uptrend.
Pattern: Pullback continuation
Higher-high structure intact despite recent volatility.
Key Levels
Support: 44.5 – 45.0
Resistance: 47.5 – 48.0
Volume:
Recent selloff occurred on elevated but not climactic volume, suggesting profit-taking rather than distribution.
🎯 Trade Plan (Swing)
Entry Zone:
45.0 – 45.5
Pullback into 50-SMA / prior support.
Stop Loss:
~44.7
Below recent swing low and trend invalidation level.
Target:
~47.7 – 48.0
Prior highs / resistance zone.
Risk/Reward:
~2:1
Meets minimum swing-trade criteria.
Alternate Setup:
Bullish continuation on a reclaim and hold above 46.5 with expanding volume.
🧠 My Take
CNQ remains a textbook large-cap energy swing candidate: strong fundamentals, reliable cash flow, and a clean technical pullback into trend support. As long as price holds the 50-SMA, this looks like a mean-reversion long targeting a retest of recent highs, with crude oil acting as the primary accelerator.

NQ Power Range Report with FIB Ext - 12/15/2025 SessionCME_MINI:NQH2026
- PR High: 25245.25
- PR Low: 25132.50
- NZ Spread: 252.25
No key scheduled economic events
Index futures contract rollover week
Session Open Stats (As of 12:25 AM)
- Session Open ATR: 434.10
- Volume: 17K
- Open Int: 60K
- Trend Grade: Long
- From BA ATH: -4.2% (Rounded)
Key Levels (Rounded - Think of these as ranges)
- Long: 26521
- Mid: 25264
- Short: 24008
Keep in mind this is not speculation or a prediction. Only a report of the Power Range with Fib extensions for target hunting. Do your DD! You determine your risk tolerance. You are fully capable of making your own decisions.
BA: Back Adjusted
BuZ/BeZ: Bull Zone / Bear Zone
NZ: Neutral Zone

Extreme Fear Marks Historic Lows in Bitcoin SentimentQuinten Francois posted a brief but effective statement. He explained that all seasons of excessive fear were followed up by regrets. The market indicator he referred to is famous. The Crypto Fear and Greed Index triggered the high levels of fear again. The index fell to under the 20 level. Such a zone is typical of panic conditions. During such stages, retail confidence is undermined. Markets become increasingly intense in selling. The Bitcoin has just fallen short of major psychological milestones. The volatility rose drastically. The social media were dominated by negative sentiment. Merchants were emotional. There were well-established trends as seen by long-term investors.
What the Fear and Greed Index Tells you
The Fear and Greed Index follows the sentiment of the investors. It is a combination of volatility, volume, social sentiment, and momentum. Capitulation is indicated by extreme fear. Sellers scramble out of positions. Liquidations through force are accelerating declines. Weak hands are flushed out by leverage. In the past, such occurrences were bottoms in the market. Bitcoin usually backtracked soon thereafter. The recovery of prices was quicker than anticipated. Late sellers faced regret. The chart that is available in the post brings out several cycles. All of the extremes fear readings were followed by drastic rebounds. The information confirms the principles of contrarian investing.
Pattern Explained by Behavioral Finance
A significant role is taken by the human psychology. Investors are terrified of the losses than they appreciate gains. This idea is based on the behavioral finance studies. Research by Kahneman and Tversky describes loss aversion. Irrational decisions are inspired by fear. During uncertainty, panic selling is higher. Markets are ruthless to emotional responses. Composed persons have an advantage. Radical fear results in wrong pricing. Assets are traded at a low price. Patience is a virtue of long term capital. This is the psychological reality behind the message Quinten puts across. History repeats itself since a behavior is unchanging.
After price recovery is regret. Investors sell near lows. They wait for confirmation. Markets turn back against the expectation. Re-entry feels risky. Prices move higher quickly. Lack of opportunity induces emotional suffering. The same is the case with previous cycles. Fear peaks close to bottoms. Greed returns near tops. Emotions are hard to time. Punishment is more important than prophecy. Supreme fear puts faith to the test. Ready investors are the only ones who take decisive action.
Implications of this to the existing market
The present world is reminiscent of the previous recessions. The feeling is still highly negative. News cycles enhance negative thinking. There is the pressure of Macroeconomic uncertainty. Nevertheless, accumulation is observed on-chain. The long-term holders increase positions. Supply tightens gradually. The weak hands are shaken out by volatility. These are those conditions that had historically favored patient capital. The post by Quinten is an acknowledgment. During times of downfall, fear is forever. History shows otherwise. Markets eventually recover. Emotional exits are followed by regrets.

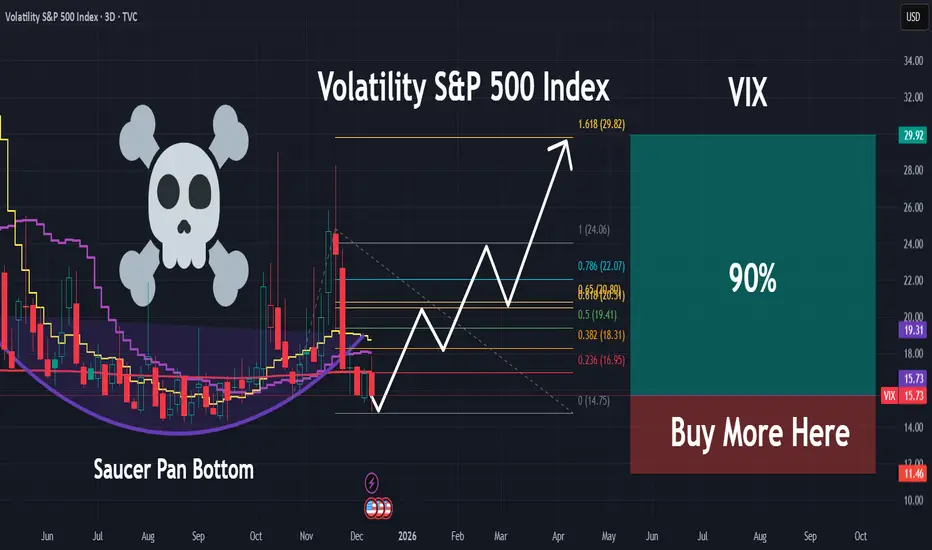
VIX | Major Volatility and Market Correction Incoming | LONGThe VIX Index, formally known as the Cboe Volatility Index, is a real-time market index that represents the market's expectation of 30-day forward-looking volatility for the S&P 500 index. It is widely known as the "fear gauge" because it tends to rise sharply during periods of increased investor fear and market uncertainty.
BTC 1H diagonal compression into Monday: brace for volatatilityI’m tracking a validated descending channel (2 magenta lines) from the Oct highs and two rising supports (2 green lines) from the Nov/Dec base. Price is now pinned near the convergence around 90.6k.
Why the “double lines” matter
The outer lines define the macro boundaries (where reactions repeatedly happened).
The inner lines act like a “decision lane” (where price keeps getting rejected/held).
Together this often produces compression to expansion (volatility tends to increase once the market chooses a side).
What I’m watching (behavior > prediction):
Bullish resolution: 1H close above the upper magenta + next candles hold above (no instant reclaim back under).
Then I treat magenta as support on retest. Upside targets become the next horizontal supply zones (92–94k).
Bearish resolution: 1H close below the lower green + retest fails (closes stay below).
Then I treat green as resistance; downside opens toward 89k first, then deeper supports (mid/low 80s).
Chop warning: wicks through lines with no follow-through = liquidity runs, not confirmation. I don’t trade the wick. I trade the close + hold.
Here's how the lines helped me succesfully time a short recently:
Planned two days earlier, during previous chop at this level, and patiently waited for a retest:
Rule for the weekend / Monday open
I’m not betting on the timestamp of line intersections. I’m bracing for range expansion and waiting for acceptance/rejection on 1H closes.
Not financial advice. This is a volatility warning + structure map, not a signal.

MSFT Potential Upside Squeeze SetupMSFT is currently forming a constructive structure with clearly defined levels.
On the downside, the 475 put support has been defended three separate times, signaling strong positioning interest and consistent absorption of selling pressure. Price continues to hold above the HVL , with an extremely narrow transition zone and a broadening upward-tilted positive GEX profile — all reinforcing structural stability.
If price breaks upward from the first call wall at 480 , this typically favors continuation rather than any sustained move lower.
Upside levels :
The next major call resistance sits at 500 — which also aligns with the 8/8 level on the MM grid system . This creates a very strong confluence, making 500 a significant resistance zone.
If price cleanly accepts and pushes through 500, dealer hedging flows can accelerate, potentially triggering an upside squeeze — with an initial upside extension capped near 520 .
If momentum continues to build above 500, the next substantial call resistance sits at 520 , currently the second-largest call wall on the chain.
As long as price remains above HVL and the 475 support zone holds, the risk-reward skew favors continuation to the upside, with 480 as the trigger level and 500 as the speculative call-positioning target .
However — critical risk scenario:
If 475 breaks and we do not see a fast rebound from the 470/460 negative squeeze zone , this could initiate a sharp downward move and a trend shift. Currently, the largest protective put concentration sits at 475 — and the put side only begins to melt if price can reclaim 480 .
At least based on the aggregated options chain, MSFT is now under immense compression with clear trigger points .
MSFT tightening under GEX squeeze pressure

XAUUSD (GOLD)Gold approached its ALL TIME HIGH, with a good little rejection via an engulfing candlestick bar there gives signs of reversal, looking at also the addition of the recent reduction in impulsive behaviour, good corrections of price or market ranges and also the key zone being a selling zone where price rapidly moved away from last, could this give us confidence in a possible reversal?
Or based off fundamentals and recent impulsive behaviour of strong bulls, we could see GOLD break it's ALL TIME HIGH, therefore creating new highs, what's your take?

Boyd Group Services Inc. (TSX: BYD) - Swing Trade 2025-12-12💰 BYD.TO — Mean Reversion Swing Setup (RSI(2) + 50-SMA)
Boyd Group Services Inc. (TSX: BYD) continues to behave like a textbook institutional swing name. Despite premium valuation, price action remains highly technical, with repeated respect of the 50-day SMA and strong mean-reversion responses following short-term oversold conditions.
This setup aligns cleanly with a Connors-style RSI(2) pullback within a primary uptrend.
📈 Technical Context
BYD remains in a confirmed long-term uptrend, with price holding above the 200-day SMA and repeatedly finding buyers near the 50-day SMA. The recent pullback brought RSI(2) into deeply oversold territory (<10) — a level that historically precedes short-term bounces in this name.
Volume has contracted on the pullback, suggesting selling pressure is corrective rather than distributive.
Structure remains intact as long as price holds above the 50-SMA zone.
📊 Key Levels
Current Price: ~221.8
50-SMA: ~221–222 (primary dynamic support)
200-SMA: ~210 (trend floor)
Support Zone: 218–222
Resistance Zone: 235–240
This area has acted as a high-probability demand zone multiple times over the past year.
🎯 Trade Thesis (Swing)
Bias: Bullish mean-reversion
Setup Type: RSI(2) pullback within established uptrend
Entry:
Looking for long exposure near the 50-SMA (220–223) following oversold RSI(2) conditions.
Stop:
Below structure and ATR — 213–215 area.
Target:
Prior supply and range highs at 235–240.
Risk/Reward:
Approximately 2.5R, acceptable for a swing trade in a premium-valued name.
⚠️ Risks to Watch
Loss of the 50-SMA on a high-volume close
Broader consumer discretionary weakness
Rate-sensitivity given leverage on the balance sheet
A clean break below the 50-SMA would invalidate the mean-reversion thesis.
🧠 Final Take
BYD isn’t cheap — but price pays. As long as the 50-SMA holds, this remains a repeatable swing structure rather than a long-term valuation play. I favor controlled long exposure here, targeting a rotation back toward the upper range.
