Wyckoff Distribution schematicsThis count is based on my assumptions so anything can happen not a trading or financial advice just for educational purposes only kindly do your own ta thanks trade with care good luck.
Volume

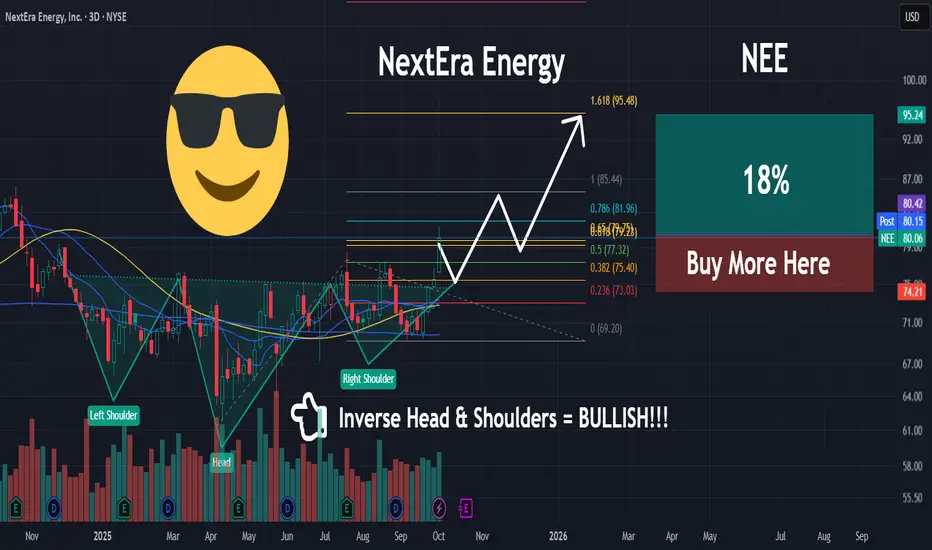
NEE | Utilities STRONG | LONGNextEra Energy, Inc. engages in the provision of renewable energy. It operates through the following segments: FPL and NEER. The FPL segment involves the generation, transmission, distribution, and sale of electric energy in Florida. The NEER segment produces electricity from clean and renewable sources, including wind and solar. The company was founded on December 28, 1925 and is headquartered in Juno Beach, FL.

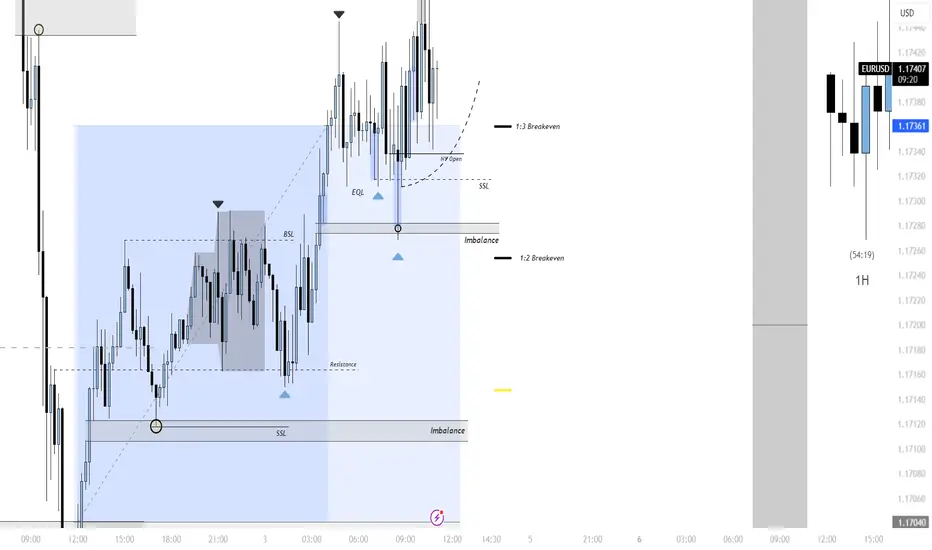
Absence of Institutional Liquidity: Retail Liquidity DrivenThis trade played out cleanly by following the institutional narrative of orderflow and liquidity. Price first dropped into a key demand zone where bullish orderflow emerged, reclaiming imbalance and holding structure. Liquidity was engineered through sweeps of equal lows (SSL/EQL), confirming buyers’ strength before expansion. The move higher was driven by the natural draw on liquidity resting above equal highs and into the Supply + POC zone, providing a clear target. Risk was managed with 1:2 and 1:3 breakeven levels after imbalance mitigation and the New York open alignment, locking in profits while allowing room for continuation. In short, the win came from combining demand absorption, liquidity sweeps, imbalance fills, and auction flow logic to anticipate where institutions would drive price next.
NVS Bullish Continuation LongThis looks super bullish
If we get a flat to lower open tomorrow, would be a good market entry
Best entry price around 110-108
TP1 133
TP2 154
This is a longer term play I would not expect this to play out in a couple weeks

Market on Fire: S&P 500 & Nasdaq Rally Towards New HighsWe have a beautiful P-Shape volume profile formed at the top and we broke and closed above it.
The P-shape volume profile is bullish profile that is formed when large volumes are transacted at the highs meaning participants a willing to pay premium price . You can see the POC so close to the top of the VAH
I checked the CVD of the volume on a footprint chart and i see the volume has -ve Delta , which means alot of aggressive sellers transacted there trying to push the price down. Now that they are being squeezed slowly and start closing out their positions, it should fuel the uptrend. i entered the trade soon as we broke and closed above the value area.
Food for thought.. Who was willing to pay the high price to buy from the aggressive sellers?
DEFINITIONS
POC- point of control
VAH- Value area high
CVD- Cumulative Volume Delta
Target is the ExoFade area..Lets see how this trade goes

Ethereum: false breakout confirmed — buyers target higher levelsHi traders and investors!
This analysis is based on the Initiative Analysis concept (IA).
On the daily timeframe, there is a sideways range with boundaries marked by black lines.
The price has returned inside the range. Buyers absorbed the seller’s candle that interacted with the lower boundary on increased volume (see the related post) — a classic false breakout pattern.
Now, with strong daily candles on rising volume, the buyer is pushing toward the upper boundary of the range. The price has already reached 4500, and next I expect 4800, 5000, and eventually 5,600 (see related posts).
Wishing you profitable trades!

ADA/USDT – Simple 4H Analysis with Potential UpsideADA/USDT – Simple 4H Analysis with Potential Upside
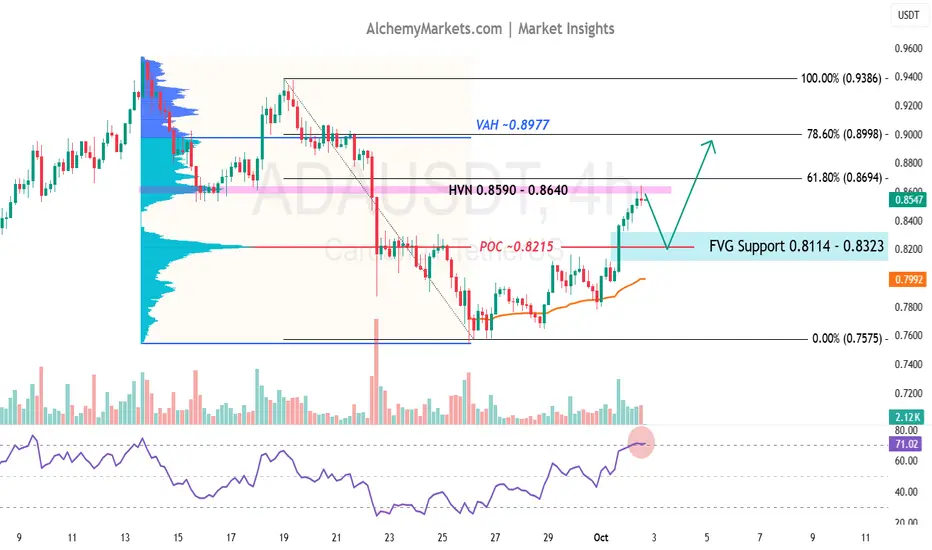
As crypto rallies off the back of the government shutdown, ADA has convincingly reclaimed a critical Point of Control (POC) at $0.8215 . That means the heaviest traded level from the last down-leg couldn’t reject price — a bullish sign.
Now ADA is pressing into resistance: a high-volume node overlapping with the 61.8% retracement of the down-move.
Adding to the bullish bias is the 4H Fair Value Gap (FVG $0.8114–$0.8323) , which aligns neatly with the POC. But note: candles are shrinking on this grind higher, hinting a pullback may come first. That FVG is the zone to watch if it does.
📌 Levels to watch
$0.8114–$0.8323 – FVG support / POC
$0.8590–$0.8640 – HVN / 61.8% fib resistance
$0.8977–$0.8998 – VAH / 78.6% fib resistance
Key takeaway: ADA could retrace from here or a little higher at the 61.8% retracement , where volume-backed resistance sits. If it does, keep an eye on the FVG/POC support to provide a bounce and set up a test of the VAH — a critical level as it aligns with the weekly trendline.
JD 1D: Bulls taking the lead?On the daily chart, JD.com broke out of a falling wedge, moving above both MA50 and MA200. That’s a strong technical signal hinting at a potential mid-term trend reversal.
Upside targets are mapped at $39.8 and $46, with Fibonacci levels suggesting a possible extension toward $52 if momentum holds. Support remains around $33–35, and as long as the price stays above it, buyers are in control.
From a fundamental perspective, JD continues to reshape its business, expand online services, and benefit from China’s economic recovery. Competition with Pinduoduo and Alibaba is tough, but technically bulls seem to have the upper hand.
Tactical outlook: watch the MA200 - staying above it keeps the growth scenario intact.

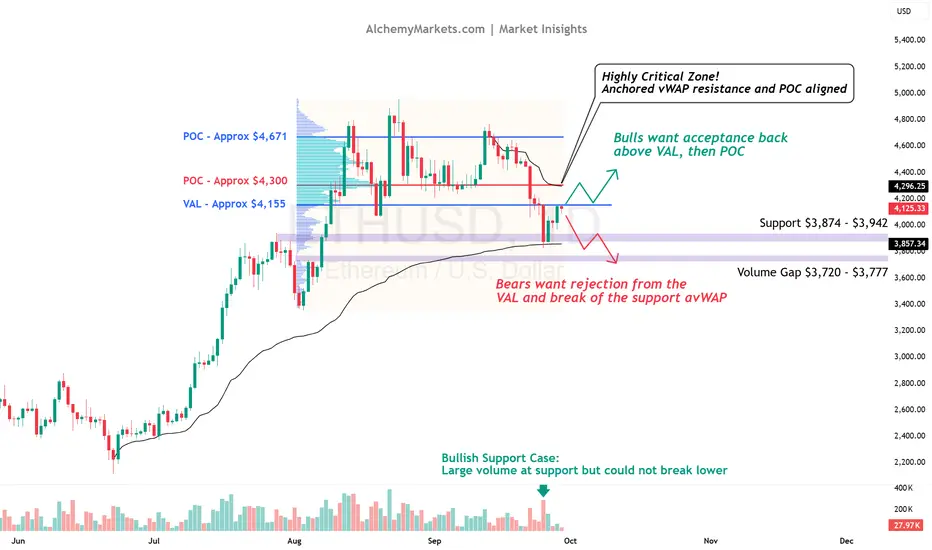
Ethereum Simple Analysis: Back to $4,000 or $4,300 next?After dropping from $4,700, ETH has actually held up better than BTC.
Now it’s sitting at a key decision point — retesting the Value Area Low (VAL) at $4,155, which marked the base of August’s rally from $3,400 to $4,900.
The bigger picture still leans bullish. ETH is holding above the anchored vWAP from July (~$3,857), the average entry point of that entire rally. Staying above means the market is still backing the trend. Lose it, and sentiment flips.
📌 Levels to watch:
$3,857 (anchored vWAP support)
$4,155 (VAL battleground)
$4,300 (critical resistance)
$3,720–$3,777 (volume gap support)
The fight now is simple:
Reject $4,155 → confirms weakness, ETH stays trapped under resistance.
Reclaim $4,155 → opens the door to rotate higher, with $4,300 as the real test.
Why $4,300? Because it’s both the Point of Control (POC) and anchored vWAP from the latest decline - meaning that it's both the most traded price level AND the average price since its decline.
Key takeaway: We are currently testing key resistance. Watch closely for a reaction and if we reclaim $4,155, expect the real test at $4,300.
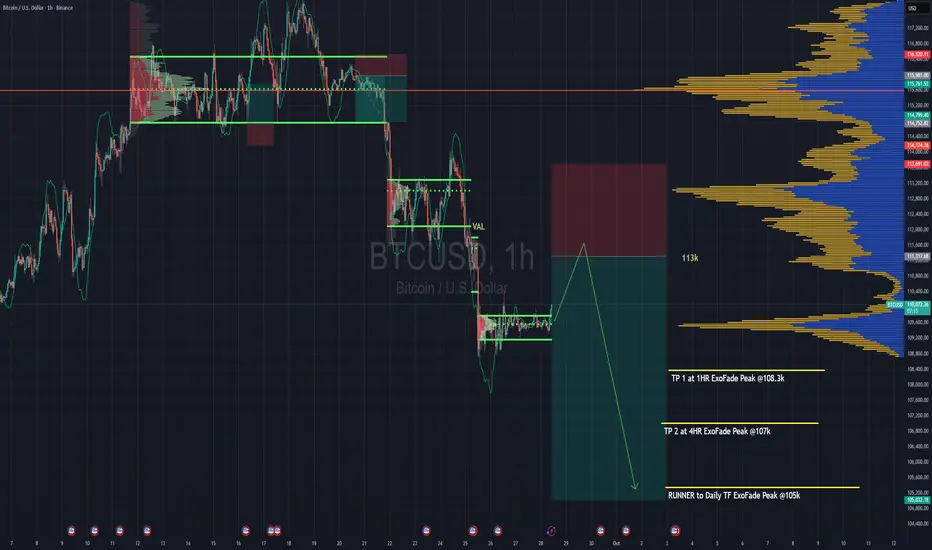
Looking to Short Bitcoin From Here : Winter Is Coming !!Looking to short BTC for a continuation of the downtrend.
Trend is your friend is what they say.
So we're basically going to wait for a pullback to 113k range then enter a sell.
The sell entry caters for both H4 & Daily timeframe trend, so it's a strong one.
The sell entry range also has the VAL of the last rotation we had from Sept 21st to Sept 24th when we finally broke down from it at 112k. That VAL should be a strong point for rejection, it'll be one of the places where we'll truly get to test the strength of the bears ( that's if we even make it that far )
TP targets are based on ExoFade peaks of the H1, H4 and Daily timeframe.. You can add the ExoFade to your charts to follow on your own charts as well.
VAL - Value Area Low of the volume profile
Strategy => Volume + Trend + Lots of coffee
JPY Futures - Can We Take Out The 3rd ExoFade PeakTo clear any confusing for those that dont know, 6J Futures aka JPY/USD, is the inverse of your regular USD/JPY. Got it?
It's currently in a strong uptrend, since the dollar is in a free fall.
We've been taking out the ExoFade peaks and the trend looks juicy. Taking the 3rd pullback bounce of a uptrend is not my favorite thing to do cos each time you get a bounce, the probably of the next of failing goes up significantly cos sellers need to feed their families too lol.
The first bounce in a new uptrend has a higher success rate and with much lower risk required.
The ExoFade peaks are great for setting price targets and prediction, and we can see the last 2 peaks we're successfully taken out. If the trends momentum stays intact, i expect us to take out the 3rd one as predicted.
London session is in a couple of hours, which will inject more volatility and we have unemployment news in the morning, which can disrupt the trend.
We'll see how it goes.

Watching for wave A structure on LinkOur target of $27 did not play out as I thought with an extended wave 5. I think too much hype and too many leveraged long positions caused a breakdown in the play but we look good if we stay moving in the next few days to see a move to the upside with the same target likely.
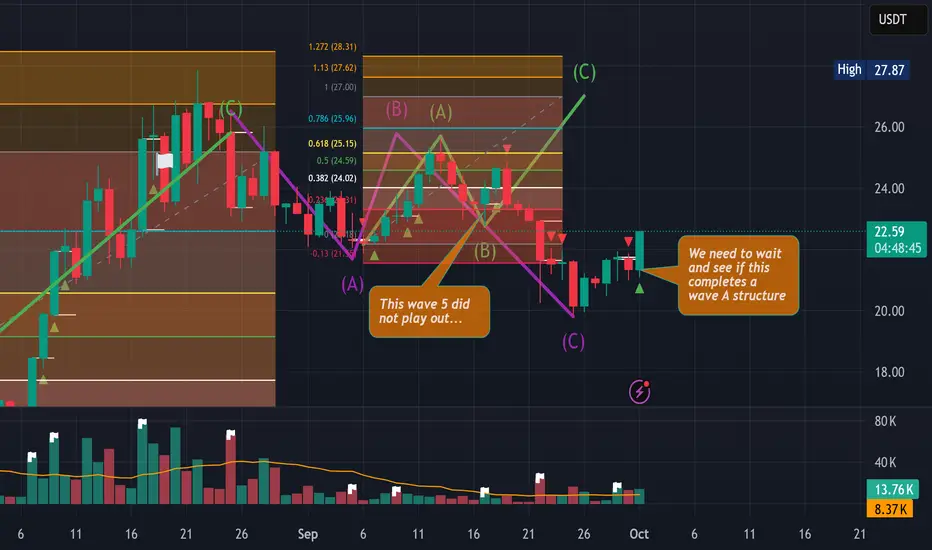
LINKUSDT just entered wave CI was watching and buying into the falling knife at the bottom of wave B looking for my indicator to confirm the bottom with a spike in volume. This is the move I make over and over. I use my indicator and analysis tools to determine the wave count and enter long at the bottom of wave B. This is my classic go to for trading. I bought the dip last night as we dipped under $23 and I am looking for a target of $27

Coqusdt is long to the skyHello my dear friends,
today I want to introduce a meme coin called COQ, or our very own Mr. Rooster. This rooster is going to soar in a way that even an eagle won't catch up to it. This is the biggest AVAX meme coin, which is about to explode soon. Be sure to check my previous analyses regarding Bonk and Trump. I think COQ is following Bonk's path, which after a 96% drop, grew about 32,000% in 8 weeks. Many aspects of fundamentals and technicals regarding this topic have been reviewed. Wishing you success and profit.
⚠️ Disclaimer ⚠️
⛔ Every trade is at your own risk ⛔

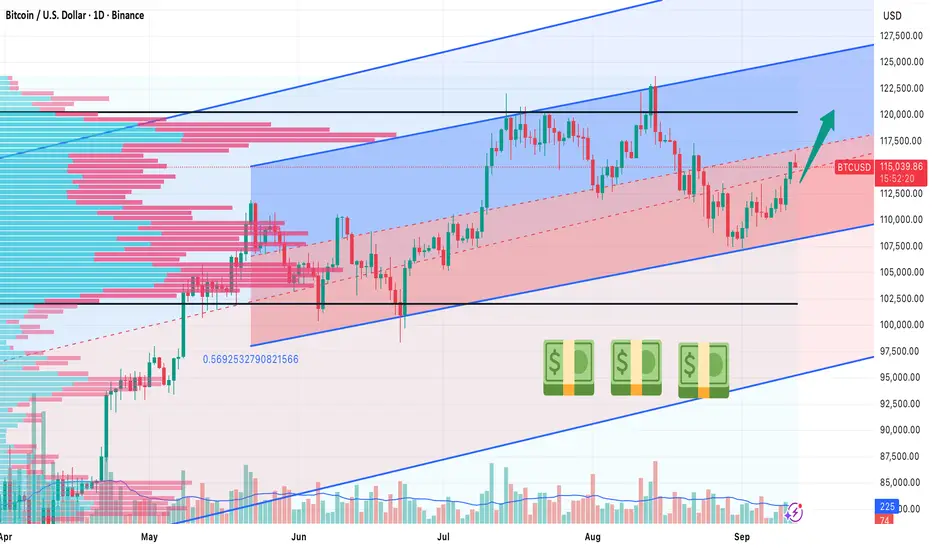
BTC/USD Near the Median of Weekly and Daily Regression TrendsHow to Approach the Setup
Long‑term bias: bullish (weekly regression channel slopes upward, daily channel is flat‑to‑slightly bullish).
Typical trader mindset: wait for an upward breakout with strong volume or place a buy‑limit order around the round‑number level of 115,000 USD and aim for an initial target near 120,000 USD (+4%).
Price action and technical context
BTC is currently trading close to the median line of two overlapping regression‑trend channels:
Weekly Timeframe: Channel slope Upward - Interpretation : Long‑term bullish pressure
Daily Timeframe: Channel slope Flat‑to‑slightly up - Interpretation : Short‑term equilibrium, slight upside bias.
The price sits in a narrow corridor bounded by the upper and lower regression lines. Because the weekly channel is tilted upward, the overall market structure still favors higher highs. The daily channel’s flatness suggests that any move will need a catalyst—typically a surge in buying volume or a breakout above the weekly upper trend line.
Key technical reference points
Upper daily regression line: ~125,000 USD – the first resistance level that, if breached with volume, could trigger a sustained rally.
Median (current price area): ~117,000 USD – a psychologically clean round number that also aligns with the median of both channels.
Lower daily regression line: ~108,000 USD – a safety net; a break below would invalidate the bullish bias.
Trade‑the‑setup options
1. Wait for a breakout – Enter the trade when the price closes above the weekly upper regression line and the accompanying volume is at least 1.5 times the 20‑day average. This condition confirms that the bullish bias is actually materialising and helps avoid false “whipsaw” moves. In practice, traders use a market order or place an aggressive limit order just above the breakout level (around 118,600 USD).
2. Buy‑limit at 115,000 – Set a limit order at the round‑number median of 115,000 USD. The round number acts as a natural “magnet,” and because the price is already near the median, this approach works well in a range‑bound market. The typical execution is a limit order at 115,000 USD with an initial profit target of 120,000 USD, representing roughly a +4 % gain.
Both methods assume the trader will monitor volume and short‑term momentum (RSI, MACD) to confirm that the move is not a temporary spike.
Momentum and volume cues
RSI(14): Values climbing above 55 support the bullish bias; a dip below 45 warns of potential reversal.
MACD: A bullish crossover (MACD line crossing above the signal line) on the daily chart adds confidence to a breakout or limit‑order fill.
Volume: A surge to at least 150 % of the 20‑day average on the day of the breakout dramatically raises the probability of a sustained move.
Risk considerations
Stop placement: If the price falls below the lower weekly regression line (≈111,000 USD) or breaches the median downward with a sharp volume spike, exit the position.
Position sizing: Because BTC’s volatility can be extreme, allocate a modest percentage of the portfolio (e.g., 2‑3 % of equity) to this speculative play.
Alternative defined‑risk structures: Traders uncomfortable with outright exposure can use a debit call spread (e.g., buy the 115,000 USD call, sell the 120,000 USD call) to cap downside while preserving upside to the first target.
Bottom line
When BTC/USD hovers near the median of a bullish weekly regression channel and a flat‑to‑slightly bullish daily channel, the market is in a neutral‑to‑bullish equilibrium. The prudent approach is either:
Patience: Wait for a volume‑driven breakout above the weekly upper trend line, or
Precision: Place a buy‑limit order at the clean 115,000 USD level and target the first upside milestone at 120,000 USD (+4%).
Both strategies rely on confirming momentum and volume before committing capital, while keeping a tight stop below the lower weekly regression line to protect against a sudden reversal.
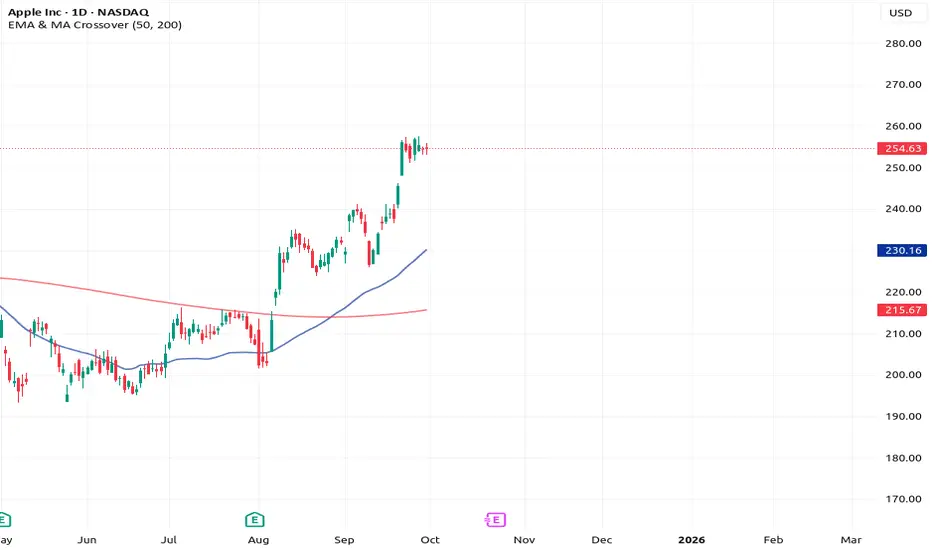
Apple + The 3 Step Rocket Booster StrategyI know i said i would stop talking about
stocks but i thought about you..
Maybe you are still in the making it stage
Maybe you only have access to forex options
but remember if thats the case dont
trade above x4 margin
Especially if you are dealing with stock
options.
Its because of you i fought hard to
design the Rocket booster
strategy.
This is the strategy i started with
its beginner friendly and
very easy to understand
it has 3 steps. i think the reason it become
so popular is because its very simple
so here are the following 3 steps:
1-The price has to be above the 50 EMA
2-The price has to be above the 200 EMA
3-The price should gap up
The last step is very important for you
to understand because it filters out
the noise in the trading.
How?
Because it has to be trending upwards
on the week and the day to signal
a beginner friendly entry for you.
Look at NASDAQ:AAPL
you can clearly see that its gapped up.
Rocket boost this content to learn more.
Disclaimer: Trading is risky
please use a simulation trading account
before you trade with real money.
PLTR goes higherPrice just crushed the resistance with big volume slowly coming back in. Watch it make a new ATH

Analysis on NIFTY50(short term bearish)1. Index fell sharply from 25400 to 24600
2. it is sitting now at 24600 support zone testing before in early September.
3. Indecision near support.
4. Selling pressure earlier was strong.
NIFTY50 is still in short-term downtrend, holding support at 24600.
Disclaimer:
I am NOT a SEBI registered advisor nor a financial advisor.
Any investments or trades I discuss on my blog are intended solely for educational purposes and do not represent specific financial, trading, or investment advice.
Disclosure:
I, the author of this report, and my immediate family members do not have any financial interest or beneficial ownership in the securities mentioned herein at the time of publication.

USD/CAD Support at 1.3897: Volume Cluster + Fair Value Gap SetupUSD/CAD has a strong support at 1.3897, created by a heavy volume cluster during the recent uptrend. At the start of this cluster, buyers defended the level and formed a Fair Value Gap, adding strength to it. I’m waiting for a pullback to this level to go long, despite the minor risk of a weak low nearby. The setup still offers a solid opportunity for buyers.

AUD/USD Resistance at 0.6596: Heavy Volume Cluster & Weekly POC AUD/USD shows strong resistance at 0.6596, marked by a heavy volume cluster formed before last week’s sharp sell-off. The level also aligns with a stacked Fair Value Gap and the weekly Point of Control, adding confluence. Since the initial reaction at a weaker high already played out, the main setup now is to wait for a pullback to 0.6596 and look for short opportunities.

GBP/USD Support at 1.3410: Volume Profile, FVG & VWAP ConfluenceA new support has formed at 1.3410 on GBP/USD. The level aligns with Friday’s high, a heavy volume cluster from the recent uptrend, and a Fair Value Gap. The price also flipped this area from resistance into support. With VWAP already tested on a short trade, the long setup remains valid—waiting for a pullback offers a strong opportunity.

Volume profile indicator Volume Profile is an advanced charting tool that displays trading activity (volume) over a specified period at specified price levels
Volume Profile plots a histogram on the chart to show significant price levels based on volume (typically daily or weekly sessions)
