Selena | XAUUSD – 30M – CPI-Driven Bullish StructureFOREXCOM:XAUUSD PEPPERSTONE:XAUUSD
Gold is consolidating after a strong impulsive bullish expansion, with price respecting the rising channel structure. The current pullback is corrective, occurring below HTF resistance and above channel support. With CPI Core news in play, volatility is expected, but structure suggests liquidity is being built rather than distributed, favoring continuation if support holds.
Key Scenarios
✅ Bullish Case 🚀 → If price holds above channel support and internal demand, a push toward buy-side liquidity above 4,630 and continuation toward 4,680–4,740 remains valid.
❌ Bearish Case 📉 → A strong break and close below channel support would invalidate bullish structure and open deeper retracement toward lower demand zones.
Current Levels to Watch
Resistance 🔴: 4,630 – 4,660
Support 🟢: 4,560 – 4,520
⚠️ Disclaimer: This analysis is for educational purposes only. It is not financial advice.
Wedge

Selena | XAUUSD –Weekly Structure|Correction Before ContinuationFOREXCOM:XAUUSD PEPPERSTONE:XAUUSD
Market Overview
XAUUSD delivered a strong bullish expansion and is now consolidating near the upper range, signaling potential profit-taking before continuation. As long as price holds above the internal structure and demand support, bullish momentum remains valid. A deeper pullback into demand would offer healthier continuation rather than immediate breakout chasing.
Key Scenarios
✅ Bullish Case 🚀 → Shallow pullback or structure hold above demand opens upside continuation toward liquidity resting above recent highs (4,620+).
❌ Bearish Case 📉 → Failure to hold the channel and clean acceptance below demand exposes a deeper correction toward lower range support.
Current Levels to Watch
Resistance 🔴: 4,600 – 4,620
Support 🟢: 4,480 – 4,450 (Strong Buying Zone)
⚠️ Disclaimer: This analysis is for educational purposes only. It is not financial advice


OKB - The Level Everyone Is Watching!OKB is currently sitting at a very strong rejection zone , and this one is hard to ignore.
Price is reacting around the $100 round number, which lines up perfectly with a clear demand zone. This area has already proven its importance in the past, and once again, buyers are stepping in.
Structurally, OKB is still trading inside a falling wedge, which is typically a bullish formation when defended from below.
As long as this demand + round number confluence continues to hold, I’ll be looking for trend-following long setups, targeting a move back toward the upper bound of the falling wedge.
⚠️ Disclaimer: This is not financial advice. Always do your own research and manage risk properly.
📚 Stick to your trading plan regarding entries, risk, and management.
Good luck! 🍀
All Strategies Are Good; If Managed Properly!
~Richard Nasr

Update: IREN Limited (IREN) - structure beats emotionsIREN Limited operates in Bitcoin mining and AI cloud infrastructure, focused on renewable energy and scalable data centers. Mining is the core revenue driver, AI services are still small but growing fast.
On the daily chart, a falling wedge has been broken to the upside, followed by a clean retest. The structure is holding. Price is now sitting in a strong daily support zone at 36–38, aligned with the 0.618 Fibonacci level.
MACD is turning bullish on higher timeframes, and short- to mid-term moving averages are stabilizing. This looks like accumulation after a deep correction, not a random bounce.
By the end of 2025, IREN scaled materially.
Revenue grew from $184M in 2024 to roughly $485M in 2025.
Bitcoin mining remains the main contributor, while AI Cloud Services added about $16M and continue expanding.
Consensus estimates point to ~$230M revenue in Q2 2026. EPS is still negative, which fits a capital-intensive expansion phase.
As long as price holds 36–38, the market is pricing a move toward 50 → 60 → 70.
This is not a one-day trade. It’s a structural recovery setup.
The chart already did the talking.

SPY/QQQ finishing wave Bs before CPICurrently I'm leaning towards SPY and QQQ both finishing up B waves and are prepping for a wave C drop potentially coming from CPI tomorrow. I've been trying to reconcile the 2 different wave structures of SPY putting in new ATHs and QQQ still struggling. Both are divergent on several time frames and I think this structure makes sense unless we continue up tomorrow after CPI.

Breakouts 1Wbroken the weekly level, entry was at th break of the wedge in 30min yetserday. expect to sweep liquidity at the weekly swing and continue to the weekly demand zone at 160. and expect to drop drastically. we shall monitor vigor and strength approaching that zone and sell to any potential area after it reaches.

CPRT LongWedge Trendline break
Long entry 40
Stop 37
Target 49
Risk management is much more important than a good entry point.
I am not a PRO trader.
In my trading plan, the Max Risk of each short term trade should be less than 1% of an account.

Last night to be a live in tradingMy idea we will see sell tomorrow
We see monday candel closes in wicks seems to be reversal we tool sell side lequidity

Kiwi Breakout Loading? Watch the WedgeTesting downtrend resistance within what resembles a falling wedge, traders should be alert for a potential bullish breakout in NZD/USD that may see the pair retest the December highs in the not-too-distant future.
Should the price climb and hold above the downtrend currently located around 0.5780, longs could be established on the break with a tight stop beneath for protection against reversal.
Convention suggests a breakout may lead to an eventual retest of resistance at 0.5843, where it stalled in December. However, keep a close eye on price action at 0.5800 given the pair’s tendency to gravitate towards big figures. Should a breakout falter around 0.5800, consider squaring the position.
While the oscillators reveal flagging upside strength, providing a neutral signal on directional risks, there are fleeting signs emerging that momentum is starting to swing back in favour of the bulls. A continuation of those trends would likely improve the probability of a bullish breakout sticking.
From a fundamental perspective, details within today’s U.S. CPI report provide an obvious catalyst to spark a violent move in the Kiwi, with a soft outcome the most likely to deliver upside for the pair. Therefore, price action post the release should be treated as far more reliable than that beforehand.
Good luck!
DS

GRASIM – Price Compressing Toward Major Trendline SupportPrice is getting squeezed between a falling trendline and a rising support. This type of compression usually ends with a strong move. A clean descending trendline from the recent swing-high shows short-term selling pressure. A major rising trendline from the bottom still holds the structure.
Price is drifting towards the intersection zone of both trendlines. If price taps the rising trendline and holds, a bounce + trendline breakout is possible.
Save this setup — this zone decides the next trend.

Too squeezy to ignoreThe VIX ETF just broke up the falling wedge in the weekly timeframe. I just bought this, it might pull back to test the broken resistant at 34-35. the VIS also is very low and trying to go up. And the SPY is close to ATH. MY SL triggers only if a weekly candle closes below 34.
Good luck

Copper Macro Bullish Ascending Wedge TriangleLong term bullish on Copper
Looks like 50% from here to reach standard Asc Triangle target
Look for various set up entries on the way up
If Copper is going up then Copper miners will go up too and some may be in Asc Wedges too
If the price drops back to the BAGL Bottom ascending grind line then that will be a nice low risk entry point
Good luck with your trading

AUDCAD going long!Hello! This is your finance professional, and here is a new high-quality analysis.
Today we will review the AUDCAD currency pair.
On the chart, we can see that after a strong impulse the price went into a correction. The decline did not follow a usual structure but formed a wedge pattern.
A wedge pattern is a reversal structure. That is exactly what happened — the price reversed and we saw the continuation of the uptrend.
Right now, I have taken a long position according to my trend-following strategy and set the target at the asset’s high.

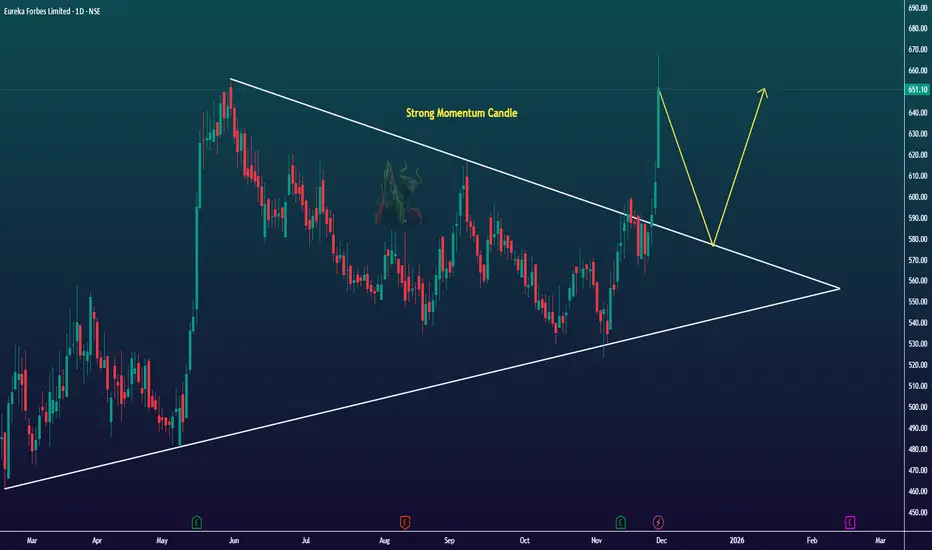
Momentum Shift Detected in EUREKAFORBNSE:EUREKAFORB shows a strong momentum candle on the daily chart after weeks of choppy structure. Price is pushing into a higher zone.
momentum is clear, but structure is still broad. Watching how it behaves in the next few sessions.
Bullish potential detected for KLREntry conditions:
(i) higher share price for ASX:KLR along with swing up of indicators such as DMI/RSI, and
(ii) observing market reaction around the $0.19 resistance area from 21st November.
Depending on risk tolerance, the stop loss for the trade would be:
(i) below the potentially rising 30 day MA (currently $0.161), or
(ii) below the recent swing low of $0.15 of 29th December, or
(iii) below the ultimate swing low of $0.125 of 15th December.

Rising Wedge Pattern S&P 500There is clear a Rising Wedge Pattern formed on S&P 500 4h chart .
There was even a retracement from all-time highs of 6979 back inside the wedge before the weekend.
My suggested SL is 7030-7050 and TP 6500-6550 for the short-to-mid term.
On a larger scale, there is also a huge channel that we are testing the top of right now:
Going all the way back to 2008..
It could easily end up like this:
So for longer term I can see 6100, 5500, 5000 and if recession hits than even 3500.
There has never been such a major Fed hiking and cutting cycle that did not eventually cause a recession. Also, the labor market is weaker than the headline numbers make it seem. Lots of massive downward revisions on NFP. Even the unemployment number is growing slowly, mostly because Labor Force Participation is dropping. If we account for that, then the real unemployment rate is more like 5.5%.
Here are some more examples of rising wedges going back to the pandemic:

BUY GOLDGold has been forming out a falling wedge hence setting up for a major move up, lets get this money!... Always manage risk.... Cheers

GBPUSD - Bearish Rising WedgeHello traders,
GBPUSD has formed a rising wedge pattern.
The support line has now been broken , which suggests a potential bearish move.
🎯Target: 1.33770

EUR/NZD – Weekly breakdown trigger from rising wedgeEUR/NZD is getting squeezed.
Price has been walking up inside a rising wedge for a while, but it’s starting to look tired right around that 2.02–2.05 area. I’m not interested in guessing the top. I only want it if it actually breaks.
Game Plan
No trade unless we get a weekly close under 2.020
Ideally it breaks, then comes back to 2.02 and fails.
Targets
1.990 first trouble area
1.980 next support
Invalidation
If it reclaims and holds above 2.050, I’m out / not taking it. That’s basically the wedge saying “false alarm”.
Simple one: wait for the weekly confirmation. If it doesn’t give it, I’m happy to sit on my hands.

EJ Falls Into A WedgeOANDA:EURJPY has formed a Falling Wedge with Lower Highs into Lower Lows!
Price has tested the Falling Support three times with the Falling Resistance, so far, only tested twice.
Typically a Falling Wedge delivers a Bearish Breakout with price falling to the downside!
If price does make a rise, we should look for it to make a third test of the Falling Resistance and if successfully rejected, we could see price drop back to the Falling Support.
Regardless, once price makes a valid Breakout of either leg and Retests, this will generate trade opportunities to take to either the Overhead Resistance or Underlying Support levels!

#BTC BTCokay so the bounce on 90.4k was weak, test upto 93k possible but we looking at 88k as our bottom for a full retest

GBPCAD Triple Top Points To Potential Triple EventOANDA:GBPCAD on a multi-timeframe analysis allows us to breakdown this False Breakout of the Rising Wedge on the Weekly chart, lets check it out!
Price on the Weekly had made a Bearish Breakout of the Rising Wedge but price has had a great Bullish rally all week and undid all the Price Action following the Breakout of the Rising Support.
On the Daily since the Low of the Breakout @ 1.83238, OANDA:GBPCAD has begun to form an Expanding Range with Higher Highs laying out a Rising Resistance.
- MACD is signaling Bullish with lines just crossing 0 and Histogram forming green bars
Everything is saying Bullish but,
On the 4Hr we can see that Price has formed a Triple Top at the Resistance Level formed from the Highs of Dec. 4th around 1.86328 - 1.86675.
- RSI is showing a Divergence of Highs in Price
- Volume is waning as the Highs form
- MACD is signaling Bearish with a Crossover event and Histogram forming red bars
Now if Price falls below 1.85997, this will confirm the Triple Top and will mean we will be looking for Price to fall down to the AOV around 1.8546 - 1.8528.
If Price is able to find support around this level, this would Confirm the Bullish Bias on OANDA:GBPCAD on the Daily and Weekly.
