NZDUSD: Bearish Trend Continues! 🇺🇸🇳🇿
NZDUSD will most likely continue falling next week,
following a confirmed breakout of a support line of a bearish flag pattern
on a daily time frame.
I will expect a bearish continuation at least to 0.5685 level.
❤️Please, support my work with like, thank you!❤️
I am part of Trade Nation's Influencer program and receive a monthly fee for using their TradingView charts in my analysis.
Wedge

Bitcoin Update – November 1, 2025 - Revised 2026 target $46KBitcoin and Crypto Market Update – November 1, 2025
Bitcoin has completed its cup-and-handle pattern , hitting the technical target near $118,000 before rolling over into a fresh rising-wedge formation . The new structure is supported by declining volume , hinting at fading momentum and a potential pullback toward $46,000 .
Today’s move mirrors broader macro caution—the Fed’s pause on rate cuts and Trump–Xi trade tensions have triggered a wave of risk-off sentiment. Bitcoin is down 3.8% to $110,063 , Ethereum −3.6% ($3,853), and XRP −4.1% ($2.51).
Despite the dip, ETF inflows remain strong (BTC +$202 M, ETH +$246 M), showing institutions still buying the weakness. November historically delivers +42.5% average gains, but traders should stay alert as the rising wedge matures.
Technical summary:
* ✅ Cup & Handle target ≈ $118 K (completed)
* ⚠️ Rising Wedge forming → Target ≈ $46 K
* 📉 Volume decline = weakening trend strength
* 🟢 Institutional inflows = long-term support, volume declining over 5-10 year cycle
📊 Posted by Market Monkey — decoding the market’s next move.

DIS Falling WedgeDis rallied from April '25 until July '25 and then consolidated around $120, forming a bullish falling wedge. The red line is the 200-day moving average which is acting as support at $110. It has been bounced off twice. The seasonals look bullish going into the last 2 months of the year when considering 2023 and 2024 price movement. The P/E ratio is 17.66 which is almost a 3rd of its 2-year moving average which is 47.43, indicating a low valuation with lots of room for upside. The aqua line is the 50-day sma which needs to be closed beyond along with the top side of the rising wedge before this thing can really take off. Fundamentals look bullish as well, with an uptrend in annual revenue growth and downtrend in debt/equity.

Gold Trade IdeaGold is testing back 4000. 2 additional resistances also share the 4000 so it will be a strong intraday resistance. The idea came with 3.14 RR.

AUDCHF: Intraday Bullish Signal 🇦🇺🇨🇭
Quick update for AUDCHF.
Earlier, we spotted a confirmed breakout of a key
daily horizontal resistance.
Retesting the broken structure, the price successfully
violated a resistance line of a falling parallel channel on an hourly time frame.
It suggests a strong buying interest.
We can expect a move up now at least to 0.5264
❤️Please, support my work with like, thank you!❤️
I am part of Trade Nation's Influencer program and receive a monthly fee for using their TradingView charts in my analysis.

#ZECUSDT #1D (ByBit) Rising wedge near breakdownZcash had a great bull run but looks exhausted right now on daily TF.
It's printing a bearish divergence between price and volume + RSI, a retracement seems likely.
⚡️⚡️ #ZEC/USDT ⚡️⚡️
Exchanges: Bitget Futures
Signal Type: Regular (Short)
Leverage: Isolated (3.0X)
Amount: 3.9%
Current Price:
353.99
Entry Zone:
355.71 - 392.39
Take-Profit Targets:
1) 298.48
2) 241.58
3) 184.67
Stop Targets:
1) 437.28
Published By: @Zblaba
CRYPTOCAP:ZEC BYBIT:ZECUSDT.P #1D #Zcash #Privacy z.cash
Risk/Reward= 1:1.2 | 1:2.1 | 1:3.0
Expected Profit= +60.6% | +106.2% | +151.9%
Possible Loss= -50.7%
Estimated Gaintime= 1-2 months

Shorter Timeframe - Bitcoin targets 118.5KBTC has been closely following WYCKOFF method ( highlighted in yellow bars).
Descending broadening wedge pattern which formed last week with the breakout above targets 118.5K to b exact which perfectly aligns with the Wyckoff lines.

COMEX Gold Futures : Technical View
Gold futures are forming a falling wedge pattern, currently trading at ₹3,995. A break below ₹3,930 could indicate a short-term correction, while failing to sustain above ₹4,050 might lead to continued downward pressure.
Key Levels:
- Current Price: ₹3,995
- Support: ₹3,930
- Resistance: ₹4,050
- Potential Outcome: Break below ₹3,930 may lead to further decline, while sustaining above ₹4,050 could indicate a bullish reversal
Technical Analysis:
The falling wedge pattern suggests a potential reversal or continuation of the trend. If gold futures break below ₹3,930, it may signal a short-term correction. Conversely, sustaining above ₹4,050 could indicate a bullish reversal.

BTC - Bouncing From the Sweet Spot?⚔️Bitcoin is currently sitting at a high-confluence zone , where the daily support perfectly aligns with the lower bound of the ascending wedge. This intersection makes it a prime area to look for potential bullish reactions.
🏹As long as this support holds, I’ll be looking for long opportunities, expecting BTC to push higher within the wedge structure.
The first target for this bullish move lies around the upper bound of the wedge, which conveniently lines up with the supply zone near $122,000, a key resistance to watch.
📉If the support fails, the structure could shift, but for now, bulls still have the technical edge.
⚠️ Disclaimer: This is not financial advice. Always do your own research and manage risk properly.
📊All Strategies Are Good; If Managed Properly!
~Richard Nasr

USD/CHF: Wait For BreakoutHere is a detailed trading plan for ⚠️USDCHF for the remainder of the week.
The market is currently testing a significant daily/intraday horizontal support level.
A bullish confirmation would be indicated by a bullish breakout of the resistance line of a falling wedge pattern on an hourly timeframe.
An hourly candle closing above this trend line would provide a strong bullish signal.
Following this, a bullish continuation would be anticipated towards the 0.8020 level.

Opendoor Technologies (OPEN) – Bulls Still Holding the Door OpenWhat a ride it’s been for OPEN!
Back in early July 2025, the stock finally broke above its 50-day MA, and that was the spark that started an incredible rally — all the way to a major resistance zone from June 2022.
Then, as always, the market had to test everyone’s patience — a shooting star reversal formed, price pulled back into the 0.382–0.5 Fibonacci zone, and built a solid double bottom.
Once that double bottom broke out around 13–14 August, it was rocket fuel — a massive +247% run until 11 September 2025! 🚀
Since that peak, OPEN has been cooling off — retracing with low volume and shaping a falling wedge, which usually hints at bullish continuation. The price even bounced at EMA-50 and printed a hammer candle, showing that buyers are still defending the trend.
As long as the price holds above $6.23 (hammer support), bulls are still in charge.
Break that level? Then the bears might finally get a turn.
Until then — the door’s still open for another breakout! 😉
Trade Idea 💡
Bullish scenario: Wait for a breakout above the falling wedge with volume — that’s your green light.
Support to watch: $6.23 (hammer low).
Stop loss: Just below that support.
Take profit: Trail as long as price stays above the MA-50 or aim for the $13.70 zone .

XAUUSD Short: Selling the Bounce Within the Descending ChannelHello, traders! The price action for Gold (XAUUSD) has been dominated by a bearish structure since the breakout below the ascending channel and rejection from the SUPPLY ZONE 2 near 4250. This move initiated a clear downtrend, forming a descending channel that has guided the market lower through a sequence of impulsive declines and short corrective rebounds.
Currently, the price is testing the Demand Line of this descending channel, located just above the Demand Zone around 3867. This zone represents a key area of potential buying interest that previously acted as a reaction point during earlier phases of the uptrend. In my view, the market is now entering a critical stage. A temporary corrective rally towards the upper boundary of the channel (near the Supply Zone 1 at 3950–4100) is likely before sellers may step in again to resume the broader downtrend.
My scenario anticipates that this corrective bounce will be limited, with sellers defending the Supply Zone 1, leading to another move downward toward the Demand Zone and potentially lower levels. A confirmed reversal signal in this area, however, could offer a long opportunity for a larger bullish impulse later on. Manage your risk!

Gold Side Trade IdeaOur main trade is ongoing with our stoploss level taken down to prevent any risk of loss while keeping our TP level unchanged.
With that in mind and the positive news from AI sector and possibility of fentanyl tariffs written off for China, gold's upward correction might come to a quick end. A wedge formation formed close to 4000 also supports the downward case. Entry: 3987 Stop: 4013 TP: 3914
Note: This is a side trade idea and indipendent from our main trade.

NAS100 – Technical Analysis | Bulls Take ChargeNAS100 extended its bullish rally after breaking above 25,190.00 and 25,600.00, confirming strong buyer control. The index continues to print higher highs, with momentum favoring further upside as long as price remains above the breakout zone.
Support at: 25,600.00 🔽 / 25,190.00 🔽 / 25,000.00 🔽
Resistance at: 25,900.00 🔼 / 26,000.00 🔼
🔎 Bias:
🔼 Bullish: Sustained trading above 25,600.00 supports continuation toward 25,900.00 and possibly 26,000.00.
🔽 Bearish: A drop back below 25,190.00 could trigger a correction toward 25,000.00.
📛 Disclaimer: This is not financial advice. Trade at your own risk.

$FLWS long to above $10?You can see that flows has been consolidating in a falling wedge for 3 years. With the recent thrust higher, I think we can see a breakout.
NASDAQ:FLWS looks like it's finding a bottom here in the short term, it's retested the support it broke out from originally, now looks to be bouncing.
I've entered at $4.80 and $5.50 with a view that this will go to the upper resistances, let's see how it plays out from here.

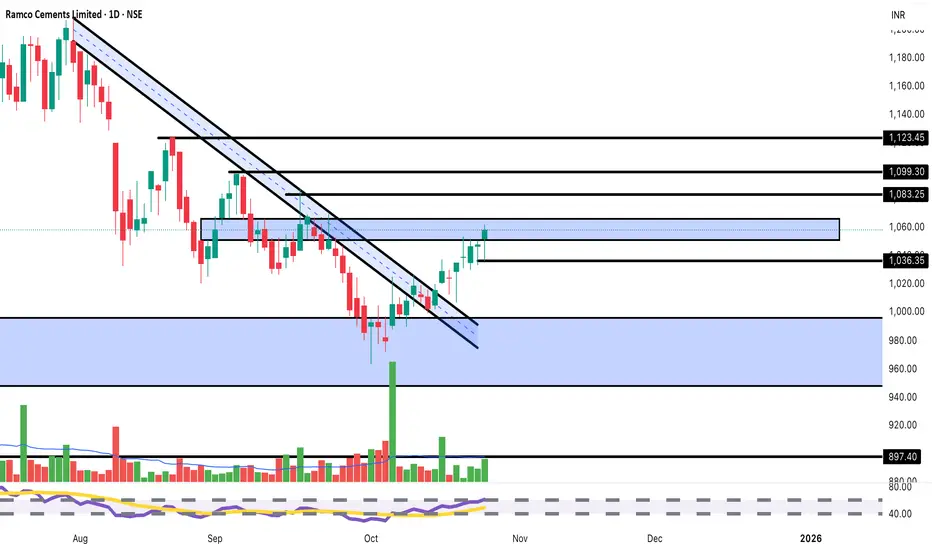
Ramco Cements Breaking Key Resistance | Target 1,100+BUY Setup 🏗️
Entry: ₹1,058-1,065 (Current Level)
Target 1: ₹1,083-1,090
Target 2: ₹1,099-1,110
Target 3: ₹1,123-1,135 (Extended)
Stop Loss: ₹1,036
Technical Rationale:
Breaking above descending channel (blue shaded area) - major bullish reversal
Strong momentum with +1.11% gain today
Price reclaiming 1,060 resistance zone
Breaking above both declining trendlines convincingly
High volume (343.03K) supporting the breakout
Consolidation zone (1,000-1,060) now acting as support
RSI trending upward, showing momentum building
Cement sector showing strength on infrastructure demand
Multiple resistance levels mapped: 1,036, 1,083, 1,099, 1,123
Clear support at 1,000 psychological level
V-shaped recovery from October lows
Risk-Reward: Strong 1:3+ ratio
Pattern: Falling wedge/descending channel breakout - highly reliable bullish reversal pattern
Strategy: Medium-term swing trade - Book 30% at T1 (1,085), 30% at T2 (1,105), trail remaining with SL at 1,065 after T1
Key Levels:
Breakout Zone: 1,060 (critical level crossed)
Strong Resistance: 1,083, 1,099, 1,123
Major Support: 1,036, 1,000, 980
Sector Catalyst:
Infrastructure spending boost expected
Cement demand picking up seasonally
For educational purposes only. Not SEBI registered. Major pattern breakout - manage position sizing appropriately. Cement stocks can be volatile. Conduct thorough research before investing.
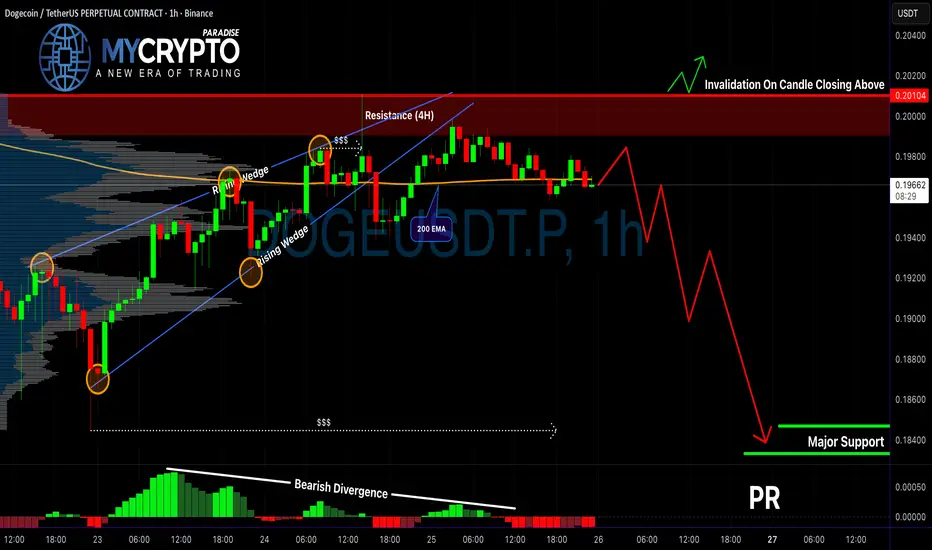
DOGE Is Setting Up for a Trap?Yello Paradisers, are you thinking of shorting DOGE right now? Be careful—this setup might look obvious, but it could also be the start of a classic trap. Let’s dig into what the charts are really telling us.
💎DOGEUSDT is currently reacting from a strong 4H resistance zone, which already gives us an early warning of potential rejection. Zooming into the 1H timeframe, price has broken down Rising wedge with bearish divergence. This isn’t just a random move; it's supported by confluence, especially with the 200 EMA acting as dynamic resistance on the 1H. That kind of layered rejection significantly increases the probability of a further bearish continuation.
💎For aggressive traders, there’s a potential to enter at the current price, but that comes with higher risk. For those who prefer a safer approach, the better play is to wait for a proper pullback and retest of the resistance zone. If the price returns to that level and forms a bearish candlestick pattern, it could provide a much cleaner and higher-probability short setup—along with a bigger reward-to-risk ratio.
💎However, if DOGE breaks out and closes a candle above the resistance zone, this would invalidate the entire bearish scenario. In that case, we’ll need to stay patient and wait for more reliable price action before making any decisions.
🎖Strive for consistency, not quick profits. Treat the market as a businessman, not as a gambler.
MyCryptoParadise
iFeel the success🌴
BB | BlackBerry Is About To Pop | LONGBlackBerry Ltd. engages in the provision of intelligent security software and services. It operates through the following segments: Cybersecurity, Internet of Things (IoT), and Licensing and Other. The Cybersecurity segment includes the brand Cylance, BlackBerry Spark, AtHoc, and SecuSUITE. The IoT segment focuses on software licenses, support, maintenance, and professional services. The Licensing and Other segment involves the intellectual property licensing arrangements and settlement awards. The company was founded by Michael Lazaridis, James Laurence Balsillie, and Douglas E. Fregin on March 7, 1984 and is headquartered in Waterloo, Canada.

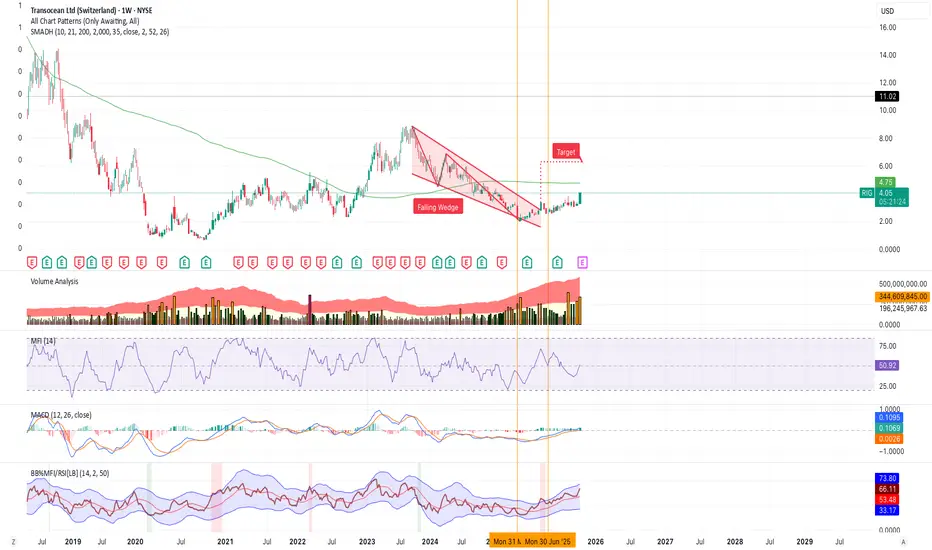
$RIG approaching 200W moving averageNYSE:RIG is approaching its 200-week smoothed moving average on unusually strong volume. I will be watching for a clear break and support on it. The last time this occurred, the stock doubled. With growing recent volume, a strong uptrend appears to be in play. This narrative could develop significantly if geopolitics continue to push oil and gas. Additionally, D. E. Shaw upped their holdings of NYSE:RIG by +1,000% last quarter (between the orange vertical lines), which I like to see.
GBPUSD Might Take Advantage of Broken WedgeGBPUSD presents a long opportunity after retesting the broken wedge. Entry is slightly above 1.34 with a target of 1.3490. The risk-reward ratio is 2.1.

NZDUSD; Ascending Channel!..Lets take a sight on NZDUSD:
The pair is scaling on a bullish trend of higher highs and higher lows, which currently the price is at the major resistance level. there is more possibility of breakout above the resistance with target towards 0.5800, in respect to the bigger time frames.
Possible outline:
As we expects a breakout above, the best alternative at the moment is to sell at resistance and buy at support.
Like and follow up.
Thanks for reading.

BTC 4h LONGCRYPTOCAP:BTC 4H Chart
Bitcoin breaking out from a falling wedge structure — a classic bullish reversal pattern.
Momentum indicators turning positive, confirming a potential trend shift.
📈 Entry: Upon breakout confirmation
🎯 TP1: 113K
🎯 TP2: 116K
🛡️ Stop-loss: Below 109K
If the wedge breakout holds, we could see a strong continuation move toward the upper targets.
#Bitcoin #BTC #Crypto #TradingView

USDCHF short calling this trade
USDCHF sell.
broke the rising wedge
creaated a continuation pattern for entry to the downside.
